Author Archive for InvestMacro – Page 192

DAX30 CFD breaking below EMA(200) – significant losses ahead?

By Admiral Markets

Source: Economic Events August 5, 2019 – Admiral Markets’ Forex Calendar

As we begin the trading week, we want to have a look at the DAX30 CFD. After the FED rate decision last Wednesday and the first hours of trading on Thursday, it looked as if the German index could easily stabilise above the psychological relevant level around 12,000 points.

This changed dramatically after US president Trump announced a new round of tariffs late last Thursday. Among them were 10% new tariffs on Chinese goods beginning September, pushing Equities aggressively lower and levelling the path for the DAX30 CFD to close the week below 12,000 points.

And with a thin economic docket today and the rest of the week, the approach seems to clearly be ‘sell the bounce’ as the German index is vulnerable to further losses, especially if the region around 11,900 points cannot be held.

A break below is also going hand in hand with a break back below the EMA(200) on a daily time frame, switching the overall mode to bearish again, and making it likely that bigger market participants start to unwind their long-positions in Equities.

Below 11,900 points the next target on the downside can be found around the June lows around 11,600 points:

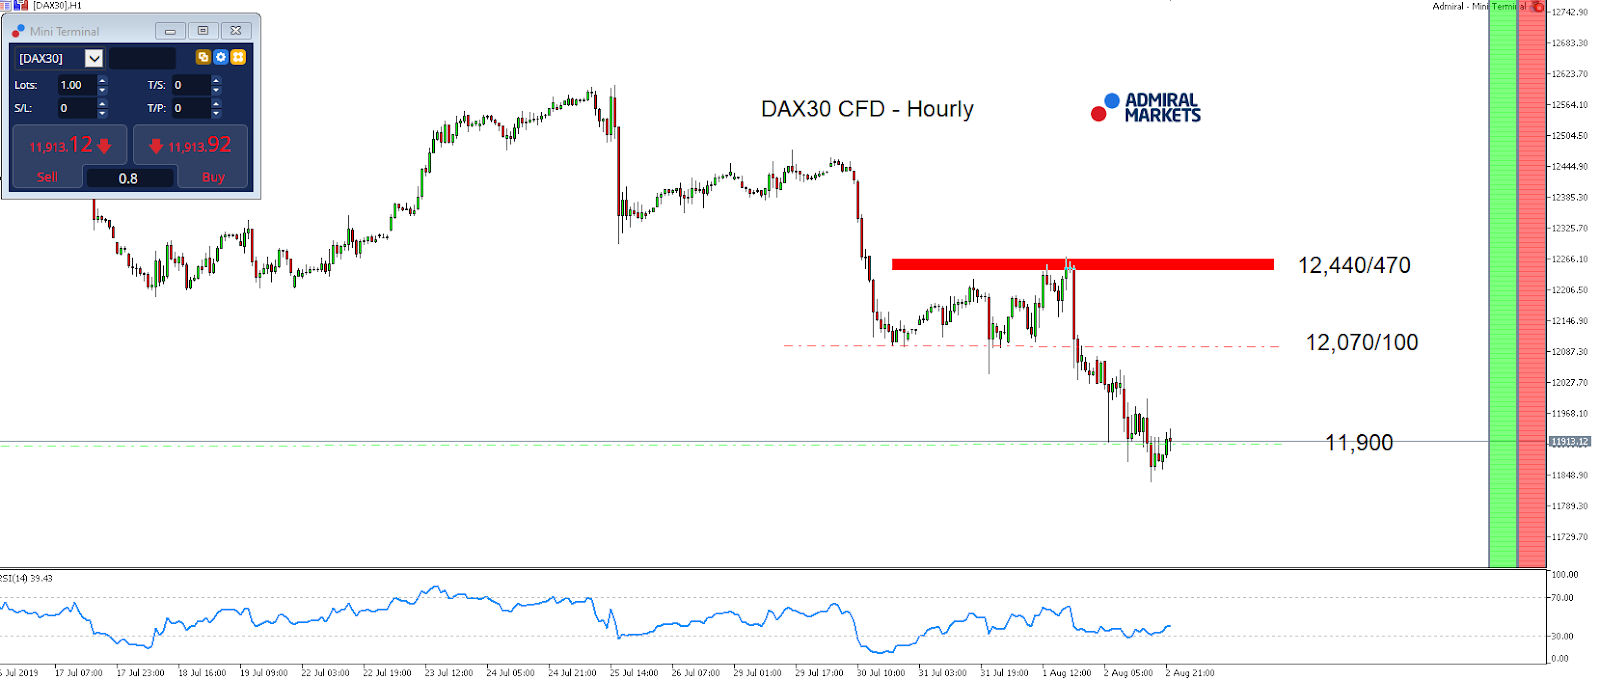
Source: Admiral Markets MT5 with MT5-SE Add-on DAX30 CFD Hourly chart (between July 16, 2019, to August 2, 2019). Accessed: August 2, 2019, at 10:00pm GMT – Please note: Past performance is not a reliable indicator of future results, or future performance.

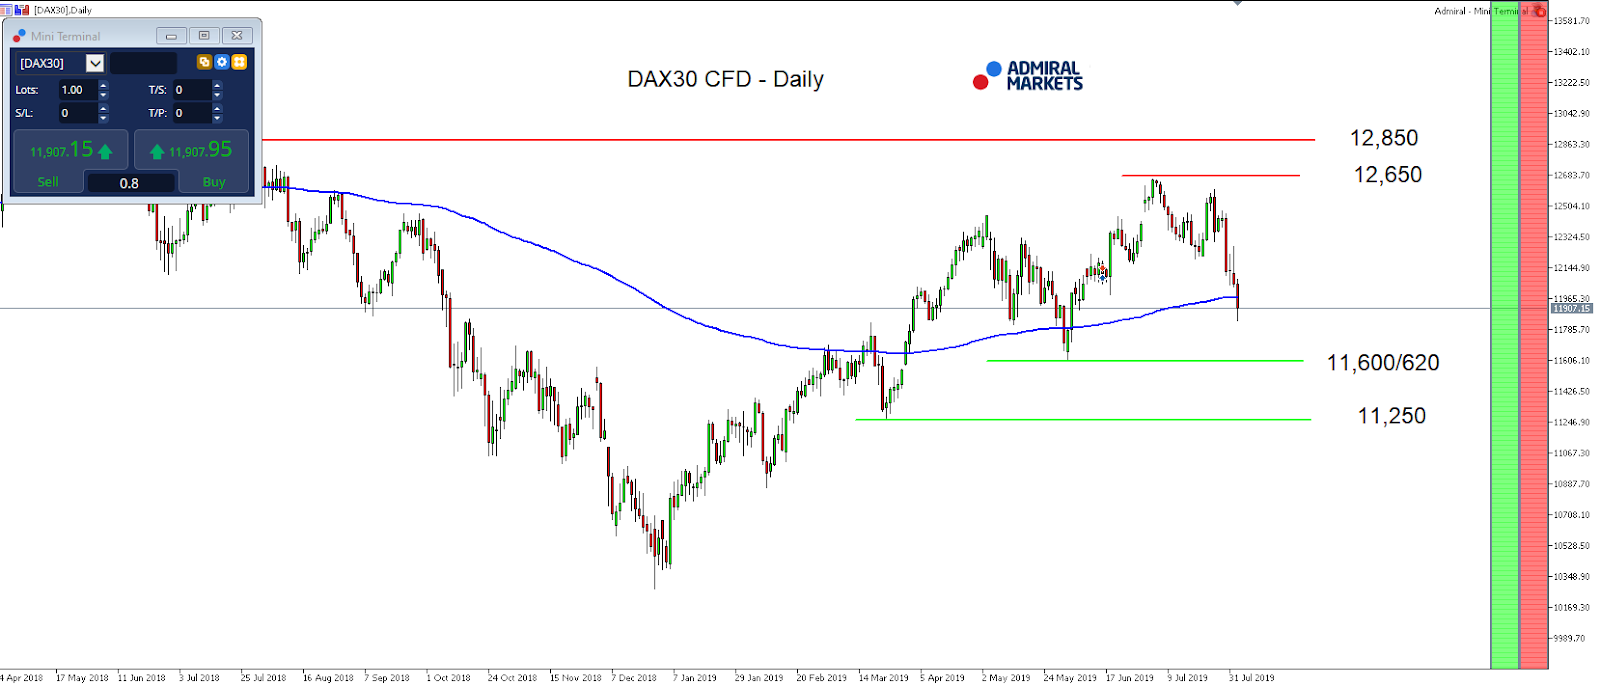
Source: Admiral Markets MT5 with MT5-SE Add-on DAX30 CFD daily chart (between April 24, 2018, to August 2, 2019). Accessed: August 2, 2019, at 10:00pm GMT – Please note: Past performance is not a reliable indicator of future results, or future performance.

In 2014, the value of the DAX30 CFD increased by 2.65%, in 2015, it increased by 9.56%, in 2016 it increased by 6.87%, in 2017 it increased by 12.51%, in 2018 it fell by 18.26%, meaning that after five years, it was up by 10.5%.

Discover the world’s #1 multi-asset platform

Admiral Markets offers professional traders the ability to trade with a custom, upgraded version of MetaTrader 5, allowing you to experience trading at a significantly higher, more rewarding level. Experience benefits such as the addition of the Market Heat Map, so you can compare various currency pairs to see which ones might be lucrative investments, access real-time trading data, and so much more. Click the banner below to start your FREE download of MT5 Supreme Edition!

Download MetaTrader 5 and begin trading today!

Disclaimer: The given data provides additional information regarding all analysis, estimates, prognosis, forecasts or other similar assessments or information (hereinafter “Analysis”) published on the website of Admiral Markets. Before making any investment decisions please pay close attention to the following:

  1. This is a marketing communication. The analysis is published for informative purposes only and are in no way to be construed as investment advice or recommendation. It has not been prepared in accordance with legal requirements designed to promote the independence of investment research, and that it is not subject to any prohibition on dealing ahead of the dissemination of investment research.
  2. Any investment decision is made by each client alone whereas Admiral Markets shall not be responsible for any loss or damage arising from any such decision, whether or not based on the Analysis.
  3. Each of the Analysis is prepared by an independent analyst (Jens Klatt, Professional Trader and Analyst, hereinafter “Author”) based on the Author’s personal estimations.
  4. To ensure that the interests of the clients would be protected and objectivity of the Analysis would not be damaged Admiral Markets has established relevant internal procedures for prevention and management of conflicts of interest.
  5. Whilst every reasonable effort is taken to ensure that all sources of the Analysis are reliable and that all information is presented, as much as possible, in an understandable, timely, precise and complete manner, Admiral Markets does not guarantee the accuracy or completeness of any information contained within the Analysis. The presented figures refer that refer to any past performance is not a reliable indicator of future results.
  6. The contents of the Analysis should not be construed as an express or implied promise, guarantee or implication by Admiral Markets that the client shall profit from the strategies therein or that losses in connection therewith may or shall be limited.
  7. Any kind of previous or modeled performance of financial instruments indicated within the Publication should not be construed as an express or implied promise, guarantee or implication by Admiral Markets for any future performance. The value of the financial instrument may both increase and decrease and the preservation of the asset value is not guaranteed.
  8. The projections included in the Analysis may be subject to additional fees, taxes or other charges, depending on the subject of the Publication. The price list applicable to the services provided by Admiral Markets is publicly available from the website of Admiral Markets.
  9. Leveraged products (including contracts for difference) are speculative in nature and may result in losses or profit. Before you start trading, you should make sure that you understand all the risks.

By Admiral Markets

EURUSD: bulls run out of steam at the 90th degree

By Alpari.com

Previous:

Trading on the safe haven currencies closed up last week, with everything else losing ground. The biggest loser against the US dollar was the pound (-1.80%), followed by the Aussie dollar (-1.60%), the Kiwi dollar (-1.45%), the Canadian dollar (-0.27%), and the euro (-0.17%). The yen posted a rise of 1.94% against the greenback, while the Swiss franc jumped 1.11%.

As the US-China trade conflict heated up once again, and investors retreated to the safe havens, the US jobs report was largely ignored. 164k new jobs were added outside the agricultural sector against a downwards revised reading of 193k for June (down from 244k). The reading for May was revised downwards from 72k to 62k, bringing the aggregate revision for the two months to -44k. The unemployment rate remained unchanged at 3.7%. Average hourly earnings rose by 0.3%, the same amount as the previous month.

The EURUSD pair traded within a 30-pip range. Judging by the chart, you wouldn’t have guessed that the NFP report came out on Friday.

Day’s news (GMT+3):

  • 10:50 France: Markit services PMI (Jul).
  • 10:55 Germany: Markit services PMI (Jul).
  • 11:00 Eurozone: Markit services PMI (Jul).
  • 11:30 UK: Markit services PMI (Jul).
  • 11:30 Eurozone: Sentix investor confidence (Aug).
  • 16:45 US: Markit services PMI (Jul).
  • 17:00 US: ISM non-manufacturing PMI (Jul).

EURUSD H1Current situation:

On Monday the 5th of August, trading on the euro opened up, with investors continuing their retreat towards safe haven assets on the back of increased trade tensions. Gold and yen are on the rise, the Chinese yuan has dropped against the US dollar, and Asian stocks are declining.

At the time of writing, the euro is trading at 1.1124 against the dollar. The pair is taking a breather at the 90th degree. There’s a chance the pair could move within a wedge formation to reach 1.1142. Given that the indicators are overbought, and that the market is in risk-off mode, I’m predicting a decline to 1.1110. I don’t think the pair will go any lower because of the fact that the euro is a funding currency, and as stocks begin to decline overseas, the Europeans will start opening long positions on the euro.

Iran has reportedly detained another tanker on the Strait of Hormuz, further increasing tensions with the US. If Trump insists on a military response, the rise on the EURUSD will continue all the way to 1.1175. There’s a crucial support level at the 45th degree (1.1080).

By Alpari.com

The US-China Relations Are Escalating

by JustForex

The US dollar is falling against a basket of currency majors due to the escalation of trade relations between the US and China. It should be recalled that US President, Donald Trump, promised to impose additional 10% tariffs on the remaining $300 billion worth of Chinese imports. This decision was caused due to the fact that China slowed down closing a trade deal with the US. In turn, China threatened to take retaliatory measures. The Chinese government has asked state-owned enterprises to suspend imports of US agricultural products. The US dollar index (#DX) closed Friday’s trading session in the negative zone (-0.30%).

On Friday, mixed economic data on the US labor market were also published. So, the number of people employed in the nonfarm sector counted to 164K in July, which met the expectations of investors. However, the previous value was revised downward from 224K to 193K. The unemployment rate counted to 3.7% in July, which also met experts’ forecasts. The growth of the average hourly earnings exceeded market expectations and counted to 0.3% (m/m). Today we expect the publication of important economic data from Germany, the UK, and the US.

The “black gold” prices show negative dynamics. Currently, futures for the WTI crude oil are testing the $54.70 mark.

Market Indicators

On Friday, aggressive sales were observed in the US stock markets: #SPY (-0.75%), #DIA (-0.36%), #QQQ (-1.47%).

The 10-year US government bonds yield has updated local lows. At the moment, the indicator is at the level of 1.75-1.76%.

The news feed for 2019.08.05:

– Some indicators on economic activity in Germany and the Eurozone at 10:55 (GMT+3:00) and 11:00 (GMT+3:00), respectively;
– UK services PMI at 11:30 (GMT+3:00);
– ISM non-manufacturing PMI in the US at 17:00 (GMT+3:00).

by JustForex

Palladium collapses After Our Double-Top From Early July 2019

By TheTechnicalTraders.com

It was almost like Palladium traders followed our research to the letter when the trend reversed on July 11, 2019.  Our research team issued a report indicating a Double-Top pattern was setting up in Palladium on July 3, 2019.  At that time, our proprietary cycle indicators and our proprietary Fibonacci price modeling systems suggested a large downside price swing was highly likely.

January 24, 2018: HAVE YOU SEEN PALLADIUM’S TRADABLE PRICE PATTERN?

July 3, 2019: PALLADIUM SETS UP ANOTHER DOUBLE TOP PATTERN

Palladium is a very interesting metal that is used in various industry sectors as a component for automobile equipment/parts, medical equipment, and many other industrial sectors.  It is a great leading indicator to help gauge future expectations for various global industries and as a measure of consumer/industrial consumption and expectations.  When Palladium is rallying, it is a fairly solid sign that consumers are bullish on the global economy and are purchasing equipment, autos and other industrial elements to support future growth expectations.  When Palladium is falling, it is a fairly solid sign that consumers are reigning in their spending on new cars and other industrial items that are manufactured with Palladium.

One of the biggest factors that are likely driving this move in Palladium is the renewed interest in Gold and Silver as the global market enters a very fragile period.  Palladium is a precious metal that is used in jewelry and other consumer products – like Gold and Silver.  Yet Palladium does not have the status in the precious metals world like Gold and Silver do.  When fear and greed enter the markets, Gold, Silver, and Platinum take center-stage.  Palladium, because of its more industrial use base, its not something that will rally like Gold and Silver will when a crisis hits.

This Daily Palladium chart shows how the weakness in price started just after the price peak on July 11, 2019.  Over the past 3+ weeks, Palladium rotated downward towards the $1500 price level, then stalled.  Global traders were focused on earnings data, the US Fed announcement, and other data.

The recent breakdown is a result of three factors

_ US Fed rates decrease (expecting weaker global economic output)

_ The rally in Gold and Silver (where global traders are starting to focus their attention)

_ The fragility of global economic/trade functions that continue to plague the global markets

These three factors will move the focus away from industrial use metals (Copper, Palladium, and Aluminum) and towards the more traditional Gold/Silver moves.

This Weekly Palladium chart highlights the Fibonacci price modeling system’s lower target levels.  Pay attention to the fact that $1315 and $1000 are key downside target levels in Palladium.  The Daily chart Fibonacci levels suggest that minor support may be found near $1400.  The Weekly Fibonacci chart suggests major support is really down near $1000.

CONCLUDING THOUGHTS:

We believe once the $1475 level is breached to the downside, Palladium will quickly fall to levels near $1300 before briefly stalling and attempting to find support.  This move in Palladium aligns almost perfectly with our August 19 US market “Peak” prediction from months ago.  We believe the ultimate lower levels, near $1000, are a very strong possibility over the next 3+ months as we believe the global markets, and the US markets, are setting up for a fairly big price rotation after August 19, 2019.

Don’t miss any of these big moves or our incredible research posts.  Find out how www.TheTechnicalTraders.com can help you find and execute better trades and prepare for these big price swings that are about to explode.

NEXT TRENDS FOR GOLD, SILVER, MINERS, AND S&P 500

In early June I posted a detailed video explaining in showing the bottoming formation and gold and where to spot the breakout level, I also talked about crude oil reaching it upside target after a double bottom, and I called short term top in the SP 500 index. This was one of my premarket videos for members it gives you a good taste of what you can expect each and every morning before the Opening Bell. Watch Video Here.

I then posted a detailed report talking about where the next bull and bear markets are and how to identify them. This report focused mainly on the SP 500 index and the gold miners index. My charts compared the 2008 market top and bear market along with the 2019 market prices today. See Comparison Charts Here.

On June 26th I posted that silver was likely to pause for a week or two before it took another run up on June 26. This played out perfectly as well and silver is now head up to our first key price target of $17. See Silver Price Cycle and Analysis.

More recently on July 16th, I warned that the next financial crisis (bear market) was scary close, possibly just a couple weeks away. The charts I posted will make you really start to worry. See Scary Bear Market Setup Charts.

In short, you should be starting to get a feel of where each commodity and asset class is headed for the next 8+ months. The next step is knowing when and what to buy and sell as these turning points take place, and this is the hard part. If you want someone to guide you through the next 12-24 months complete with detailed market analysis and trade alerts (entry, targets and exit price levels) join my ETF Trading Newsletter.

Be prepared for these incredible price swings before they happen and learn how you can identify and trade these fantastic trading opportunities in 2019, 2020, and beyond with our  Wealth Building & Global Financial Reset Newsletter.  You won’t want to miss this big move, folks.  As you can see from our research, everything has been setting up for this move for many months.

Join me with a 1 or 2-year subscription to lock in the lowest rate possible and ride my coattails as I navigate these financial market and build wealth while others lose nearly everything they own during the next financial crisis.

As a technical analysis and trader since 1997, I have been through a few bull/bear market cycles. I believe I have a good pulse on the market and timing key turning points for both short-term swing trading and long-term investment capital. The opportunities starting to present themselves will be life-changing if handled properly.

FREE GOLD OR SILVER WITH MEMBERSHIP!

Kill two birds with one stone and subscribe for two years to get your FREE PRECIOUS METAL and get enough trades to profit through the next metals bull market and financial crisis!

Chris Vermeulen – TheTechnicalTraders.com


Is This The Start Of The Next Bear Market?

By TheTechnicalTraders.com

Over the past few days, we’ve received hundreds of emails from our followers and members asking if this is the big breakdown that everyone has been expecting in the markets.  Yes, we’ve warned that it will likely happen before the end of 2019, but we’ve also been very clear that we believe an August 19, 2019 price peak will setup this move and our recent research suggest the NQ will rally to levels above 8200 before this peak in the US market sets up.  So, in order to help our members and followers understand what we believe is actually happening in the markets, we’ve put together this research post to help everyone better prepare for the next few weeks and months.

First things first, the foundation of Fibonacci price theory is that price will always attempt to seek out new price highs or new price lows – ALWAYS.  Many of the US major indexes have recently established new price highs in early July 2019.  Think of this as a fundamental element in price structure when attempting to apply Fibonacci price theory.

When any chart establishes a new price high (a high price that is above the previous rotational peak level in price), the trend is established as BULLISH and we would immediately expect, at some future time, that price will rotate lower attempting to validate that new price high or attempt to reach a new price low.  At certain times, external news can create “price over-reaction” events within the scope of price volatility.  I’m certain many of you have experienced these types of expanded price ranges that turn into a “wash-out” type of wide-range rotations in the markets.

The combination of the US Fed and the US/China trade talk failures, as well as the rally in Gold, Silver and the US Dollar, are all acting to create a hyper-active rotation in the markets with larger volatility.

We suggest that everyone read these earlier research posts to better understand what is really happening in the markets right now :

July 30, 2019: August 19 Market Top Prediction

July 31, 2019: US Fed is rattling the global markets – Part II

It is our opinion that the US Fed announcement followed immediately by the US/China trade talk failure created a “hyper-active” price rotation event that will likely turn into a short-term buying opportunity.  Our Adaptive Dynamic Learning (ADL) predictive modeling system is suggesting the NQ will attempt to target levels above 8200 before the August 19, 2019 peak sets up.  Therefore, it is still our belief that the markets are setting up a unique “price anomaly” with this current downside price rotation and that a move higher is in the works before the bigger downside price rotation actually begins.

This Daily NQ chart highlights the support level near 7600 that was set up by the June 2019 price rotation.  Yes, the price has moved lower into this zone, but we believe this zone will act as a moderate support level and that price will rotate higher early in the week of August 5, 2019.

This Weekly NQ chart highlights our Fibonacci price modeling system and shows the “Critical Support” level from the October 2018 highs as well as the Bullish/Bearish trigger levels (the RED/GREEN lines near the right edge of the chart) that constitute confirmed price rotations.  At this time, the current BEARISH trigger levels are near 7540 and the NQ is still 140 points above this level.

NEXT MOVES FOR GOLD, SILVER, MINERS, AND S&P 500

In early June I posted a detailed video explaining in showing the bottoming formation and gold and where to spot the breakout level, I also talked about crude oil reaching it upside target after a double bottom, and I called short term top in the SP 500 index. This was one of my premarket videos for members it gives you a good taste of what you can expect each and every morning before the Opening Bell. Watch Video Here.

I then posted a detailed report talking about where the next bull and bear markets are and how to identify them. This report focused mainly on the SP 500 index and the gold miners index. My charts compared the 2008 market top and bear market along with the 2019 market prices today. See Comparison Charts Here.

On June 26th I posted that silver was likely to pause for a week or two before it took another run up on June 26. This played out perfectly as well and silver is now head up to our first key price target of $17. See Silver Price Cycle and Analysis.

More recently on July 16th, I warned that the next financial crisis (bear market) was scary close, possibly just a couple weeks away. The charts I posted will make you really start to worry. See Scary Bear Market Setup Charts.

CONCLUDING THOUGHTS:

We believe this current downside price move is setting up to become an over-reaction price swing that will likely result in a very short-term buying opportunity for skilled technical traders.  Failure to reach levels below 7400 on the NQ would be a very strong indication that this is a “failed new price low rotation” on the Weekly chart.  And, as Fibonacci price theory suggests, price must always attempt to establish a new price high or new price low – at all times.  Thus, a failure to establish a new price low on this weekly chart would mean it MUST rotate higher to attempt to establish a new price high.  8200+, here we come.

In short, you should be starting to get a feel of where each commodity and asset class is headed for the next 8+ months. The next step is knowing when and what to buy and sell as these turning points take place, and this is the hard part. If you want someone to guide you through the next 12-24 months complete with detailed market analysis and trade alerts (entry, targets and exit price levels) join my ETF Trading Newsletter.

Be prepared for these incredible price swings before they happen and learn how you can identify and trade these fantastic trading opportunities in 2019, 2020, and beyond with our  Wealth Building & Global Financial Reset Newsletter.  You won’t want to miss this big move, folks.  As you can see from our research, everything has been set up for this move for many months.

Join me with a 1 or 2-year subscription to lock in the lowest rate possible and ride my coattails as I navigate these financial market and build wealth while others lose nearly everything they own during the next financial crisis.

As a technical analysis and trader since 1997, I have been through a few bull/bear market cycles. I believe I have a good pulse on the market and timing key turning points for both short-term swing trading and long-term investment capital. The opportunities starting to present themselves will be life-changing if handled properly.

FREE GOLD OR SILVER WITH MEMBERSHIP!

Kill two birds with one stone and subscribe for two years to get your FREE PRECIOUS METAL and get enough trades to profit through the next metals bull market and financial crisis!

Chris Vermeulen – TheTechnicalTraders.com


Market Reaction to Fed Cut Unexpected

Natural Gas, Bitcoin bucking today’s market trend

By TheTechnicalTraders.com

The Week Ahead: Friday 2nd August 2019 – Currency Point – XAU hit by USD

By Evan Lucas, FPMarkets.com

Currency Point – XAU hit by USD

Everyone is talking about the ‘hawkish cut’ and the reweighting taking place in FX.

The strength of the USD should not be underestimated, it has seen GBP, AUD, EUR and NZD get pounded to multi-year lows.

It was even more painful when you factor in Powell’s testimony; his bumbling and inability to clarify the Board’s reasoning for cutting rates put an even bigger rocket under the USD and will have hurt positions.

However, since the FOMC meeting the dust has settled a bit. Market pricing of the Fed Funds futures has actually returned to levels seen pre the July 31 st meeting. The most notable part is the October 30th meeting is being price at an 82% of another cut.

This should filter into FX over the next period, make no mistake the higher the USD goes the bigger the risk setbacks build in markets. The Fed and the President for that matter will want to address this quick – accommodation is still coming.

However, there is another trade that is presenting here post the Federal Reserve – XAU

XAU’s initial reaction to the ‘hawkish cut’ was a swift move lower. However, this dip was quickly bid up by the market as its focus shifted to the economic implications of the Hawkish Fed. Sentiment also seen in US equities and the broader risk-off sentiment which supports our trade idea in gold, this being:

Long XAU – Entry: $1,425, Stop: $1,409 Target: $1,500 on break above $1,453

Over the past month XAU as broken out of its long-term wedge pattern formed in late July 2016 to August 2018. Creating a new trend line starting from the August 18 low to July 19 high, which has now created a $1,453 resistance level.

If we look at levels past the $1453 resistance XAU would effectively open up a new topside and the trend lines suggest there could be a continuation to a new level of $1,568 to $1,595 on a Fibonacci derivation. Thus a break here would see us adding to our trade.

Adding the technical to the fundamental justification an XAU long position could be advantageous.

By Evan Lucas, FPMarkets.com


Small Caps Setup A Very Rare & Interesting Price Pattern

By TheTechnicalTraders.com

Our researchers have identified a very rare type of price pattern that is typically associated with explosive trend changes and trends.  We call this type of pattern a “Sandwich” pattern because of how price reacts within a range.  The IWM, Russell 2000 ETF, is illustrating a nearly perfect example of this pattern right now.

Daily IWM chart (Russell 2000 Small Cap Index)

This close up view of the Daily IWM chart highlights the Sandwich pattern over the most recent 5 trading days and how price enters this volatile period, rotates around within a range, then settles near the upper or lower end of the range before a price breakout occurs.  Notice the earlier Sandwich pattern setup and how price settled near the bottom of the range before a downside price leg pushed the price much lower.

It is our belief that the IWM could be setting up for a significant reversal or breakout based on this Sandwich pattern os be ready for an extended move.

Longer-term View of the Daily IWM chart

Here is a longer-term Daily IWM chart that highlights previous Sandwich patterns for you to review. We go into more detail and a very interesting setup in the IWM and transportation index that took place in 2008, same set up we see now. See charts and report here.

One thing to understand about the Sandwich pattern is that it is an early warning sign that price has reached an inflection point and will likely attempt to break out or reverse down from the ranges set up within the Sandwich pattern.

Also, you can see from the examples, above, that these patterns can take many bars to form and are sometimes somewhat convoluted in structure.  The most recent Sandwich pattern is unique because it is very defined over the past 5+ days.  We believe an upside price pop to the upside could turn into a “washout high” price setup.

Compare this price activity to the SPY chart and you’ll see that the IWM, Small Caps, are operating as a leading price indicator for the potential breakout/breakdown move that may happen in the immediate future.  We see similar types of price rotation, but nothing as clear as we see on the IWM chart.

The fed news is shaking things up and our analysis stats this month could be the market top. We expect Aug 19th-ish… but this month is the window we feel it may happen. Stay tuned to our research – this is going to be fun to trade.

WARNING SIGNS ABOUT GOLD, SILVER, MINERS, AND S&P 500

In early June I posted a detailed video explaining in showing the bottoming formation and gold and where to spot the breakout level, I also talked about crude oil reaching it upside target after a double bottom, and I called short term top in the SP 500 index. This was one of my premarket videos for members it gives you a good taste of what you can expect each and every morning before the Opening Bell. Watch Video Here.

I then posted a detailed report talking about where the next bull and bear markets are and how to identify them. This report focused mainly on the SP 500 index and the gold miners index. My charts compared the 2008 market top and bear market along with the 2019 market prices today. See Comparison Charts Here.

On June 26th I posted that silver was likely to pause for a week or two before it took another run up on June 26. This played out perfectly as well and silver is now head up to our first key price target of $17. See Silver Price Cycle and Analysis.

More recently on July 16th, I warned that the next financial crisis (bear market) was scary close, possibly just a couple weeks away. The charts I posted will make you really start to worry. See Scary Bear Market Setup Charts.

CONCLUDING THOUGHTS:

In short, you should be starting to get a feel of where each commodity and asset class is headed for the next 8+ months. The next step is knowing when and what to buy and sell as these turning points take place, and this is the hard part. If you want someone to guide you through the next 12-24 months complete with detailed market analysis and trade alerts (entry, targets and exit price levels) join my ETF Trading Newsletter.

Be prepared for these incredible price swings before they happen and learn how you can identify and trade these fantastic trading opportunities in 2019, 2020, and beyond with our  Wealth Building & Global Financial Reset Newsletter.  You won’t want to miss this big move, folks.  As you can see from our research, everything has been setting up for this move for many months.

Join me with a 1 or 2-year subscription to lock in the lowest rate possible and ride my coattails as I navigate these financial market and build wealth while others lose nearly everything they own during the next financial crisis.

As a technical analysis and trader since 1997, I have been through a few bull/bear market cycles. I believe I have a good pulse on the market and timing key turning points for both short-term swing trading and long-term investment capital. The opportunities starting to present themselves will be life-changing if handled properly.

FREE GOLD OR SILVER WITH MEMBERSHIP!

Kill two birds with one stone and subscribe for two years to get your FREE PRECIOUS METAL and get enough trades to profit through the next metals bull market and financial crisis!

Chris Vermeulen – TheTechnicalTraders.com


Forex Technical Analysis & Forecast 02.08.2019 (EURUSD, GBPUSD, USDCHF, USDJPY, AUDUSD, USDRUB, GOLD, BRENT)

Article By RoboForex.com

EURUSD, “Euro vs US Dollar”

EURUSD has returned to 1.1080; right now, it is consolidating around this level. Possibly, the pair may form a new descending impulse to reach 1.1066 and then start a new growth with the target at 1.1081 or even 1.1100. Later, the market may continue trading downwards with the target at 1.1000.

EURUSD
Risk Warning: the result of previous trading operations do not guarantee the same results in the future

GBPUSD, “Great Britain Pound vs US Dollar”

GBPUSD is still consolidating around 1.2110. Today, the pair may form a new descending structure towards 1.2070 and then start another growth to return to 1.2110. After that, the instrument may continue trading inside the downtrend with the short-term target at 1.2044.

GBPUSD
Risk Warning: the result of previous trading operations do not guarantee the same results in the future

USDCHF, “US Dollar vs Swiss Franc”

USDCHF is forming the first ascending impulse with the target at 0.9900.After that, the instrument may start another decline towards 0.9888 and then form one more ascending structure with the first target at 0.9934.

USDCHF
Risk Warning: the result of previous trading operations do not guarantee the same results in the future

USDJPY, “US Dollar vs Japanese Yen”

USDJPY is forming another descending wave with the target at 106.11; it has formed a downside continuation pattern at 107.38. Today, the pair may test 107.20 from below and then fall to reach the above-mentioned target. Later, the market may start a new correction to reach 108.00.

USDJPY
Risk Warning: the result of previous trading operations do not guarantee the same results in the future

AUDUSD, “Australian Dollar vs US Dollar”

After breaking 0.6830, AUDUSD has expanded its consolidation to the downside. Possibly, today the pair may return to 0.6830 to test it from below and then continue trading downwards with the target at 0.6755.

AUDUSD
Risk Warning: the result of previous trading operations do not guarantee the same results in the future

USDRUB, “US Dollar vs Russian Ruble”

USDRUB has reached the first correctional target at 64.00. Today, the pair may form a new descending structure with the first target at 63.22.

USDRUB
Risk Warning: the result of previous trading operations do not guarantee the same results in the future

XAUUSD, “Gold vs US Dollar”

After completing another ascending structure at 1440.14 and forming another consolidation range around this level, Gold has broken it to the downside; right now, it is forming the second descending impulse with the target at 1427.05. After that, the instrument may start a new growth towards 1434600 and then form one more ascending structure to with the first target at 1423.23.

GOLD
Risk Warning: the result of previous trading operations do not guarantee the same results in the future

BRENT

After finishing the descending wave at 60.21, Brent has formed a new rising impulse towards 62.40; right now, it is being corrected with the target at 61.25. Later, the market may start another growth with the short-term target at 63.63.

BRENT
Risk Warning: the result of previous trading operations do not guarantee the same results in the future

Article By RoboForex.com

Attention!
Forecasts presented in this section only reflect the author’s private opinion and should not be considered as guidance for trading. RoboForex LP bears no responsibility for trading results based on trading recommendations described in these analytical reviews.

Fibonacci Retracements Analysis 02.08.2019 (BITCOIN, ETHEREUM)

Article By RoboForex.com

Fibonacci Retracements Analysis 02.08.2019 (BITCOIN, ETHEREUM)

As we can see in the daily chart, BTCUSD is still testing 38.2% fibo. The nest downside targets may be 50.0% and 61.8% fibo at 8600.00 and 7370.00 respectively. The resistance is 23.6% fibo at 11375.00.

BITCOIN
Risk Warning: the result of previous trading operations do not guarantee the same results in the future

In the H4 chart, the pair is being corrected to the downside. The first correctional wave has almost reached 50.0% at 11145.00. The next wave may test this level and then grow towards 61.8% fibo at 11629.00. The support is the low at 9098.90.

BTCUSD
Risk Warning: the result of previous trading operations do not guarantee the same results in the future

ETHUSD, “Ethereum vs. US Dollar”

As we can see in the daily chart, ETHUSD is still being corrected between 50.0% and 61.8% fibo. After completing the correction, the pair may fall towards 76.0% fibo at 163.50. The resistance is 38.2% fibo at 262.80.

ETHUSD
Risk Warning: the result of previous trading operations do not guarantee the same results in the future

The H4 chart shows more detailed structure of the current correction. After testing 23.6% fibo for the second time, the pair may grow to reach 38.2% and 50.0% fibo at 239.45 and 254.30 respectively. If the price breaks the low at 190.41, the instrument may resume its mid-term decline.

ETHEREUM

Article By RoboForex.com

Attention!
Forecasts presented in this section only reflect the author’s private opinion and should not be considered as guidance for trading. RoboForex LP bears no responsibility for trading results based on trading recommendations described in these analytical reviews.