Author Archive for InvestMacro – Page 155

The Analytical Overview of the Main Currency Pairs on 2019.10.17

by JustForex

The EUR/USD currency pair

Technical indicators of the currency pair:
  • Prev Open: 1.10322
  • Open: 1.10715
  • % chg. over the last day: +0.38
  • Day’s range: 1.10694 – 1.10847
  • 52 wk range: 1.0884 – 1.1623

USD continues to lose ground relative to a basket of world currencies. Yesterday, the growth of EUR/USD quotes exceeded 40 points. The trading instrument approached two-month highs. The US currency came under pressure after the release of a weak US retail sales report for September. At the same time, the growth of the euro was restrained against the background of pessimistic data on inflation in the EU. Financial market participants are waiting for new information regarding the settlement of the trade conflict between Washington and Beijing. Today, investors will evaluate important statistical data from the United States. Positions must be opened from key levels.

The Economic News Feed for 17.10.2019:

  • – A number of indicators on the real estate market (US) – 15:30 (GMT+3:00);
  • – PMI by Philadelphia’s Fed (US) – 15:30 (GMT+3:00);
EUR/USD

The price fixed above 50 MA and 100 MA, which signals the strength of buyers.

The MACD histogram is in the positive zone, but below the signal line, which gives a weak signal to buy EUR/USD.

The Stochastic Oscillator is in the neutral zone, the %K line is below the %D line, which indicates a bearish sentiment.

Trading recommendations
  • Support levels: 1.10550, 1.10200, 1.09900
  • Resistance levels: 1.10850, 1.11000, 1.11300

If the price consolidates above the resistance level of 1.10850, expect further growth toward 1.11200-1.11400.

Alternatively, the quotes could decrease toward 1.10300-1.10100.

The GBP/USD currency pair

Technical indicators of the currency pair:
  • Prev Open: 1.27777
  • Open: 1.28255
  • % chg. over the last day: +0.25
  • Day’s range: 1.27492 – 1.28337
  • 52 wk range: 1.1959 – 1.3385

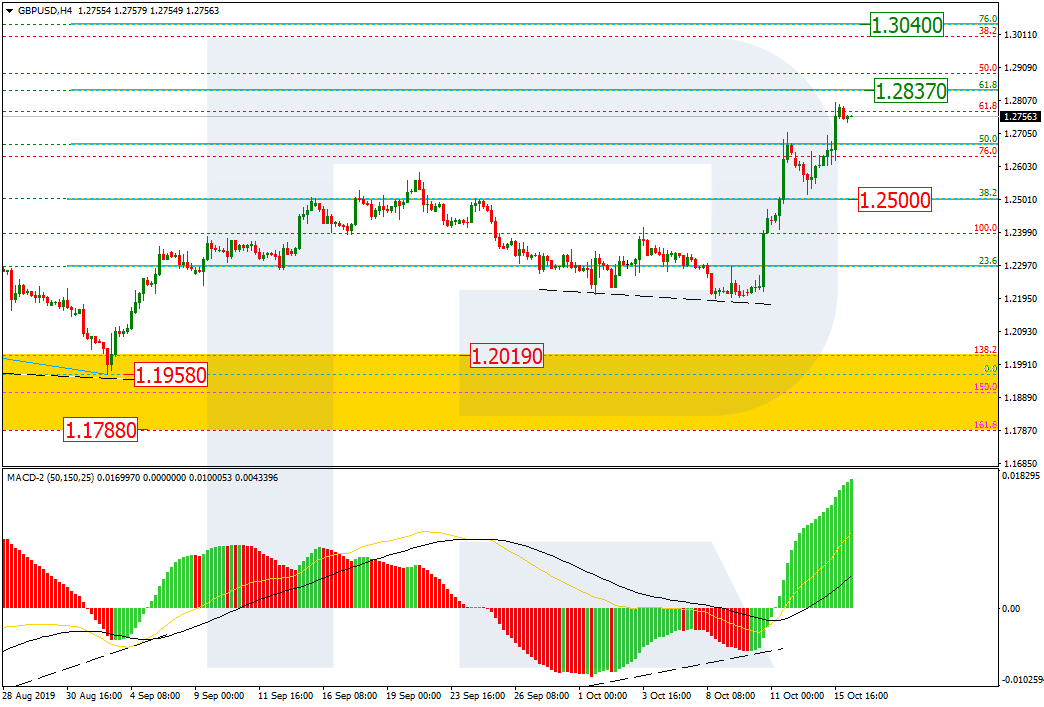
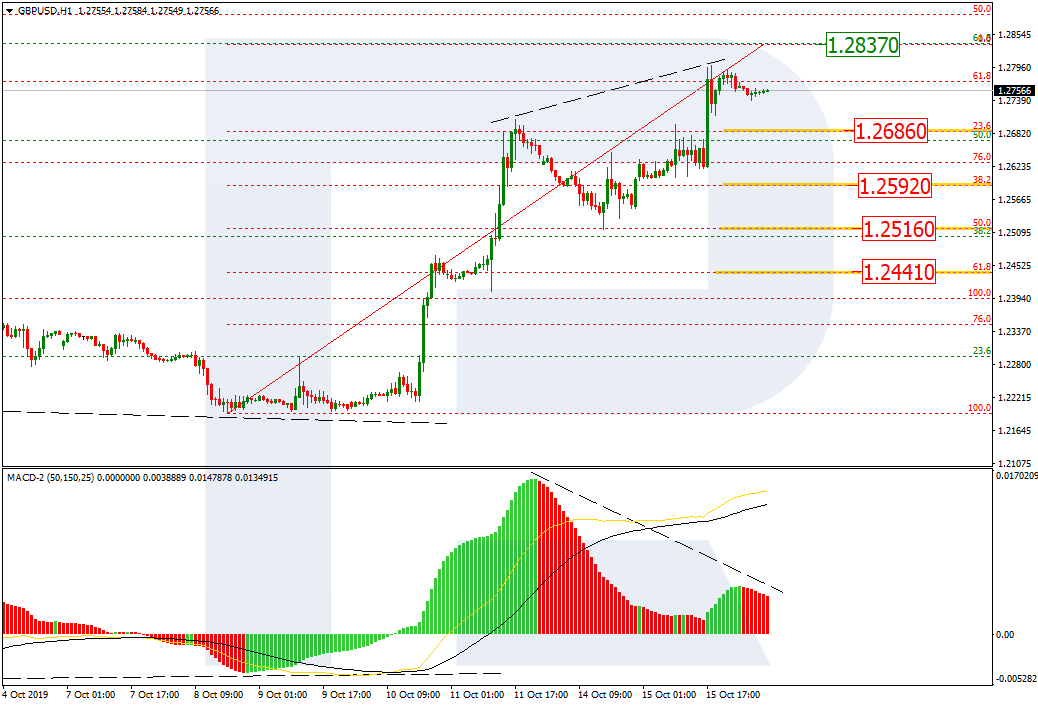
The GBP/USD currency pair stabilized after a significant rally. Investors began to partially fix their positions before the summit of the EU leaders of the European Union, which will be held on Thursday and Friday. Sterling is currently consolidating. The local support and resistance levels are 1.27450 and 1.28550, respectively. In the near future, technical correction is not ruled out. Today, financial market participants will evaluate important economic releases from the UK and the USA. We recommend opening positions from key levels.

At 11:30 (GMT + 3: 00), UK will publish reports on retail sales for September.

GBP/USD

Indicators do not give accurate signals: the price crossed 50 MA.

The MACD histogram has started to decline, indicating a possible correction of the GBP/USD currency pair.

The Stochastic Oscillator is in the neutral zone, the %K line is below the %D line, which gives a signal to sell GBP/USD.

Trading recommendations
  • Support levels: 1.27450, 1.26500, 1.25300
  • Resistance levels: 1.28550, 1.29000

If the price consolidates below 1.27450, expect a correction toward 1.26800-1.26300.

Alternatively, the quotes could grow toward 1.29000.

The USD/CAD currency pair

Technical indicators of the currency pair:
  • Prev Open: 1.31988
  • Open: 1.31997
  • % chg. over the last day: +0.02
  • Day’s range: 1.31914 – 1.32117
  • 52 wk range: 1.2727 – 1.3664

CAD is still in a lateral movement. The technical picture is ambiguous. At the moment, the local support and resistance levels are: 1.31850 and 1.32150, respectively. USD / CAD quotes have the potential to decline. Financial market participants took a wait and see attitude before publishing important economic reports from the USA. We also recommend paying attention to the dynamics of oil quotes. Positions must be opened from key levels.

At 15:30 (GMT + 3: 00), a report will be published on sales in the manufacturing sector of Canada.

USD/CAD

Indicators do not give accurate signals: the price crossed 50 MA.

The MACD histogram is close to 0.

The Stochastic Oscillator is in the overbought zone, the %K line crossed the %D line. There are no signals at the moment.

Trading recommendations
  • Support levels: 1.31850, 1.31700
  • Resistance levels: 1.32150, 1.32400, 1.32700

If the price consolidates below 1.31850, expect a drop toward 1.31600-1.31300.

Alternatively, the quotes could grow toward 1.32400-1.32700.

The USD/JPY currency pair

Technical indicators of the currency pair:
  • Prev Open: 108.848
  • Open: 108.751
  • % chg. over the last day: -0.16
  • Day’s range: 108.646 – 108.828
  • 52 wk range: 104.97 – 114.56

The USD/JPY currency pair stabilized after continued growth. The trading instrument is currently consolidating. USD/JPY quotes test local support and resistance levels: 108.550 and 108.900, respectively. In the near future, technical correction is not ruled out. We look forward to publishing important economic releases from the USA. We also recommend keeping track of up-to-date information regarding trade negotiations between Washington and Beijing. Positions must be opened from key levels.

The Economic News Feed for 17.10.2019 is calm.

USD/JPY

Indicators do not give accurate signals: the price is testing 50 MA.

The MACD histogram has approached the 0 mark.

The Stochastic Oscillator is in the neutral zone, the %K line is below the %D line, which indicates a bearish sentiment.

Trading recommendations
  • Support levels: 108.550, 108.200, 107.850
  • Resistance levels: 108.900, 109.300, 109.600

If the price consolidates above 108.900, expect further growth toward 109.300-109.500.

Alternatively, expect the quotes to fall toward 108.250-108.000.

by JustForex

EURUSD: expect a test of 1.1110

By Alpari.com

On Wednesday the 16th of October, trading on the euro closed up. The euro shot up following the release of weak US data. Retail sales in the US in September were much lower than expected. The EURUSD rate rose to 1.1084. This growth was also helped along by positive news on the Brexit front. Reports indicate that the UK and EU are close to agreeing a deal.

Day’s news (GMT+3):

  • 11:30 UK: retail sales (Sep).
  • 15:30 Canada: factory orders (Aug).
  • 15:30 US: Philadelphia Fed manufacturing index (Oct), building permits (Sep), housing starts (Sep), initial jobless claims (14 Oct).
  • 16:15 US: industrial production (Sep).

EURUSD H1Current situation:

Yesterday’s expectations were met in full. The pair reached its predicted level of 1.1070. The intraday high was recorded at 1.1088.

At the time of writing, the euro is trading at 1.1077. We’ve highlighted an “imbalance zone” at 1.1052 – 1.1068. The stochastic is down, so the bulls have a chance to test the upper line of the channel. Moreover, the EURGBP cross currently favours the bulls due to the pound’s decline.

The GBPUSD pair dropped over reports that the Northern-Irish Democratic Unionist Party has said that some key parts of the proposed Brexit deal are unacceptable, throwing a spanner in the works as London and Brussels are looking to finalise an agreement. The pound has moved far enough to allow for a correction, so on the back of a weakened pound and US dollar, the euro has every chance of moving upwards.

By Alpari.com

Pound to hit $1.35 and UK financial assets to rally if new Brexit deal is approved

By George Prior

The pound is rallying and UK financial assets are being given a boost following news that a Brexit deal has been agreed between UK and EU negotiators before a meeting of European leaders in Brussels on Thursday.

The optimistic message from Nigel Green, the CEO and founder of deVere Group, one of the world’s largest independent financial advisory organizations, comes after the UK Prime Minister Boris Johnson and EU Commission President Jean-Claude Juncker confirm a deal has been agreed.

However, it will still need the approval of both the UK and European parliaments.

Mr Johnson tweeted: “We’ve got a great new deal that takes back control.”

Meanwhile, Mr Juncker wrote: “Where there is a will, there is a #deal – we have one! It’s a fair and balanced agreement for the EU and the UK and it is testament to our commitment to find solutions. I recommend that #EUCO endorses this deal.”

Mr Green says: “The pound has soared above $1.29 for the first time since May on reports that a Brexit deal has been reached and UK stocks are boosted in a relief rally.

“However, the rally is currently being tempered as it needs to get through the UK and EU parliaments.

“There does seem to be some question marks remaining over the DUP’s support, which is, of course, critical to getting the deal through the House of Commons.

“That said, there does seem to be a growing sense of optimism that it can get approved.”

He continues: “If this deal is ratified, we can expect the pound to jump sharply.  It is likely to hit at least $1.35 as the prospect of a no-deal, and/or months of further uncertainty ends.

“Sentiment towards UK stocks will also rally, particularly given the attractive valuations of many UK companies.

“However a strong pound may dilute the impact on exporters, as their earnings in dollars and euros, amongst others, will become less valuable in sterling terms.”

The deVere CEO concludes: “There is potential for a significant relief rally for the pound and UK financial assets if this new Brexit deal is approved.

“However, even if it is passed, this is really just the beginning – not the end.

“As such, investors need to protect themselves from market uncertainty and also best-position themselves for the inevitable opportunities through exposure to a broad range of assets, currencies and geographic regions.”

About:

deVere Group is one of the world’s largest independent advisors of specialist global financial solutions to international, local mass affluent, and high-net-worth clients.  It has a network of more than 70 offices across the world, over 80,000 clients and $12bn under advisement

RoboForex Starts Operating in the Republic of Belarus

17.10.2019

Minsk, Belarus

RoboForex, an international broker, announces the official start of its business operations in the Republic of Belarus. The company’s new office already started servicing clients in Minsk, at Myasnikova Street, 70, office 308. Also, the broker launched its website at www.roboforex.by, where clients can register and get access to the Company’s products and services after successfully completing this procedure.

At the moment, residents of the Republic of Belarus and several other countries have an opportunity to invest in 97 instruments through MetaTrader 4 platform. The official presentation of the company will take place during the conference “Systematic approach in investing” organized with support from RoboMarkets/RoboForex Group. The event will take place on October 19th in the “Pekin” hotel in Minsk. Participation in the conference is free.

Andrei Dziarnovich, CEO RoboForex BY: “We’ve brought all our services, offers, and marketing products into conformity with the regulator’s rules and requirements, and are now starting our business operations in the Republic of Belarus. Our office is already servicing its first clients and I hope this number will grow day after day. Right now, our major goal is to expand the client base due to the provision of high-quality and competitive conditions and services. The company will be officially presented on October 19th at the conference “Systematic approach in investing” in Minsk.

In April 2019 the company, which provides services under RoboForex brand in Belarus, received certificate No. 15 of the National Bank of the Republic of Belarus. The company is listed in the forex companies register in accordance with the country’s current legislation. A month later, the registered company became an official member of the The Association for the Development of Financial Market.


About RoboForex

RoboForex is a company, which delivers brokerage services on a world-wide basis. The company provides traders, who work on financial markets, with access to its proprietary trading platforms. RoboForex Ltd has the brokerage license IFSC/60/271/TS. More detailed information about the Company’s products and activities can be found on the official website at www.roboforex.com.


Forex Technical Analysis & Forecast 16.10.2019 (EURUSD, GBPUSD, USDCHF, USDJPY, AUDUSD, USDRUB, USDCAD, GOLD, BRENT, BTCUSD)

Article By RoboForex.com

EURUSD, “Euro vs US Dollar”

EURUSD has completed the first descending wave along with the correction at 1.1042; right now, it is consolidating around 1.1030. Possibly, the pair may fall towards 1.1031 and then grow to return to 1.1030. If later the price fall and breaks this range to the downside, the market may resume trading downwards to break 1.0998. After that, the instrument may continue moving inside the downtrend with the predicted target at 1.0955.

EURUSD
Risk Warning: the result of previous trading operations do not guarantee the same results in the future

GBPUSD, “Great Britain Pound vs US Dollar”

GBPUSD is moving upwards; Possibly, today the pair may extend this wave towards 1.2811 and complete it. After that, the instrument may form a new descending structure with the first target at 1.2515.

GBPUSD
Risk Warning: the result of previous trading operations do not guarantee the same results in the future

USDCHF, “US Dollar vs Swiss Franc”

USDCHF is consolidating around 0.9978. Possibly, the pair may start a new correction to the downside to reach 0.9962 and then resume trading upwards with the target at 1.0024.

USDCHF
Risk Warning: the result of previous trading operations do not guarantee the same results in the future

USDJPY, “US Dollar vs Japanese Yen”

USDJPY has reached the predicted upside target; right now, it is forming a new descending impulse towards 108.44. Later, the market may start another growth to reach 109.00 and then resume trading downwards with the first target at 108.30.

USDJPY
Risk Warning: the result of previous trading operations do not guarantee the same results in the future

AUDUSD, “Australian Dollar vs US Dollar”

AUDUSD is falling to reach 0.6723. After that, the instrument may form one more ascending structure towards 0.6760 and then start a new decline with the target at 0.6700.

AUDUSD
Risk Warning: the result of previous trading operations do not guarantee the same results in the future

USDRUB, “US Dollar vs Russian Ruble”

USDRUB continues consolidating around 64.22. If later the price breaks this range to the upside at 64.44, the instrument may start another growth to reach 64.70; if to the downside at 64.22 – continue trading inside the downtrend with the target at 63.88.

USDRUB
Risk Warning: the result of previous trading operations do not guarantee the same results in the future

USDCAD, “US Dollar vs Canadian Dollar”

USDCAD has finished the correction. Today, the pair may continue the wave towards 1.3257 and then start another correction with the target at 1.3214.

USDCAD
Risk Warning: the result of previous trading operations do not guarantee the same results in the future

XAUUSD, “Gold vs US Dollar”

Gold has completed the descending impulse at 1478.65; right now, it is correcting towards 1488.13. Possibly, the pair may fall towards 1470.90 and then resume trading upwards to return to 1478.60. Later, the market may continue trading inside the downtrend with the predicted target at 1459.33.

GOLD
Risk Warning: the result of previous trading operations do not guarantee the same results in the future

BRENT

Brent has finished the ascending impulse at 59.60; right now, it is correcting towards 58.53. After that, the instrument may start a new growth to break 59.70 and then continue trading upwards with the first target at 61.25.

BRENT
Risk Warning: the result of previous trading operations do not guarantee the same results in the future

BTCUSD, “Bitcoin vs US Dollar”

BTCUSD has completed the descending wave at 8060.00. Possibly, today the pair may form one more ascending structure to reach 8433.00 and then resume falling towards 8240.00. If later the price breaks this range to the upside, the market may continue trading inside the uptrend towards 9000.00; if to the downside – start another decline with the target at 7700.00.

BITCOIN

Article By RoboForex.com

Attention!
Forecasts presented in this section only reflect the author’s private opinion and should not be considered as guidance for trading. RoboForex LP bears no responsibility for trading results based on trading recommendations described in these analytical reviews.

Fibonacci Retracements Analysis 16.10.2019 (GBPUSD, EURJPY)

Article By RoboForex.com

GBPUSD, “Great Britain Pound vs US Dollar”

As we can see in the H4 chart, GBPUSD is rising within the mid-term correction. After the convergence, the pair has broken the high, as well as 50.0% fibo. Right now, the price is heading to reach its next upside target, 61.8% and 76.0% fibo at 1.2837 and 1.3040 respectively. The support is 38.2% fibo at 1.2500.

GBPUSD_H4
Risk Warning: the result of previous trading operations do not guarantee the same results in the future

In the H1 chart, there is a divergence on MACD, which indicates a new pullback in the nearest future. Possibly, the pair may reach 61.8% fibo at 1.2837 and then start a new descending correction. The targets are 23.6%, 38.2%, 50.0%, and 61.8% fibo at 1.2686, 1.2592, 1.2516, and 1.2441 respectively.

GBPUSD_H1
Risk Warning: the result of previous trading operations do not guarantee the same results in the future

EURJPY, “Euro vs. Japanese Yen”

As we can see in the H4 chart, EURJPY is testing its previous high. The current rising impulse helped to continue the mid-term correction; the closest upside target is 61.8% fibo at 120.50. The next targets may be inside the post-correctional extension area between 138.2% and 161.8% fibo at 121.14 and 121.82 respectively. Inside the same area, there is mid-term 76.0% fibo at 121.55. The support is at 117.07.

EURJPY_H4
Risk Warning: the result of previous trading operations do not guarantee the same results in the future

In the H1 chart, there is a divergence on MACD. We may assume that after reaching 61.8% fibo at 120.50, the instrument may resume falling towards 23.6%, 38.2%, 50.0%, and 61.8% fibo at 119.69, 119.19, 118.79, and 118.38 respectively.

EURJPY_H1

Article By RoboForex.com

Attention!
Forecasts presented in this section only reflect the author’s private opinion and should not be considered as guidance for trading. RoboForex LP bears no responsibility for trading results based on trading recommendations described in these analytical reviews.

The Analytical Overview of the Main Currency Pairs on 2019.10.16

by JustForex

The EUR/USD currency pair

Technical indicators of the currency pair:
  • Prev Open: 1.10271
  • Open: 1.10322
  • % chg. over the last day: +0.05
  • Day’s range: 1.10231 – 1.10373
  • 52 wk range: 1.0884 – 1.1623

Yesterday EUR/USD was highly active, yet without a defined trend. EUR keeps testing the levels at 1.10150-1.10400. The financial market participants are waiting or additional drivers, i.e. the progress in US/China negotiations. Further recovery is highly possible. You should open positions from the key levels.

The Economic News Feed for 16.10.2019:

  • – Inflation report (EU) – 12:00 (GMT+3:00);
  • – Retail sales report (US) – 15:30 (GMT+3:00);
  • – Federal Reserve Beige Book (US) – 21:00 (GMT+3:00);
EUR/USD

Indicators do not give accurate signals: the price crossed 50 MA and 100 MA..

The MACD histogram is in the positive zone and continues to rise, which signals a bullish mood.

The Stochastic Oscillator is in the neutral zone, the %K line is above the %D line, which also gives a signal to buy EUR/USD.

Trading recommendations
  • Support levels: 1.10150, 1.09900, 1.09650
  • Resistance levels: 1.10400, 1.10600

If the price consolidates above the resistance level of 1.10400, expect further growth of EUR/USD quotes to 1.10700-1.10900.

Alternatively, the quotes can correct toward1 1.09900-1.09700.

The GBP/USD currency pair

Technical indicators of the currency pair:
  • Prev Open: 1.26237
  • Open: 1.26016
  • % chg. over the last day: -0.06
  • Day’s range: 1.26008 – 1.26371
  • 52 wk range: 1.1959 – 1.3385

The GBP stabilized after a significant rally last week. Optimism over the settlement of the Brexit process began to weaken. EU diplomats said the bloc wants additional concessions from Prime Minister Boris Johnson. Currently, the GBP/USD currency pair is consolidating. The local support and resistance levels are: 1.25700 and 1.26450, respectively. We are expecting important economic reports from the UK. We recommend opening positions from key levels.

At 11:30 (GMT+3:00) UK will publish a labour market report.

GBP/USD

The price fixed above 50 MA and 100 MA, which signals the strength of buyers.

The MACD histogram is located in the positive zone and above the signal line, which gives a strong signal to buy GBP/USD.

The Stochastic Oscillator is in the neutral zone, the %K line is above the %D line, which also indicates bullish sentiment.

Trading recommendations
  • Support levels: 1.25700, 1.25150, 1.24250
  • Resistance levels: 1.26450, 1.27000

If the price consolidates above 1.26450, expect further growth toward 1.27000-1.27400.

Alternatively, the quotes could decrease toward 1.25200-1.24800.

The USD/CAD currency pair

Technical indicators of the currency pair:
  • Prev Open: 1.32345
  • Open: 1.31988
  • % chg. over the last day: -0.21
  • Day’s range: 1.31948 – 1.32127
  • 52 wk range: 1.2727 – 1.3664

USD/CAD currency pair continues to consolidate. There is no defined trend. CAD is currently testing local support and resistance levels at 1.31950 and 1.32200, respectively. Trading instrument can decline further. Financial market participants expect the release of important statistics. We also recommend that you pay attention to the dynamics of oil prices. You should open positions from the key levels.

Canada will publish an inflation report at 15:30 (GMT+3: 00).

USD/CAD

The price fixed below 50 MA and 100 MA, which signals the strength of sellers.

The MACD histogram is in the negative zone, but above the signal line, which gives a weak signal to sell USD/CAD.

The Stochastic Oscillator is near the overbought zone, the %K line crossed the %D line. There are no signals at the moment.

Trading recommendations
  • Support levels: 1.31950, 1.31700
  • Resistance levels: 1.32200, 1.32400, 1.32700

If the price consolidates below 1.31950, expect a further drop toward 1.31600-1.31400.

Alternative recommendations.

The USD/JPY currency pair

Technical indicators of the currency pair:
  • Prev Open: 108.397
  • Open: 108.848
  • % chg. over the last day: +0.38
  • Day’s range: 108.600 – 108.862
  • 52 wk range: 104.97 – 114.56

USD/JPY currency pair continues to show positive trends. The trading instrument reached three-month highs. At the moment, USD/JPY quotes are consolidating. The local support and resistance levels are 108.600 and 108.900, respectively. Investors took a wait and see attitude before the release of important economic reports from the United States. We also recommend paying attention to the dynamics of yield on US government bonds. Positions must be opened from key levels.

The Economic News Feed for 16.10.2019 is calm.

USD/JPY

Indicators poin to the strength of buyers: the price has fixed above 50 MA and 100 MA.

The MACD histogram is in the positive zone, but below the signal line, which gives a weak signal to buy USD/JPY.

The Stochastic Oscillator is in the neutral zone, the %K line crossed the %D line. There are no signals at the moment.

Trading recommendations
  • Support levels: 108.600, 108.200, 107.850
  • Resistance levels: 108.900, 109.400, 109.600

If the price consolidates above 108.900, expect further growth toward 109.300-109.500.

Alternatively, expect the quotes to decrease toward 108.250-108.000.

by JustForex

Gold Cycle Forecast Signals Bottom Is Near

By TheTechnicalTraders.com

It is absolutely amazing how the precious metals markets have followed our October 2018 predictions almost like clockwork.  Our call for an April 21~24 momentum base below $1300 followed by an extensive rally to levels above $1550 has been playing out almost like we scripted these future price moves.

Now that the $1550 level has been reached, we are expecting a rotation to levels that may reach just below the $1450 level before attempting to set up another momentum base/bottom formation.  And just like clockwork, Gold has followed our predictions and price is falling as we expected. Just look at our October 2018 chart where we forecasted the price of gold rallies and corrections along the way.

GOLD FORECAST & IS THE DEBT CRISIS ABOUT TO BE REBORN IN 2020?
https://www.thetechnicaltraders.com/is-the-debt-crisis-about-to-be-reborn-in-2020/

Gold Cycle Forecast – Daily Chart

Take a look at the most active cycles for gold and where our gold forecast is pointing to next. The downside rotation currently in Gold is likely not quite over yet and the gold mines will selloff the most.  This new momentum base should setup and complete once the gold cycles bottom.  The next upside price leg should push Gold well above the $1760~1780 level – so get ready for another big rally of 20%+.

Gold Miners Sell Off – Daily Chart

Unfortunately, so many traders are highly emotional and fall in love with positions in shiny metals or gold miner stock positions. Yet we all know if you trade on emotions or fall in love with a position, you are most likely to lose a ton of money. Two weeks ago I got so much flack from traders when I said gold miners were on the verge of a violent drop in price, then the bottom fell out and the dropped huge. Then last Thursday morning when gold, silver, and miners are trading up huge in pre-market and at the opening bell I warned it looked like a big fakeout and price could collapse for yet a second leg down and the same response from those emotional traders who love their positions and won’t sell them when they should as active traders.

Have You Outperformed GDXJ This Year?

If you like to trade in the precious metals sector then you most likely love to trade the gold miners ETF GDXJ. As you can see above GDXJ is only up 19.55% year to date. Sure, it’s a nice gain, but are you still holding your metals position knowing you just gave back most or all of your profits?

Being a technical analyst my focus is to only enter a position when the charts/analysis point to an immediate price advance or decline. I site in cash waiting for the next cycle top or bottom to form in an asset class like gold miners, gold, silver, or silver miners, and once the cycle starts I jump on the wave and ride it for the move until it shows signs that its weakening and will break. almost 50% of the year my portfolio is sitting in cash. And my average position only lasts around 12 days.

Take a look at all my precious metals related trades this year (2019) below. They are all winners, and total gain for subscribers of my Wealth Building Newsletter is 41.74% profit. More than double the return than if you were riding the GDXJ roller coaster for 9 months straight and all your money at risk.

My point here is that no matter how much you love metals (and I LOVE METALS), but you do not need to always be in a position in them. There are times to own, and times to watch with your money safely in cash.

Concluding Thoughts:

The end result is that the fear and greed that is starting to show up in the precious metals markets may become an “unruly beast” if it continues to grow in strength and velocity.

Keep reading our research because our proprietary tools have been nailing all of these price targets and moves many months in advance.  The next bottom in metals should set up when our cycle bottoms – then the next upside leg will begin.  This time Gold should target $1800 and Silver should target $21 to $24.  This will be an incredible move higher if it plays out as we suspect.

I urge you visit my Wealth Building Newsletter and if you like what I offer, join me with the 1-year subscription to lock in the lowest rate possible and ride my coattails as I navigate these financial market and build wealth while others lose nearly everything they own during the next financial crisis. Join Now and Get a Free 1oz Silver Bar!

I can tell you that huge moves are about to start unfolding not only in metals, or stocks but globally and some of these supercycles are going to last years. A gentleman by the name of Brad Matheny goes into great detail with his simple to understand charts and guide about this. His financial market research is one of a kind and a real eye-opener. PDF guide: 2020 Cycles – The Greatest Opportunity Of Your Lifetime

As a technical analysis and trader since 1997, I have been through a few bull/bear market cycles. I believe I have a good pulse on the market and timing key turning points for both short-term swing trading and long-term investment capital. The opportunities are massive/life-changing if handled properly.

Chris Vermeulen

TheTechnicalTraders.com

The Dollar Index Has Updated Local Lows. Demand for the British Pound Has Resumed Again

by JustForex

The US dollar weakened against a basket of major currencies. The dollar index (#DX) closed yesterday’s trading session in the negative zone (-0.17%). Relations between the US and China have escalated again due to the situation in Hong Kong. US lawmakers supported the protest movement in Hong Kong, which Beijing did not like.

Investors are focused on the situation concerning Brexit. So, yesterday it became known that the UK and the European Union were close to concluding a draft agreement on Brexit. It is reported that the agreement will directly depend on whether British Prime Minister Boris Johnson receives support from the Democratic Unionist Party of Northern Ireland. Investors are also waiting for the summit of the UK and the EU, which will be held on Thursday-Friday. After the summit, the scenario of Brexit is likely to become a little clearer.

Mixed UK labor market data were also published yesterday. The average earnings + bonus increased by 3.8% in August, while experts expected growth by 4.0%. Initial jobless claims increased only by 21.1K in September instead of 26.5K. The unemployment rate rose to 3.9% in August instead of the forecasted value of 3.8%.

The “black gold” prices are consolidating. At the moment, futures for the WTI crude oil are testing the $52.70 mark per barrel.

Market Indicators

Yesterday, there was the bullish sentiment in the US stock markets: #SPY (+0.99%), #DIA (+0.88%), #QQQ (+1.27%).

The 10-year US government bonds yield has risen again. Currently, the indicator is at the level of 1.73-1.74%.

The Economic News Feed for 16.10.2019:
  • – Consumer price index in the UK at 11:30 (GMT+3:00);
  • – Consumer price index in the Eurozone at 12:00 (GMT+3:00);
  • – Report on retail sales in the US at 15:30 (GMT+3:00);
  • – Statistics on inflation in Canada at 15:30 (GMT+3:00);
  • – Fed’s “Beige Book” at 21:00 (GMT+3:00).

by JustForex

Gold bulls skeptical of the US-Chinese trade deal – soon to be back above 1,500?

By Admiral Markets

Source: Economic Events October 16, 2019 – Admiral Markets’ Forex Calendar

Today, our focus will again be on Gold. After the recent developments in the trade dispute between the US and China last Friday and at least partial trade deal between the two biggest economies in the world, the precious metal just closed slightly below 1,500 USD.

The primary potential reason is probably that Gold traders already smelled something fishy in the “deal” which was announced by Trump on Friday, and when on Monday news hit the wire that China wants more talks before signing Trump’s phase 1 deal, it became clear that it’s only a deal on the surface and tensions between the US and China will likely remain in the near future.

If today’s US retail sales data don’t show the same solid developments as recent publications indicated, again fueling recession fears, our overall bullish outlook could find a new driver upwards, back above 1,500 USD and eyeing the current yearly highs around 1,555 USD in the days to come again.

And even if Gold does not take on bullish momentum again (probably because US retail sales data significantly beat expectations of 0.3% (MoM)), a stint below the current October lows around 1,460 USD wouldn’t darken the picture, but instead, bring a potential mid-term long trigger around 1,440/450 USD into play:

Source: Admiral Markets MT5 with MT5-SE Add-on Gold Daily chart (between July 17, 2018, to October 15, 2019). Accessed: October 15, 2019, at 10:00pm GMT – Please note: Past performance is not a reliable indicator of future results, or future performance.

In 2014, the value of Gold fell by 1.7%, in 2015, it fell by 10.4%, in 2016, it increased by 8.1%, in 2017, it increased by 13.1%, in 2018, it fell by 1.6%, meaning that after five years, it was up by 6.4%.

Discover the world’s #1 multi-asset platform

Admiral Markets offers professional traders the ability to trade with a custom, upgraded version of MetaTrader 5, allowing you to experience trading at a significantly higher, more rewarding level. Experience benefits such as the addition of the Market Heat Map, so you can compare various currency pairs to see which ones might be lucrative investments, access real-time trading data, and so much more. Click the banner below to start your FREE download of MT5 Supreme Edition!

Download MetaTrader 5 and begin trading today!

Disclaimer: The given data provides additional information regarding all analysis, estimates, prognosis, forecasts or other similar assessments or information (hereinafter “Analysis”) published on the website of Admiral Markets. Before making any investment decisions please pay close attention to the following:

  1. This is a marketing communication. The analysis is published for informative purposes only and are in no way to be construed as investment advice or recommendation. It has not been prepared in accordance with legal requirements designed to promote the independence of investment research, and that it is not subject to any prohibition on dealing ahead of the dissemination of investment research.
  2. Any investment decision is made by each client alone whereas Admiral Markets shall not be responsible for any loss or damage arising from any such decision, whether or not based on the Analysis.
  3. Each of the Analysis is prepared by an independent analyst (Jens Klatt, Professional Trader and Analyst, hereinafter “Author”) based on the Author’s personal estimations.
  4. To ensure that the interests of the clients would be protected and objectivity of the Analysis would not be damaged Admiral Markets has established relevant internal procedures for prevention and management of conflicts of interest.
  5. Whilst every reasonable effort is taken to ensure that all sources of the Analysis are reliable and that all information is presented, as much as possible, in an understandable, timely, precise and complete manner, Admiral Markets does not guarantee the accuracy or completeness of any information contained within the Analysis. The presented figures refer that refer to any past performance is not a reliable indicator of future results.
  6. The contents of the Analysis should not be construed as an express or implied promise, guarantee or implication by Admiral Markets that the client shall profit from the strategies therein or that losses in connection therewith may or shall be limited.
  7. Any kind of previous or modeled performance of financial instruments indicated within the Publication should not be construed as an express or implied promise, guarantee or implication by Admiral Markets for any future performance. The value of the financial instrument may both increase and decrease and the preservation of the asset value is not guaranteed.
  8. The projections included in the Analysis may be subject to additional fees, taxes or other charges, depending on the subject of the Publication. The price list applicable to the services provided by Admiral Markets is publicly available from the website of Admiral Markets.
  9. Leveraged products (including contracts for difference) are speculative in nature and may result in losses or profit. Before you start trading, you should make sure that you understand all the risks.

By Admiral Markets