by JustForex
The EUR/USD currency pair
- Prev Open: 1.11036
- Open: 1.10804
- % chg. over the last day: -0.22
- Day’s range: 1.10762 – 1.10914
- 52 wk range: 1.0884 – 1.1623
Last week, the USD recovered a part of its losses against world currencies. EUR/USD quotes updated local lows. Beijing and Washington said they were nearing completion of the first phase of the trade agreement. Participants in the financial markets are waiting for the Fed meeting, which is scheduled for October 30. Currently, EUR/USD is consolidating in the range of 1.10700-1.11000. The trading instrument has the potential to further decline. Consider opening positions from the key levels.
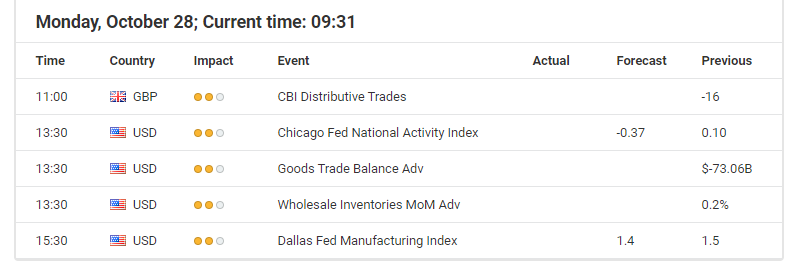
The Economic News Feed for 28.10.2019 is calm.

The price fixed below 50 MA and 100 MA, which signals the strength of sellers.
The MACD histogram is in the negative zone, but above the signal line, which gives a weak signal to sell EUR/USD.
The Stochastic Oscillator is in the overbought zone, the %K line began to cross the %D line. There are no signals at the moment.
- Support levels: 1.10700, 1.10450, 1.10200
- Resistance levels: 1.11000, 1.11250, 1.11500
If the price consolidates below 1.10700, expect a further descend toward 1.10450-1.10300
Alternatively, the quotes could grow toward 1.11250-1.11500.
The GBP/USD currency pair
- Prev Open: 1.29140
- Open: 1.28513
- % chg. over the last day: -0.62
- Day’s range: 1.28342 – 1.28581
- 52 wk range: 1.1959 – 1.3385
Yesterday, sales prevailed on the GBP/USD currency pair. The quotes descended by more than 70 points. The GBP remains under pressure due to the uncertainty surrounding Brexit. Keep track of current information on this issue. The trading instrument is currently consolidating. The local support and resistance levels are 1.28000 and 1.28800, respectively. GBP can decline further. Open positions from key levels.
The Economic News Feed for 28.10.2019 is calm.

Indicators do not give accurate signals: 50 MA crossed 100 MA.
The MACD histogram is in the negative zone, but above the signal line, which gives a weak signal to sell GBP/USD.
The Stochastic Oscillator is in the neutral zone, the %K line is above the %D line, which indicates bullish sentiment.
- Support levels: 1.28000, 1.27600, 1.26800
- Resistance levels: 1.28800, 1.29450, 1.30100
If the price consolidates below 1.28000, expect the quotes to drop toward 1.27500-1.27000.
Alternatively, the quotes could grow toward 1.29400-1.29800.
The USD/CAD currency pair
- Prev Open: 1.30717
- Open: 1.30696
- % chg. over the last day: -0.07
- Day’s range: 1.30651 – 1.30767
- 52 wk range: 1.2727 – 1.3664
The USD/CAD currency pair has stabilized. CAD is currently consolidating. There is no defined trend. The local support and resistance levels are 1.30550 and 1.30800, respectively. In the near future, technical correction of USD/CAD quotes after a prolonged fall is not ruled out. We recommend paying attention to the dynamics of prices for oil. Open positions from the key levels.
The Economic News Feed for 28.10.2019 is calm.

The price fixed below 50 MA and 100 MA, which signals the strength of sellers.
The MACD histogram is in the negative zone, indicating a bearish sentiment.
The Stochastic Oscillator is in the neutral zone, the %K line is below the %D line, which also gives a signal to sell USD/CAD.
- Support levels: 1.30550, 1.30200, 1.30000
- Resistance levels: 1.30800, 1.31000, 1.31200
If the price consolidates below 1.30550, expect a further descend toward 1.30200-1.30000.
Alternatively, the quotes could grow toward 1.31000-1.31200.
The USD/JPY currency pair
- Prev Open: 108.671
- Open: 108.598
- % chg. over the last day: -0.07
- Day’s range: 108.571 – 108.706
- 52 wk range: 104.97 – 114.56
The technical pattern on the USD/JPY currency pair remains ambiguous. The trading instrument is in a lateral movement. USD/JPY quotes test local support and resistance levels at 108.500 and 108.700, respectively. Participants in financial markets expect additional drivers. Pay attention to the yield dynamics on US government bonds. Open positions from key levels.
The Economic News Feed for 28.10.2019 is calm.

The price fixed above 50 MA and 100 MA, which signals the strength of buyers.
The MACD histogram has started to rise, indicating bullish sentiment.
The Stochastic Oscillator is in the neutral zone, the %K line crossed the %D line. There are no signals at the moment.
- Support levels: 108.500, 108.250, 108.000
- Resistance levels: 108.700, 108.900
If the price consolidates below 108.500, expect the quotes to fall toward 108.300-108.100.
Alternatively, the quotes could grow toward 108.900-109.200.
by JustForex