Article By RoboForex.com
BTCUSD, “Bitcoin vs US Dollar”
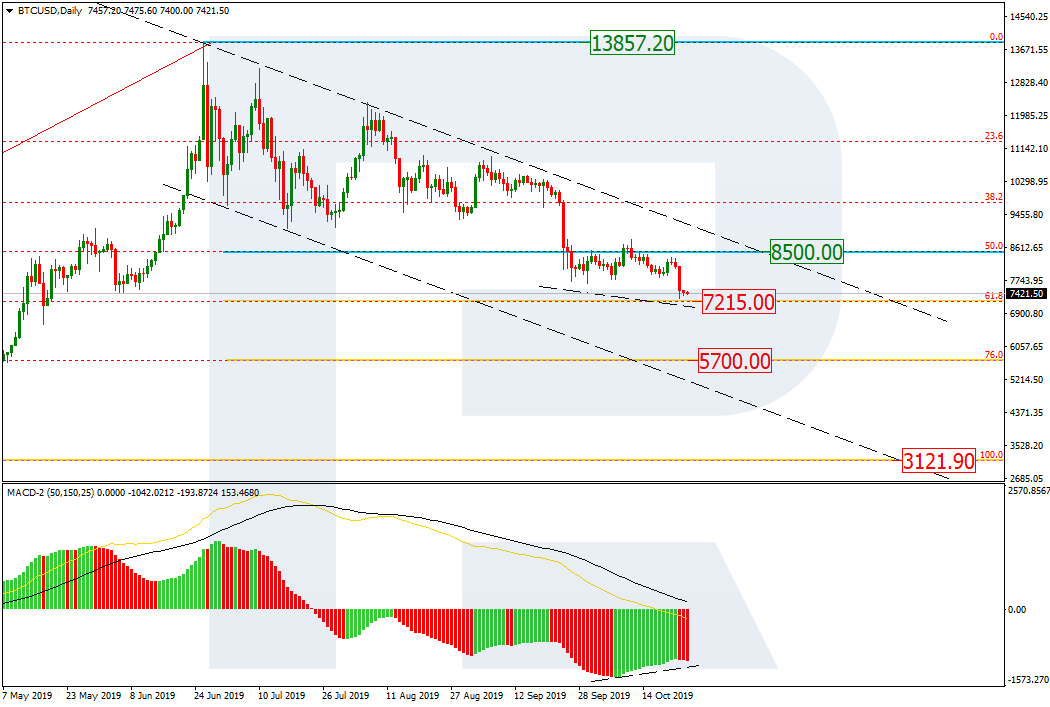
As we can see in the daily chart, the descending tendency continues. After completing the short-term correction, BTCUSD started a new descending impulse, which has almost reached 61.8% fibo at 7215.00. Later, the price may continue trading towards 76.0% fibo at 5700.00. However, the key mid-term target is the long-term low at 3121.90. The previous impulse has moved the resistance, which is currently at 50.0% fibo at 8500.00.

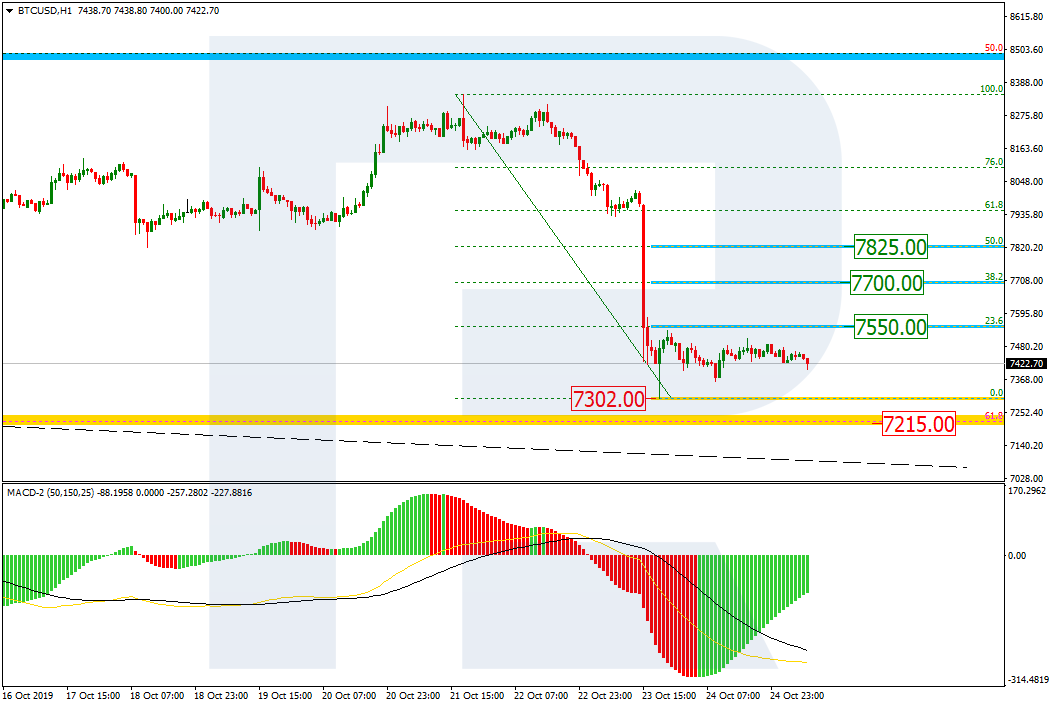
In the H1 chart, the pair is correcting sideways; right now, it is moving between the local low at 7302.00 and 23.6% fibo at 7550.00. In the future, the instrument may yet continue the correction towards 38.2% and 50.0% fibo at 7700.00 and 7825.00 respectively, but it’s highly unlikely.
ETHUSD, “Ethereum vs. US Dollar”
As we can see in the H4 chart, after finishing the correction, ETHUSD started a new decline, which has almost reached the low at 152.28. If the price breaks the low, the pair may continue trading towards 76.0% fibo at 148.60 and then the post-correctional extension area between 138.2% and 161.8% fibo at 135.30 and 124.40 respectively.
Free Reports:
 Get Our Free Metatrader 4 Indicators - Put Our Free MetaTrader 4 Custom Indicators on your charts when you join our Weekly Newsletter
 Get our Weekly Commitment of Traders Reports - See where the biggest traders (Hedge Funds and Commercial Hedgers) are positioned in the futures markets on a weekly basis.

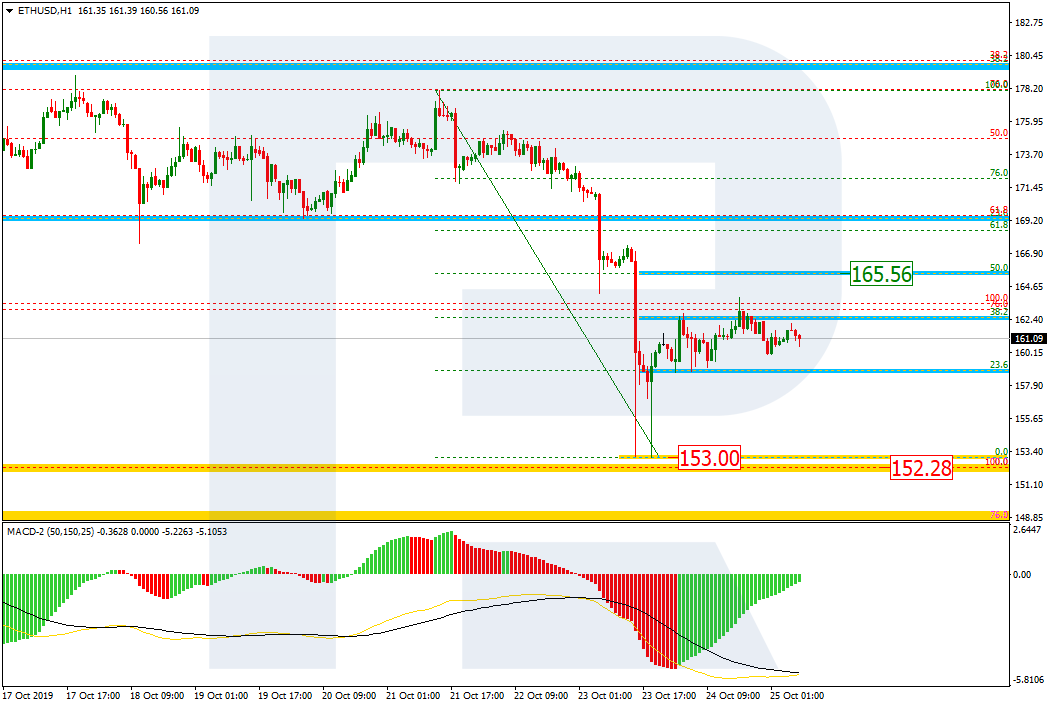
In the H1 chart, the instrument is correcting upwards and has already reached 38.2% fibo. The next upside target is 50.0% fibo at 165.56. the support is the local low at 153.00.
Article By RoboForex.com
Attention!
Forecasts presented in this section only reflect the author’s private opinion and should not be considered as guidance for trading. RoboForex LP bears no responsibility for trading results based on trading recommendations described in these analytical reviews.