Author Archive for InvestMacro – Page 147

Forex Technical Analysis & Forecast 30.10.2019 (EURUSD, GBPUSD, USDCHF, USDJPY, AUDUSD, USDRUB, USDCAD, GOLD, BRENT, BTCUSD)

Article By RoboForex.com

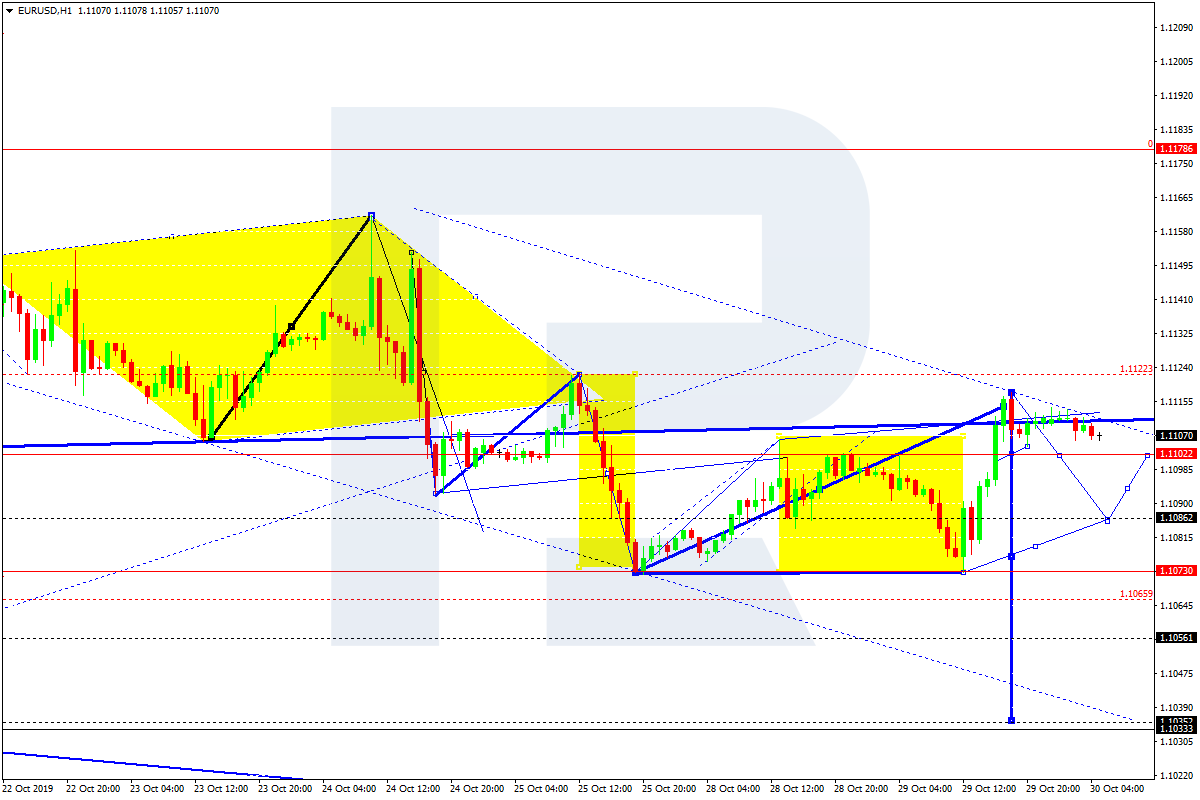
EURUSD, “Euro vs US Dollar”

EURUSD has expanded the consolidation range towards 1.1117; in fact, the entire range may be considered as a correction. Possibly, the pair may choose an alternative scenario to continue the correction towards 1.1122. According to the main scenario, the price is expected to form a new descending structure to reach 1.1086, which may later be followed by a new grow towards 1.1102 and then further decline with the target at 1.1033.

EURUSD
Risk Warning: the result of previous trading operations do not guarantee the same results in the future

GBPUSD, “Great Britain Pound vs US Dollar”

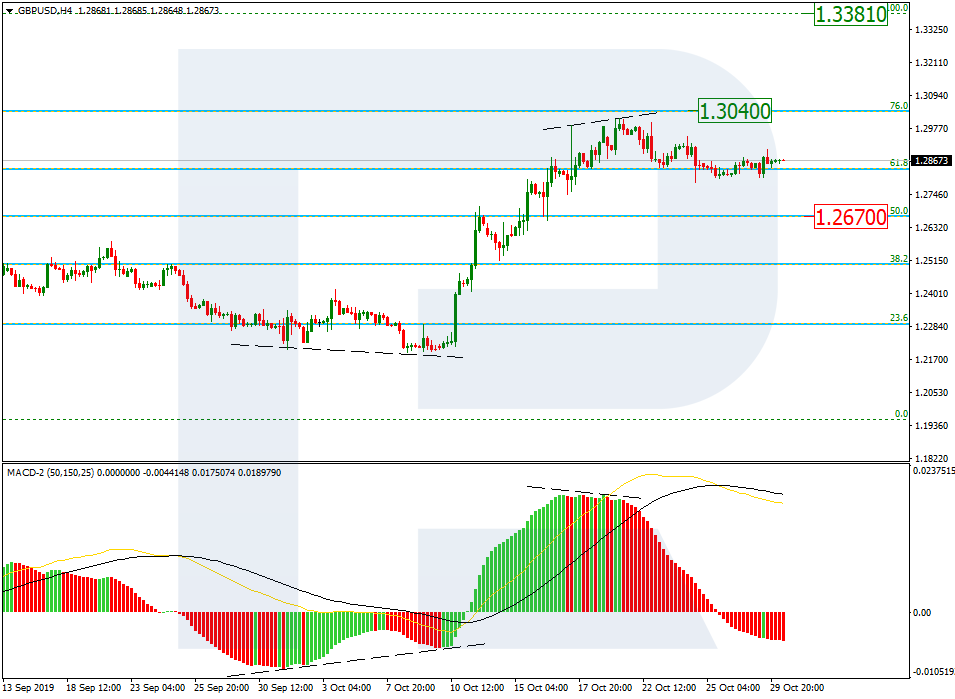
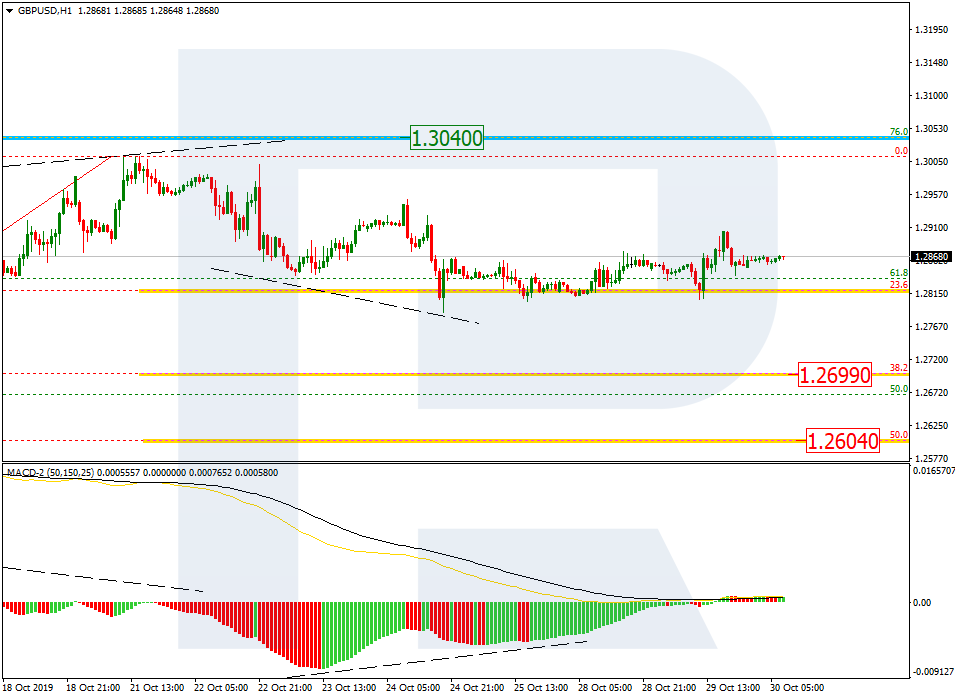
After finishing the correction at 1.2900, GBPUSD has finished the descending impulse; right now, it is consolidating. Possibly, the pair may break 1.2838 and then continue trading downwards with the target at 1.2800. Later, the market may break this level as well and continue its decline towards 1.2704.

GBPUSD
Risk Warning: the result of previous trading operations do not guarantee the same results in the future

USDCHF, “US Dollar vs Swiss Franc”

USDCHF has completed the correction at 0.9933; right now, it is moving upwards with the target at 0.9955. After that, the instrument may start a new decline towards 0.9944 and then form one more ascending structure to reach the key target at 0.9977.

USDCHF
Risk Warning: the result of previous trading operations do not guarantee the same results in the future

USDJPY, “US Dollar vs Japanese Yen”

USDJPY has finished the descending impulse at 108.77; right now, it is consolidating. If later the price breaks this range to the downside, the market may continue the correction with the target at 108.51; if to the downside – start another growth to reach 109.33.

USDJPY
Risk Warning: the result of previous trading operations do not guarantee the same results in the future

AUDUSD, “Australian Dollar vs US Dollar”

AUDUSD is consolidating around 0.6860. Possibly, today the pair may expand the range towards 0.6844. Later, the market may resume moving upwards to reach 0.6877 and then continue trading inside the downtrend with the target at 0.6800.

AUDUSD
Risk Warning: the result of previous trading operations do not guarantee the same results in the future

USDRUB, “US Dollar vs Russian Ruble”

USDRUB has completed the correction at 64.00. Today, the pair may fall to break 63.63 and then continue trading inside the downtrend with the target at 63.33.

USDRUB
Risk Warning: the result of previous trading operations do not guarantee the same results in the future

USDCAD, “US Dollar vs Canadian Dollar”

USDCAD has finished the ascending impulse at 1.3080; right now, it is consolidating around it. Possibly, the pair may continue the correction to reach 1.3131 and then start another decline with the target at 1.3030.

USDCAD
Risk Warning: the result of previous trading operations do not guarantee the same results in the future

XAUUSD, “Gold vs US Dollar”

Gold has broken the consolidation range downwards. Possibly, today the pair may fall with the short-term target at 1478.28 and then start a new growth towards 1492.80. After that, the instrument may continue trading inside the downtrend with the first target at 1468.36.

GOLD
Risk Warning: the result of previous trading operations do not guarantee the same results in the future

BRENT

Brent has finished the ascending impulse at 61.94; right now, it is correcting towards 61.27. Later, the market may form one more ascending structure to reach 62.22 and then resume trading downwards with the target at 61.75. After that, the instrument may start another growth with the short-term target at 62.89.

BRENT
Risk Warning: the result of previous trading operations do not guarantee the same results in the future

BTCUSD, “Bitcoin vs US Dollar”

BTCUSD is consolidating above 9060.00. Possibly, the pair may break 9500.00 to the upside and then continue trading inside the uptrend towards 9900.00. The key target of this ascending structure is at 10800.00.

BITCOIN

Article By RoboForex.com

Attention!
Forecasts presented in this section only reflect the author’s private opinion and should not be considered as guidance for trading. RoboForex LP bears no responsibility for trading results based on trading recommendations described in these analytical reviews.

Fibonacci Retracements Analysis 30.10.2019 (GBPUSD, EURJPY)

Article By RoboForex.com

GBPUSD, “Great Britain Pound vs US Dollar”

As we can see in the H4 chart, there was a divergence on MACD, which made GBPUSD complete the rising wave at 76.0% fibo at 1.3040 and start a new pullback. The support is at 1.2670. after completing the correction, the instrument may start another rising impulse to reach the previous high at 1.30450 and then the key one at 1.3381.

GBPUSD_H4
Risk Warning: the result of previous trading operations do not guarantee the same results in the future

The H1 chart shows more detailed structure of the current descending correction after the divergence. The pair has already reached 23.6% fibo, but may yet continue falling towards 38.2% and 50.0% fibo at 1.2699 and 1.2604. at the same time, there is a short-term convergence, which is slowing down the current decline.

GBPUSD_H1
Risk Warning: the result of previous trading operations do not guarantee the same results in the future

EURJPY, “Euro vs. Japanese Yen”

As we can see in the H4 chart, there was a divergence on MACD, which made EURJPY finish the ascending wave at 76.0% fibo at 121.55 and start a new sideways movement. If the price breaks the resistance at 121.27 the pair may resume growing. The key target is the high at 123.36.

EURJPY
Risk Warning: the result of previous trading operations do not guarantee the same results in the future

In the H1 chart, the pair has reached 23.6% fibo. In the future, the instrument may continue falling towards 38.2% and 50.0% fibo at 119.79 and 119.27 respectively.

EURJPY_H1

Article By RoboForex.com

Attention!
Forecasts presented in this section only reflect the author’s private opinion and should not be considered as guidance for trading. RoboForex LP bears no responsibility for trading results based on trading recommendations described in these analytical reviews.

Will a dovish FED lead to a bullish yearly close for Gold?

By Admiral Markets

Source: Economic Events 30 October 2019 – Admiral Markets’ Forex Calendar

Today, all eyes are on the FED rate decision.

While a rate cut of 25 basis points is nearly completely priced in (currently the FED Watch Tool shows a likelihood of way over 90%), what’s certainly of higher interest is the rhetoric in regards to the rate decision in December and the announced “Non-QE”-QE program.

In regards to the latter, the current plan is to buy US Treasuries for the next 8.5 months at a pace of 60 billion USD per month, and any hints at Wednesday’s meeting that the FED could consider extending that program if there are no liquidity improvements could result in Gold taking on bullish momentum. This could lead Gold to recapture 1,500 USD, with US yields expected to push lower again.

If in addition to such a dovish rhetoric, speculations around another 25 basis point rate cut for the December meeting are taking on momentum again (currently the FED Watch Tool sees a surprisingly low likelihood of below 20% for such a rate cut), and the upcoming US economic releases, especially the ISM Manufacturing on Friday, could trigger further bullish momentum in Gold into the weekly close.

If the ISM data continues to trend lower and result in rising recession fears (for September the ISM Manufacturing dropped to 47.8, the steepest contraction in the manufacturing sector since June 2009), the yellow metal has a good and solid chance to go for an attack at the region around 1,520 USD.

In general and from a technical perspective, the advantage in Gold stays on the Long side above 1,380 USD and our mid-term target around 1,650/700 USD is still active.

And again: even a stint below the current October lows around 1,460 USD wouldn’t darken the picture, but instead bring a potential mid-term long trigger around 1,440/450 USD into play:

Source: Admiral Markets MT5 with MT5SE Add-on Gold Daily chart (between 31 July 2018 to 29 October 2019). Accessed: 29 October 2019 at 10:00 PM GMT

Please note: Past performance is not a reliable indicator of future results, or future performance.

In 2014, the value of Gold fell by 1.7%, in 2015, it fell by 10.4%, in 2016 it increased by 8.1%, in 2017 it increased by 13.1%, in 2018, it fell by 1.6%, meaning that after five years, it was up by 6.4%.

Trade With MetaTrader 5

Disclaimer: The given data provides additional information regarding all analysis, estimates, prognosis, forecasts or other similar assessments or information (hereinafter “Analysis”) published on the website of Admiral Markets. Before making any investment decisions please pay close attention to the following:

  1. This is a marketing communication. The analysis is published for informative purposes only and are in no way to be construed as investment advice or recommendation. It has not been prepared in accordance with legal requirements designed to promote the independence of investment research, and that it is not subject to any prohibition on dealing ahead of the dissemination of investment research.
  2. Any investment decision is made by each client alone whereas Admiral Markets shall not be responsible for any loss or damage arising from any such decision, whether or not based on the Analysis.
  3. Each of the Analysis is prepared by an independent analyst (Jens Klatt, Professional Trader and Analyst, hereinafter “Author”) based on the Author’s personal estimations.
  4. To ensure that the interests of the clients would be protected and objectivity of the Analysis would not be damaged Admiral Markets has established relevant internal procedures for prevention and management of conflicts of interest.
  5. Whilst every reasonable effort is taken to ensure that all sources of the Analysis are reliable and that all information is presented, as much as possible, in an understandable, timely, precise and complete manner, Admiral Markets does not guarantee the accuracy or completeness of any information contained within the Analysis. The presented figures refer that refer to any past performance is not a reliable indicator of future results.
  6. The contents of the Analysis should not be construed as an express or implied promise, guarantee or implication by Admiral Markets that the client shall profit from the strategies therein or that losses in connection therewith may or shall be limited.
  7. Any kind of previous or modeled performance of financial instruments indicated within the Publication should not be construed as an express or implied promise, guarantee or implication by Admiral Markets for any future performance. The value of the financial instrument may both increase and decrease and the preservation of the asset value is not guaranteed.
  8. The projections included in the Analysis may be subject to additional fees, taxes or other charges, depending on the subject of the Publication. The price list applicable to the services provided by Admiral Markets is publicly available from the website of Admiral Markets.
  9. Leveraged products (including contracts for difference) are speculative in nature and may result in losses or profit. Before you start trading, you should make sure that you understand all the risks.

By Admiral Markets

Long-Term Predictive Software Suggests Volatility May Surge

By TheTechnicalTraders.com

Over the past few weeks and months, a number of key economic data has continued to rally the US major indexes towards new highs, hopes of a US/China trade deal, a continued shift of capital in the US markets for protection and safety, and moderately strong US economic indicators and an earning season that appears to be moderately strong for Q3 of 2019.  The interesting facet of this move higher is that it is happening while trading volume has diminished dramatically in the SPY.  The futures contracts, the ES, YM, and NQ, continue to show relatively strong volume activity though.

Additionally, the overnight Repo markets have risen to the attention of many skilled analysts.  The concern is that the continued US Fed support of the overnight Repo facility may be a band-aid attempt to support a gaping credit crisis that is brewing just outside of view.  We’ve been doing quite a bit of research over the past few weeks regarding this Repo market support by the US Fed and we believe there is more to it than many believe.  We believe certain institutional banking firms may be at extreme risks related to derivative investments, shadow banking activities and/or global commodity/stock/currency/asset risk exposure.  The only answer we have for the extended Repo facility at increasing levels is that the institutional banking system is starting to “fray around the edges”.  Thus, we believe some larger credit risk problems may be just around the corner.

Our longer-term analysis continues to suggest that “all is fine – until it is not”.  Our belief that a capital shift that has been taking place over the past 5+ years where foreign capital continues to pour into the US markets is driving US stock market prices higher.  There is evidence that the capital shift into the US has slowed over the past 5+ months, yet one would not notice this by looking at these longer-term charts.  The point we are trying to make today is that price peaks near current highs have, historically, been met with strong resistance and collapsed by 8 to 15% on average.

SP500 Index – 2 Month Long Term Chart

This ES 2 Month chart highlights the resistance channel initiated near the 2003 lows (the lower YELLOW price channel line) and how that level has continued to act as moderate price resistance throughout most of 2017, 2018 and 2019.  We believe that price, at current levels, must either rally above this level and be capable of sustaining higher price levels (which would be supported by stronger forward guidance, earnings, economic data and/or investments), or will attempt to rotate lower from these current highs because price is simply unable to support/sustain higher price levels given the current global economic data.

When we attempt to rationalize the potential for price given the Repo issues, the current global economic data/news, the uncertainty of a US Presidential election cycle only 12 months away, the BREXIT deal hanging out in the near future and recent currency rotations, we believe is transitional shift is taking place in the markets in preparation for some type of surge in volatility associated with a very strong potential for extended price rotation.

NASDAQ 2 Week Chart – Adaptive Dynamic Learning (ADL)

Our Adaptive Dynamic Learning (ADL) price modeling system on this NQ 2-Week chart highlights what the ADL system suggests as a moderate price rotation setting up over the next 2 to 8+ weeks.  This data originates on August 5, 2019, and the alignment of the future predicted price levels (the DASHES) on this chart shows how accurate the ADL future price predictions have been over the past 3+ months.  Currently, the ADL predictive modeling system is suggesting a price reversion is about to take place in the NQ where price may fall 10 to 15% over the next 2 to 6+ weeks.  Then, the price will attempt to set up a momentum base and begin to move higher near the end of 2019 or early into 2020.

DOW 2 Week Chart – Adaptive Dynamic Learning (ADL)

This YM 2-Week chart showing the same type of ADL predicted price levels suggests the YM may also see some type of price reversion, yet the size of this reversion is much smaller than the NQ.  The ADL predictive modeling system is suggesting the YM may rotate to levels near 26,000 or lower before finding immediate support and attempting a renewed rally back to levels near 27,000.

Concluding Thoughts:

What this suggests is that the NASDAQ and S&P500 may become much more volatile than the Dow Jones index over the next 2 to 6+ weeks.  Volatility may surge on a reversion move in the ES and NQ over the next few months while the YM remains rather calm comparatively.  Skilled traders must understand that subtle risks are starting to show throughout the global markets.  Foreign markets are starting to show signs of extended contraction – China and Asia in particular.  The situation in Europe and with the Euro are open to interpretation.  Our opinion is that risk levels have already exceeded a comfort level in this arena.

Should some event take place where the global banking system and/or Repo market continue to attempt to take up the slack – traders will become even more concerned that “something is broken” and could pull massive amounts of capital out of the markets fairly quickly.  If this happens when volume and volatility are very low, we have a situation where simple price exploration could present a real problem (think FLASH CRASH).

Skilled traders need to stay very cautious near these new highs.  We may see a surge in volatility over the next few weeks unless the markets are able to settle the concerns raised by analysts and others.  Headed into the end of 2019, into a contentious US presidential election cycle and with obvious signs that something may be breaking in the global banking system, now is the time to protect and prepare for the unknown.  We can’t make this any clearer – consider this a warning alert from TheTechnicalTraders.com.


EURUSD: Markets await US GDP and the results of the FOMC meeting

By Alpari.com

On Tuesday the 29th of October, trading on the euro closed up. Bearish sentiment switched to bullish at 1.1074. There are several factors that may have sparked this growth:

  • All governments of EU member states ratified the Brexit extension.
  • Leader of the opposition Labour Party in the UK, Jeremy Corbyn, has said the party will back a general election in December given that the UK can no longer exit the EU without a deal.
  • The S&P 500 index reached a new all-time high. Investors expect progress to be made in the US-China trade talks, which had a positive effect on riskier assets.

Day’s news (GMT+3):

  • 12:00 Switzerland: ZEW survey – expectations (Oct).
  • 13:00 Eurozone: business climate (Oct).
  • 15:15 US: ADP employment change (Oct).
  • 15:30 US: GDP (Q3).
  • 16:00 Germany: harmonised index of consumer prices (Oct).
  • 17:00 Canada: BoC interest rate decision and statement, BoC monetary policy report.
  • 18:15 Canada: BoC press conference.
  • 21:00 US: Fed interest rate decision, Fed’s monetary policy statement.
  • 21:30 US: FOMC press conference.

EURUSD H1Current situation:

Yesterday didn’t end as expected. The market fell victim to the fundamentals. After the breakout of the trend line by the upwards correction from 1.1073 (25/10/19), the euro dropped to 1.1074. The recovery to the trend line killed any hopes of a decline to 1.1067. In the end, the pair rose to 1.1118.

Key facts:

  • The bulls have broken the upper line of the channel.
  • The rise above 1.1107 (the high between the two lows of 1.1073 and 1.1074) has confirmed a double base model.

There’s plenty going on in today’s economic events calendar. The biggest highlights of the day are the meetings of the Bank of Canada and FOMC, as well as US GDP figures for Q3 and Jerome Powell’s speech. The BoC is expected to keep rates at their current level, while we expect the Fed to reduce interest rates by 25 base points. Since a rate reduction has already been factored in by the market, if it does happen, attention will immediately turn towards the FOMC press conference. GDP is expected to decline from 2% to 1.6%. These figures will be released at 15:30 (EET), so expect some increased volatility ahead of the FOMC meeting.

When there are important events in the calendar to which the reactions can’t be reasonably predicted, we prefer not to predict any price movements. Judging by yesterday’s movements, the bulls can now set their sights on 1.1163.

By Alpari.com

The Analytical Overview of the Main Currency Pairs on 2019.10.30

by JustForex

The EUR/USD currency pair

Technical indicators of the currency pair:
  • Prev Open: 1.11003
  • Open: 1.11003
  • % chg. over the last day: +0.11
  • Day’s range: 1.11065 – 1.11153
  • 52 wk range: 1.0884 – 1.1623

Greenback is stable against other world currencies. Investors took a wait and see attitude before today’s Fed meeting. Most participants in financial markets expect the regulator to reduce the range of key interest rates by 25 basis points to 1.50-1.75%. We recommend that you pay attention to the comments and rhetoric of representatives of the Central Bank, which may signal the further pace of monetary policy adjustment. A number of important economic releases will also be published today. At the moment, EUR/USD quotes are consolidating in the range of 1.11000-1.11200. Open positions from the key levels.

The Economic News Feed for 30.10.2019:

  • – Labour Market Report (GER) – 10:55 (GMT+2:00);
  • – ADP Nonfarm Employment Change (US) – 14:15 (GMT+2:00);
  • – Preliminary GDP Report (US) – 14:30 (GMT+2:00);
  • – Fed Interest Rate Announcement (US) – 20:00 (GMT+2:00);
EUR/USD

Indicators do not give accurate signals: 50 MA began to cross 100 MA.

The MACD histogram has moved into the positive zone, indicating a bullish sentiment.

The Stochastic Oscillator is in the neutral zone, the %K line is above the %D line, which gives a signal to buy EUR/USD.

Trading recommendations
  • Support levels: 1.11000, 1.10750, 1.10450
  • Resistance levels: 1.11200, 1.11500, 1.11750

If the price consolidates above 1.11200, expect a rise toward 1.11500-1.11700.

Alternatively, the quotes could decrease toward 1.10700-1.10500.

The GBP/USD currency pair

Technical indicators of the currency pair:
  • Prev Open: 1.28601
  • Open: 1.28656
  • % chg. over the last day: +0.03
  • Day’s range: 1.28582 – 1.28828
  • 52 wk range: 1.1959 – 1.3385

The technical pattern on the GBP/USD currency pair is still ambiguous. GBP continues to trade in a flat. At the moment, the local support and resistance levels are 1.28450 and 1.29000, respectively. Participants in the financial markets are waiting for the Fed meeting. We also recommend keeping track of up-to-date information regarding the Brexit process. GBP/USD quotes have the potential for correction. Open positions from key levels.

The Economic News Feed for 30.10.2019 is calm.

GBP/USD

Indicators do not give accurate signals, 50 MA has crossed 100 MA.

The MACD histogram is in the positive zone, which points to a bullish sentiment.

The Stochastic Oscillator is in the positive zone, the %K line is above the %D line which also points to a bullish sentiment.

Trading recommendations
  • Support levels: 1.28450, 1.28000, 1.27600
  • Resistance levels: 1.29000, 1.29450, 1.30000

If the price consolidates below the support level of 1.28450, expect the quotes to fall toward 1.28000-1.27800.

Alternatively, the quotes can grow toward 1.29400-1.29600.

The USD/CAD currency pair

Technical indicators of the currency pair:
  • Prev Open: 1.30549
  • Open: 1.30871
  • % chg. over the last day: +0.31
  • Day’s range: 1.30804 – 1.30955
  • 52 wk range: 1.2727 – 1.3664

The USD/CAD has moved up. The trading tool has updated local highs. CAD is currently consolidating in the range of 1.30750-1.31000. Investors took a wait and see attitude before the meetings of the Bank of Canada and the Fed. It is expected that the Central Bank of Canada will maintain the basic parameters of monetary policy at the same level. We recommend you to pay attention to the comments and rhetoric of representatives of regulators. Open positions from key levels.

The Bank of Canada will announce their interest rate at 16:00 (GMT+2:00).

USD/CAD

The signals of the indicators are indecisive. The price has fixed above 100 MA, which signals the power of buyers.

The MACD histogram is in the positive zone, but below the signal line, which gives a weak signal to buy USD/CAD.

The Stochastic Oscillator is in the neutral zone, the %K line is below the %D line, which indicates a bearish sentiment.

Trading recommendations
  • Support levels: 1.30750, 1.30500, 1.30200
  • Resistance levels: 1.31000, 1.31200, 1.31450

If the price consolidates above the round level of 1.31000, expect a further correction toward 1.31300-1.31500.

Alternatively, expect the quotes to descend toward 1.30500-1.30300.

The USD/JPY currency pair

Technical indicators of the currency pair:
  • Prev Open: 108.982
  • Open: 108.866
  • % chg. over the last day: -0.04
  • Day’s range: 108.810 – 108.888
  • 52 wk range: 104.97 – 114.56

The USD/JPY currency pair has stabilized. The trading instrument is currently consolidating. The local support and resistance levels are 108.800 and 109.000, respectively. Investors are waiting for the Fed meeting. We also recommend that you keep track of up-to-date information regarding the settlement of the trade conflict between Washington and Beijing. Open positions from key levels.

During the Asian trading session, Japan published an optimistic report on the retail sales.

USD/JPY

Indicators do not give accurate signals: the price crossed 50 MA and 100 MA.

The MACD histogram has moved to the negative zone, indicating a bearish sentiment.

The Stochastic Oscillator is in the neutral zone, the %K line crossed the %D line. There are no signals at the moment.

Trading recommendations
  • Support levels: 108.800, 108.650, 108.500
  • Resistance levels: 109.000, 109.300, 109.500

If the price consolidates above the round level of 109,000, expect further growth toward 109.200-109.500.

Alternatively, the quotes could decrease toward 108.650-108.400.

by JustForex

Australia’s FDI may decrease significantly after China’s reforms

By ForexNewsNow

Foreign Direct Investment in Australia is extremely diverse when we first take a look, but the moment we compare it to the FDI of a developing nation we quickly see a large disparity between active players.

Right now, according to research, the biggest investor in the Australian economy is the United States, pretty much like anywhere else. However, 2018 saw a significant decrease in the FDI of Australia after the trade war between China and the United States started to heat up a little bit.

The US was forced to decrease its FDI in Australia in order to allocate more in slightly closer jurisdictions to the Mainland. Countries such as Japan, South Korea, Taiwan and all of the South-East Asian countries received much more support from the US economy, which was a clear indication of the US’s efforts to increase their influence in the region.

When it comes to China though. They decided to double down on pretty much any country they could get their hands on. The FDI in Australia from China increase by $5 billion in 2018 alone and is set to increase even more in 2019.

Should the trend continue of the US decreasing FDI and China increasing it, by 2021 Australia will have a new largest investor of their local economy in the face of China.

This puts immense pressure on the local authorities as it’s quite hard to collaborate with a country that has different morals to a governing policy. Thus, Australia could find itself under pressure from forcing regulations or various other economic policies.

But that’s beside the point. What needs to be addressed is the economic implications that current Chinese economic policies could bring to Aussies.

Investment in Australia besides official FDI

One major variable we need to take into account is the unofficial FDI into the Australian economy coming from Mainland China. As unfortunate as it may be, most of the unofficial FDI comes in the form of money laundering from China.

Wealthy Chinese citizens usually get the desire to escape the Chinese economy once they’ve made their fortunes, which forces them to make significant investments in neighboring democracies to qualify for citizenship.

However, in order to qualify for their citizenship, the investment needs to be private rather than corporate. Considering that the Chinese government has strict regulations on private investments abroad, it’s getting harder and harder to qualify for other countries.

The slightly more lax regulation applies to countries like Australia and Canada, which is why we see so many Chinese nationals in these countries. Most of them used the opportunity to invest in things such as real-estate or local Aussie companies, which then gave them the opportunity to switch citizenship and move their wealth outside of China.

Another popular method is sending their children to Australia for university studies, after which the Australian law allows them to stay and work. After spending around 5 years in the country, these young Chinese nationals are prioritized as immigrants and thus, are granted citizenship much more easily, without requiring large investments.

The family members that still remain in the Mainland then start the process of transferring their wealth to their child in Australia and manage to legitimize their “de-funding” of the local economy.

Straight up illegal money laundering

Another part of FDI in the Australian economy, which the Aussie government may not have wanted to happen was through the transportation of wealthy Chinese gamblers.

One occasion with Crown Casino has already been unearthed and is being investigated if this activity was in direct violation of the Chinese gambling laws. Considering that several Crown employees have been arrested in the Mainland a year ago, it’s safe to say that it was.

The event didn’t necessarily damage the relations between China and Australia as it was a private venture. But the investigation could soon find out that the dealings were also guaranteed by Aussie lawmakers.

Because of such an event, Australian casino games for real money have started to be pressured by stricter surveillance, therefore adding a bit more costs to their compliance departments. Although the costs are not that high, it could add up significantly over the course of the following years.

Chinese economic policy that could tank FDI

A new economic policy in China could potentially limit the billions of dollars funneling towards the Australian economy illegally.

This policy was first announced by President Xi Jinping on Thursday last week, where he emphasized the importance of adopting the blockchain technology into the local economy.

This would have been amazing news for Aussie crypto companies, but the reality is not that bright.

The adoption of the blockchain does not necessitate the adoption of cryptocurrencies in China. It’s rather a creation of the groundwork for the adoption of the state digital currency that the People’s Bank of China is developing as we speak.

It’s basically a policy to advance the digital economy, thus limiting the flow of physical cash outside of the country.

This means that if the Chinese economy is largely digitized, it will become extremely hard to move cash outside of the country without the government taking notice.

Therefore, all of the “unregistered” investments that were coming into Australia may soon disappear, thus limiting cash inflow.

Will it take a toll on the economy?

It’s very unlikely for a couple of billion dollars in an economy as large as Australia take a huge toll. However, it’s likely that the AUD will be somehow affected considering the drop in demand.

Pair that up with the already serious issues due to the trade war, and we get a pretty bleak picture for the Australian economy in the coming years. Unless the USA resumes its past investment strategies in the region.

By ForexNewsNow

Japanese Candlesticks Analysis 29.10.2019 (USDCAD, AUDUSD)

Article By RoboForex.com

USDCAD, “US Dollar vs Canadian Dollar”

As we can see in the H4 chart, USDCAD is still trading close to the support level and forming reversal patterns, such as Doji, Hammer, and Inverted Hammer. Right now, the pair is trying to reverse and may continue growing towards 1.3186. However, we shouldn’t ignore another scenario, according to which the instrument may fall to reach 1.3030.

USDCAD
Risk Warning: the result of previous trading operations do not guarantee the same results in the future

AUDUSD, “Australian Dollar vs US Dollar”

As we can see in the H4 chart, AUDUSD has formed another reversal pattern, Hammer, in the middle of the rising channel. At the moment, the pair is reversing. Judging by the previous movements, we may assume that the price may reverse and then return to 0.6880. However, we shouldn’t ignore an alternative scenario, which implies that the instrument may resume falling towards 0.6777.

AUDUSD

Article By RoboForex.com

Attention!
Forecasts presented in this section only reflect the author’s private opinion and should not be considered as guidance for trading. RoboForex LP bears no responsibility for trading results based on trading recommendations described in these analytical reviews.

UK Election 2019: Expect the pound and UK financial assets to be increasingly volatile

By George Prior

The pound and UK financial assets will be volatile in the run-up to Britain’s first December general election since 1923 – and will remain so in the event of another hung parliament.

This is the warning from Nigel Green, CEO and founder of deVere Group, one of the world’s largest independent financial advisory organizations, as opposition party Labour announces it is now backing the government’s bill for a December election, regardless of the date.

Mr Green comments: “This is a critical stage in the slow-moving, damaging, torturous Brexit saga.

“Expect the pound and UK financial assets to be increasingly volatile in the run-up to the general election, given the wide-ranging set of outcomes.

“The most detrimental of these outcomes for sterling, UK financial assets and the wider British economy, include another hung parliament or a victory for Jeremy Corbyn’s Labour party.”

He continues: “Boris Johnson’s intention to secure a majority within the House of Commons is by no means guaranteed.

“The Brexit Party will use the fact that Mr Johnson did not deliver Brexit by October 31 – something on which he staked his whole premiership.

“The Remain vote could also be split between Labour, the Liberal Democrats, the Greens and the Scottish National Party.

“Political fragmentation on this scale has never happened before in the UK.

“Therefore, a hung parliament looks like an alarming possibility, meaning there could be no majority to quickly and smoothly resolve the Brexit chaos.

“Should grinding deadlock continue, the UK economy would still haemorrhage investment and confidence. The fallout of Brexit has cost the UK three and a half years of lost opportunity and many, many tens of billions of pounds. This would only intensify with another hung parliament.”

He adds: “Meanwhile Jeremy Corbyn’s Labour party will campaign on the most radical, left-wing manifesto in more than a generation.

“Should he win this election, his anti free-market policies – such as the re-nationalisation of industries from utilities to railways to postal services, and the forcing of companies to give 10% of their shares to staff – plus his high-tax policies, including a possible wealth tax, will spook the financial markets, hit long-term sustainable growth of the British economy, put more pressure on UK financial assets, and lead to a significant sell-off of the pound.

Mr Green concludes: “The general election is set to be the most contentious and uncertain in generations. Investors now need to protect and build their wealth and assets by ensuring they are properly diversified across asset classes, sectors, currencies and regions.”

About:

deVere Group is one of the world’s largest independent advisors of specialist global financial solutions to international, local mass affluent, and high-net-worth clients.  It has a network of more than 70 offices across the world, over 80,000 clients and $12bn under advisement

Ichimoku Cloud Analysis 29.10.2019 (AUDUSD, NZDUSD, USDCAD)

Article By RoboForex.com

AUDUSD, “Australian Dollar vs US Dollar”

AUDUSD is trading at 0.6853; the instrument is moving above Ichimoku Cloud, thus indicating an ascending tendency. The markets could indicate that the price may test Tenkan-Sen and Kijun-Sen at 0.6825 and then resume moving upwards to reach 0.6955. Another signal to confirm further ascending movement is the price’s rebounding from the rising channel’s downside border. However, the scenario that implies further growth may be canceled if the price breaks the cloud’s downside border and fixes below 0.6775. In this case, the pair may continue falling towards 0.6695.

AUDUSD
Risk Warning: the result of previous trading operations do not guarantee the same results in the future

NZDUSD, “New Zealand Dollar vs US Dollar”

NZDUSD is trading at 0.6363; the instrument is moving inside Ichimoku Cloud, thus indicating a sideways tendency. The markets could indicate that the price may test the cloud’s downside border at 0.6335 and then resume moving upwards to reach 0.6495. Another signal to confirm further ascending movement is the price’s rebounding from the rising channel’s downside border. However, the scenario that implies further growth may be canceled if the price breaks the cloud’s downside border and fixes below 0.6320. In this case, the pair may continue falling towards 0.6235. After breaking the cloud’s upside border and fixing above 0.6415, the price may resume its ascending tendency.

NZDUSD
Risk Warning: the result of previous trading operations do not guarantee the same results in the future

USDCAD, “US Dollar vs Canadian Dollar”

USDCAD is trading at 1.3055; the instrument is moving below Ichimoku Cloud, thus indicating a descending tendency. The markets could indicate that the price may test Tenkan-Sen and Kijun-Sen at 1.3080 and then resume moving downwards to reach 1.2935. Another signal to confirm further descending movement is the price’s rebounding from the descending channel’s upside border. However, the scenario that implies further decline may be canceled if the price breaks the cloud’s upside border and fixes above 1.3165. In this case, the pair may continue growing towards 1.3245.

USDCAD

Article By RoboForex.com

Attention!
Forecasts presented in this section only reflect the author’s private opinion and should not be considered as guidance for trading. RoboForex LP bears no responsibility for trading results based on trading recommendations described in these analytical reviews.