by JustForex
The EUR/USD currency pair
- Prev Open: 1.11528
- Open: 1.11517
- % chg. over the last day: +0.06
- Day’s range: 1.11487 – 1.11688
- 52 wk range: 1.0884 – 1.1623
Majors have stabilized. Investors took a wait-and-see approach before the publication of the US labor market report for October, which could have a significant impact on the further rate of adjustment of the Fed’s monetary policy. Recent economic releases from the United States have been mixed. Experts expect a deterioration in key indicators of the labor market. At the moment, the local support and resistance levels on the EUR/USD currency pair are 1.11400 and 1.11750. We recommend opening positions from these marks.
The Economic News Feed for 01.11.2019:
- – Labour Market Report (US) – 14:30 (GMT+2:00);
- – Manufacturing PMI by ISM (US) – 16:00 (GMT+2:00);

The price fixed above 50 MA and 100 MA, which signals the power of buyers.
The MACD histogram is in the positive zone, but below the signal line, which gives a weak signal to buy EUR/USD.
The Stochastic Oscillator is in the neutral zone, the %K line is below the %D line, which indicates a bearish sentiment.
- Support levels: 1.11400, 1.11150, 1.10950
- Resistance levels: 1.11750, 1.12000
If the price consolidates above 1.11750, expect further growth toward 1.12200-1.12400.
Alternatively, the quotes could decrease toward 1.11200-1.11000.
The GBP/USD currency pair
- Prev Open: 1.29021
- Open: 1.29292
- % chg. over the last day: +0.28
- Day’s range: 1.29239 – 1.29727
- 52 wk range: 1.1959 – 1.3385
At the moment, the GBP/USD currency pair is consolidating near key extremes. Sterling is testing the offer area 1.29750-1.30150. Round level 1.29000 is the immediate support. The focus is on the US labor market report. We also recommend keeping track of current information on the Brexit issue. In the near future, technical correction of GBP / USD quotes after a protracted rally is not ruled out. Open positions from key levels.
At 11:30 (GMT+2:00), the UK will publish the PMI in manufacturing sector.

The price fixed above 50 MA and 100 MA, which signals the power of buyers.
The MACD histogram is in the positive zone, but below the signal line, which gives a weak signal to buy GBP/USD.
The Stochastic Oscillator is in the neutral zone, the %K line crossed the %D line. There are no signals at the moment.
- Support levels: 1.29000, 1.28400, 1.28000
- Resistance levels: 1.29750, 1.30150, 1.30500
If the price consolidates above 1.29750, expect further growth toward 1.30250-1.30400.
Alternatively, the quotes could decrease toward 1.28500-1.28300.
The USD/CAD currency pair
- Prev Open: 1.31610
- Open: 1.31648
- % chg. over the last day: +0.08
- Day’s range: 1.31411 – 1.31734
- 52 wk range: 1.2727 – 1.3664
The USD/CAD currency pair has stabilized after a sharp rally since the beginning of this week. CAD is currently consolidating. USD/CAD quotes test local support and resistance levels: 1.31400 and 1.31750, respectively. A trading instrument has the potential for further growth. Today, participants in financial markets will evaluate labor statistics from the United States. We also recommend paying attention to the dynamics of oil quotes. Open positions from key levels.
The Economic News Feed for 01.11.2019 is calm.

Indicators do not give accurate signals, the price crossed 50 MA.
The MACD histogram is close to 0.
The Stochastic Oscillator is in the neutral zone, the %K line crossed the %D line. There are no signals at the moment.
- Support levels: 1.31400, 1.31000, 1.30750
- Resistance levels: 1.31750, 1.32000, 1.32350
If the price consolidates above 1.31750, expect further growth toward 1.32200-1.32400.
Alternatively, the quotes could correct toward 1.31000.
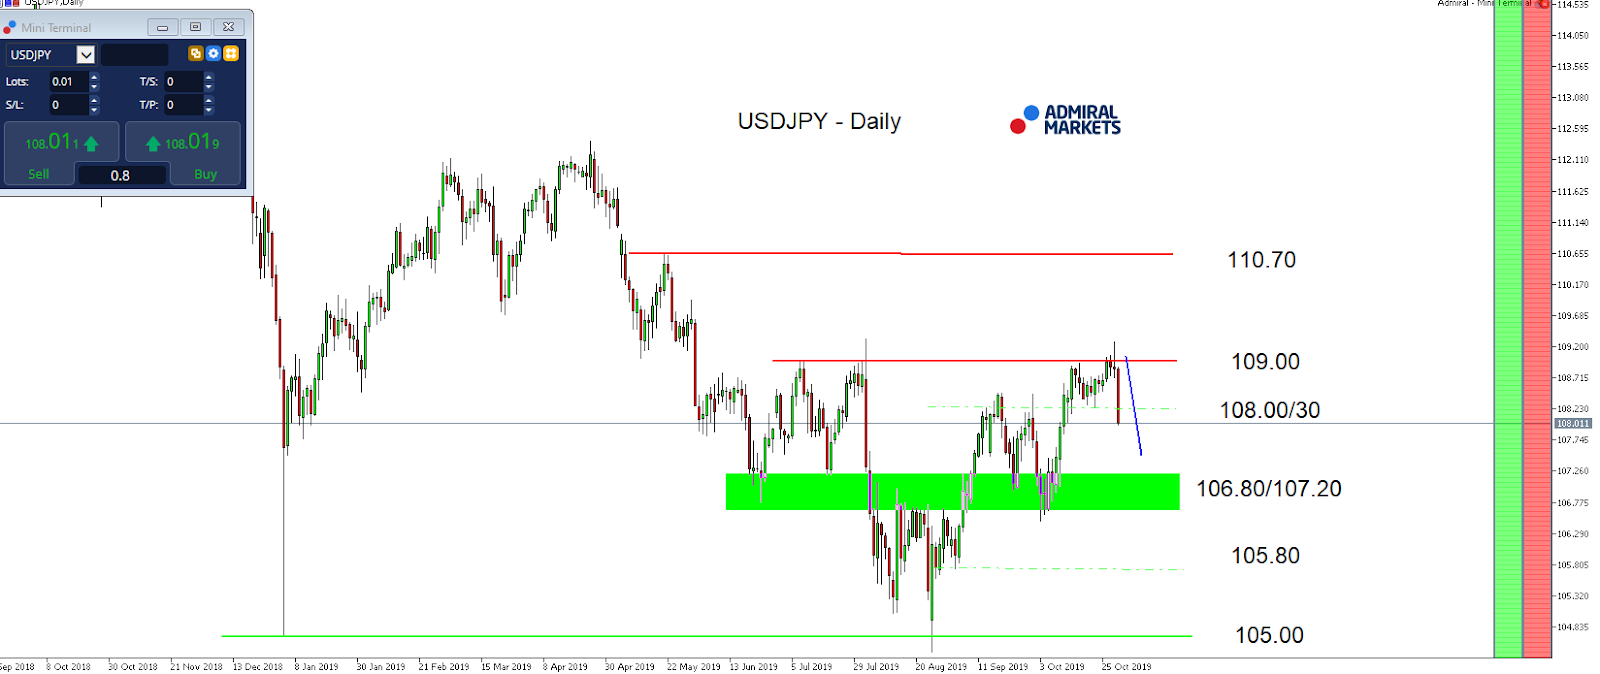
The USD/JPY currency pair
- Prev Open: 108.849
- Open: 108.018
- % chg. over the last day: -0.77
- Day’s range: 107.886 – 108.057
- 52 wk range: 104.97 – 114.56
Aggressive sales are observed on the USD/JPY currency pair. Yesterday, the drop in quotes exceeded 80 points. The trading instrument has set new local lows. At the moment, the currency of the “safe haven” is consolidating in the range 107.900-108.150. We are expecting important economic releases from the USA. We also recommend that you keep track of up-to-date information regarding the settlement of the trade conflict between Washington and Beijing. Open positions from the key levels.
The news background on the Japanese economy is calm.

Indicators point to the strength of sellers: the price has fixed below 50 MA and 100 MA.
The MACD histogram is in the negative zone, but above the signal line, which gives a weak signal to sell USD/JPY.
The Stochastic Oscillator is in the neutral zone, the %K line is below the %D line, which indicates a bearish sentiment.
- Support levels: 107.900, 107.600, 107.350
- Resistance levels: 108.150, 108.300, 108.600
If the price consolidates below 107.900, expect a further drop toward 107.600-107.400.
Alternatively, the quotes could grow toward 108.400-108.600.
by JustForex