By TheTechnicalTraders.com
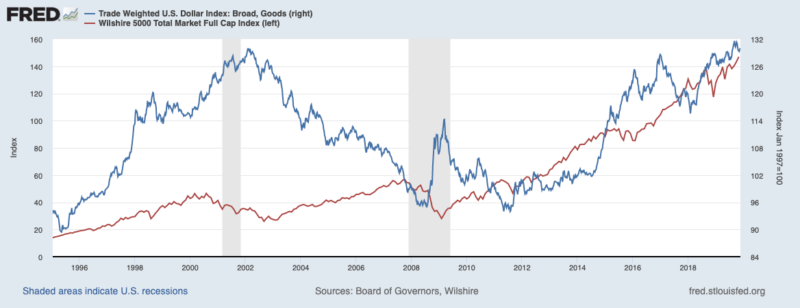
Our research team has been warning that the US stock market price rally over the past few months has been more of a zombie-land price rally than a true valuation rally. Our researchers believe the continued push higher has been more about capital seeking safety away from foreign risk and into US Dollar based assets than it has been about anything fundamental or valuation based. Over the past few days, our researchers identified another rally like this that happened recently and wanted to highlight the eventual outcome of this type of Zombie-Rally. Before you continue, take a couple of seconds and join our free trend signals email list.
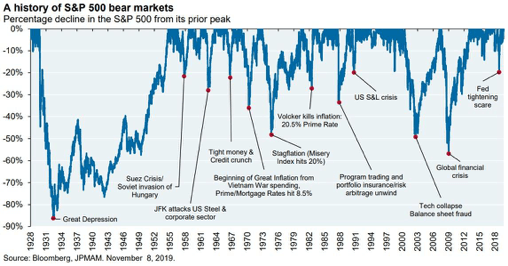
Zombie-Rallies happen in the market when there are really no other alternatives but to “keep doing what seems to have been successful over the past few months or years”. A good example of this is the DOT COM rally that continued to push higher and higher even though investors and traders could clearly see the wheels were coming off the train and companies were not able to achieve profits to measure up to proper valuations. This is a measure of GREED becoming a driving force behind investor sentiment. Who’s going to go against the markets when the trend bias is continuing to push higher and the risks of shorting far outweigh the risks associated with following the herd.
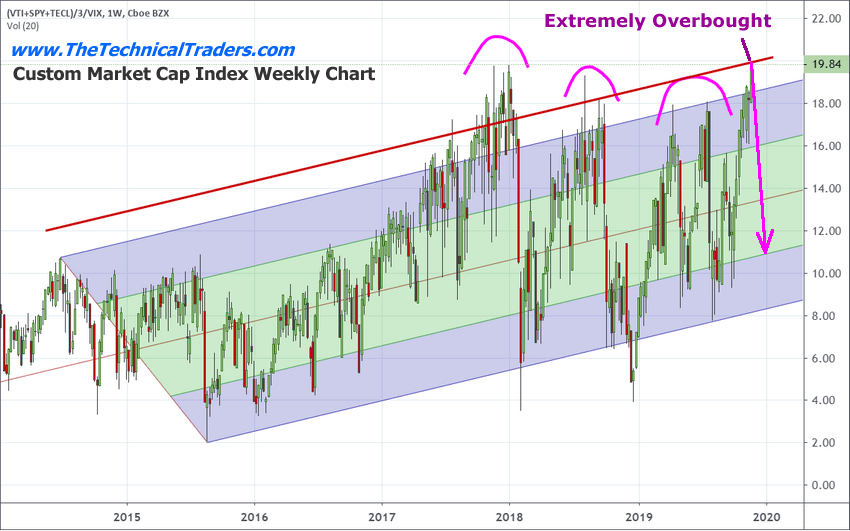
Our researchers use our Custom Market Cap index to help us understand where peaks and valleys are likely to form in the markets and, generally, this utility is quite accurate. It measures the ability of the US stock market to rally, sell-off and rotate very clearly and can be used to measure when the price has reached near extreme levels. Recently, we authored an article suggesting liquidity and volume would begin to fall over the next few weeks and months that would result in increased volatility headed into the end of 2019.
December 1, 2019: LIQUIDITY & VOLUME DIMINISH – WHAT NEXT?
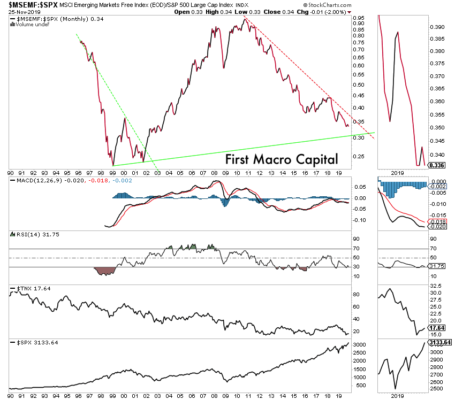
Custom Market Cap Index chart is clearly identifying a market peak
Our Custom Market Cap Index chart is clearly identifying a market peak has formed as of the end of
November 2019. The extreme high peak on this chart on the Thanksgiving holiday week is well above traditional high peak levels and should be considered an extremely high price exuberance peak in the US stock market. Our expectations were that an immediate price rotation would setup pushing prices much lower over the next few days and weeks.
Historically, once the price reaches these extreme levels, the price typically rotates lower and attempts to target the lower/middle price boundaries drawn by our channel lines. This would suggest that an 8 to 12% downside price rotation is in our future should this price peak follow previous examples.
Yet, what other evidence could we present to support our expectation that this recent price rally is truly a “zombie-rally”?
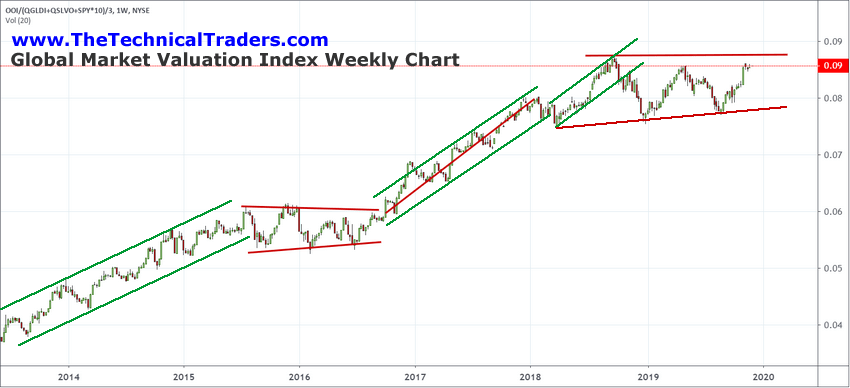
True Stock Market Valuation Appreciation Index
Our researcher team put together this chart to highlight the true valuation appreciation at various times within the past 6+ years. When this chart is climbing, valuation levels in the global stock markets are rising in comparison to traditional safe-haven instruments. When this chart is falling, then valuations are decreasing in comparison to safe-havens and total overall valuation appreciation. Think of it as a measure of how much conviction is behind the market price activity. The more traders believe the future appreciation is valid, the more valuations will appreciate and investors will move away from safe-haven investments. The more concerned traders become about price valuation levels, the more likely they are to begin to hedge into protective, safe-haven, investments and the less confidence they have in the ability of price to appreciate in the future.
This chart highlights a number of key factors…
_First, the true market peak occurred in September/October 2018. That was the high point on this Global Valuation chart and that was the peak of positive investor sentiment before the US Fed initiated a very deep price rotation.
_Second, the rally from the November 2016 Presidential elections till the January 2018 peak was a true broad-participation rally where global investors really believed in the future price appreciation of the global stock markets. Thus, we see this Global Market Valuation chart rally much higher after the November 2016 elections.
_ Third, since the peak in October 2018, the global market participants have been much more fearful of the capability of future price advances. There has been no real price appreciation advance on this chart since the peak in October 2018 and we believe this highlights a very weak foundation in the global markets for this current “zombie” price rally.
If our researcher team is correct, there is a very real potential that a broad market price rotation could test the lower boundaries of this market valuation chart and possibly attempt to push true global market valuations below the February 2018 lows. This would represent a complete collapse of the global stock market resulting in a -10 to -15% price correction over the next few weeks/months.
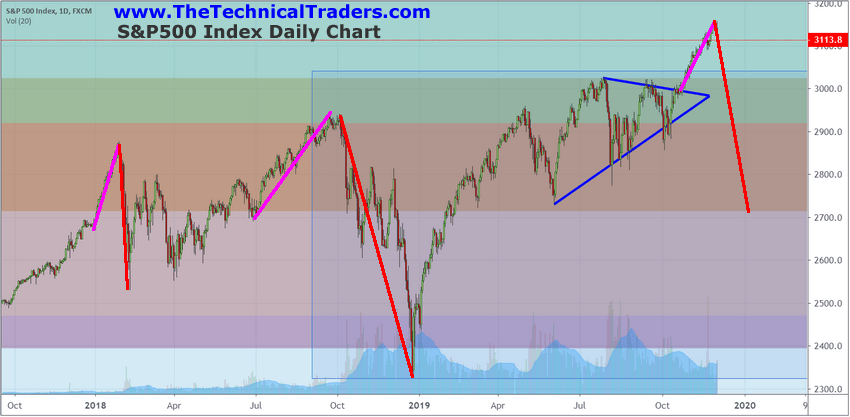
Every rotation on the Global Valuation Chart over the past 3+ years can be clearly seen on this SP500 chart. The January 2018 peak followed by the downward price collapse. The October 2018 peak followed by the downward price collapse. Even the June and August 2019 price rotations are clearly evident in the Global Market Valuation chart as downward valuation corrections.
Current US stock market peak is not supported as a true valuation
The current US stock market peak is not supported as a true valuation advance by this data. Yes, the stock market level is much higher than the peak level in October 2018, but the underlying global market true valuation level is suggesting this is a zombie-land for investors.
The only other time something like this happened was near the end of 2017 when the US stock market continued to climb much higher even though the valuation levels were already weakening. Although this was a brief period of time, the span from November 2017 till the end of January 2018 resulted in a very similar type of price rally. Take a look at the “2018” markers on these charts. You’ll clearly see the Global Valuation chart is showing the valuation level was DECLINING just before the start of 2018 whereas the SP500 chart shows the market price was rallying upward consistently… Welcome to Zombie-land.
Concluding Thoughts:
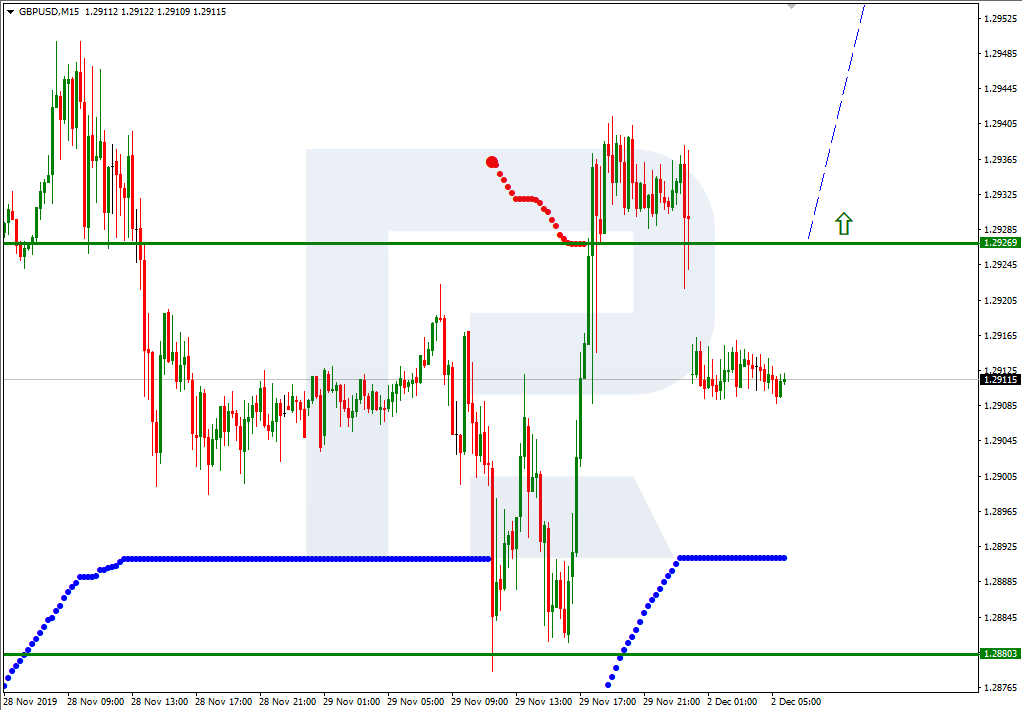
If our researchers are correct, this current rally will likely end as we near the end of this year when volume and liquidity diminish. The rotation lower, on Monday, December 2, was very clearly a downward price rotation away from these extreme peak levels and, potentially, an end to the zombie-land price rally of the past few months.
The end of 2019 and early 2020 could be full of very violent and dramatic price rotations as the true global market valuation levels have yet to rally to meet the US stock market peaks. This underlying fact suggests that price must fall in order to realign with true valuation levels or the valuation levels must immediately start to rise to meet current price levels. Our research team believes that price levels will collapse to meet true valuation levels. There is no indication that any true investor valuation appreciation is taking place at the moment, thus price must fall to fair values based on true investor valuation estimates.
We’ll keep you informed as this plays out with Wealth Building & Global Financial Reset Newsletter if you like what I offer, join me with the 1 or 2-year subscription to lock in the lowest rate possible and ride my coattails as I navigate these financial market and build wealth while others lose nearly everything they own during the next financial crisis. Join Now and Get a Free 1oz Silver Round or Gold Bar Shipped To You!
I can tell you that huge moves are about to start unfolding not only in metals, or stocks but globally and some of these super cycles are going to last years. A gentleman by the name of Brad Matheny goes into great detail with his simple to understand charts and guide about this. His financial market research is one of a kind and a real eye-opener. 2020 Cycles – The Greatest Opportunity Of Your Lifetime
As a technical analysis and trader since 1997, I have been through a few bull/bear market cycles. I believe I have a good pulse on the market and timing key turning points for both short-term swing trading and long-term investment capital. The opportunities are massive/life-changing if handled properly.
Chris Vermeulen
Founder of Technical Traders Ltd.
TheTechnicalTraders.com