The U.S. Dollar Has Finally Corrected. Will the Correction Continue?
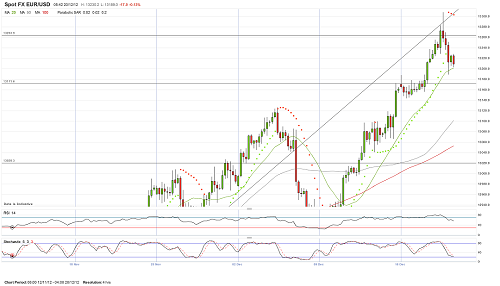
EURUSD
Yesterday, bulls in the EUR/USD continued to amaze by its tenacity and optimism, pushing the pair higher and higher. The single currency did not even try to test the broken-through resistance near 1.3170 and finding its support at 1.3229 its growth was resumed. The pair immediately passed the resistance at 1.3255 and continued to increase until it reached the level of 1.3308. There, market participants decided to take profits, having led the pair decrease to 1.3236, but during the Asian session on Thursday, the pair dropped to 1.3189. There, the pair rolled back from the level of 1.3228, which acted as the resistance again. Consequently, the pair left the overbought state on the 4-hour chart, due to its correction to 1.3189, and it is wise to assume that its growth will be resumed towards the current high, because yesterday’s drop is corrective and while quotes are holding above the broken-through level of 1.3170, the euro prospects remain constructive. In anticipation of the holidays and in the absence of news, the pair could well remain in the range of 1.3170 — 1.3308. In case of the loss of the support near 1.3170, the euro will drop to the level of 1.3126, which can be considered as the key one for the bulls in the pair. By and large, the EUR/USD could well be corrected to this level too.
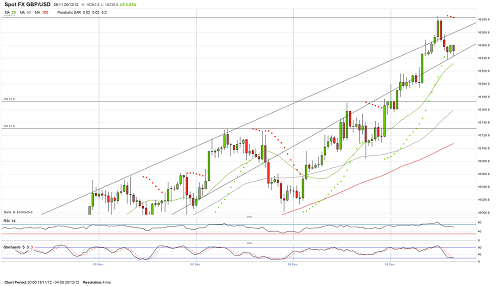
GBPUSD
The GBP/USD pair also demonstrated a positive mood. The pound continued increasing to the level of 1.6262 and reached the 1.6306 resistance without any pullbacks, rising above the upper line of the ascending tunnel. Both on the 4-hr and daily charts, the RSI was in the overbought zone, the pair hit the highs of September, from which it dropped to 1.5828, thus profit-taking was surprisings. As a result, the GBP/USD ended the day with its drop to 1.6238, having returned to the bottom line of the ascending tunnel. There, on the 4-hr chart, the RSI left the overbought zone, thus if the pound can consolidate at the current support, it will be wise not to exclude another attempt to increase to the 63rd figure. The loss of 1.6238 would decrease the rate to the 1.6180/70 proximity, which can be considered as the key one for the British pound bulls.
USDCHF
Yesterday, bears in the USD/CHF pair completed their minimum program. They brought the dollar to 0.9088, due to their sales from 0.9133. When this level was reached, the pair was undergone an upward correction, which allowed the dollar to recover to 0.9153. There, on the 4-hr chart, the RSI out of the oversold zone that promotes re-testing of the 91st figure. Nevertheless, the upward correction could well last up to the 0.9200 — 0.9240 proximity. Its rise above the latter resistance, would weaken the bearish pressure in the pair. In the absence of fresh incentives, breakdown of the current highs seems unlikely.
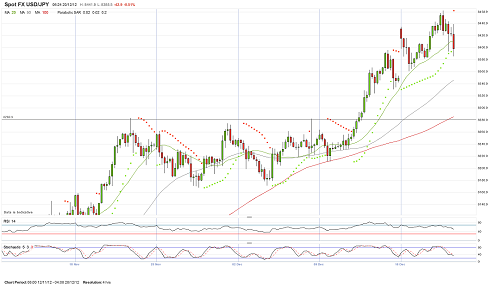
USDJPY
The dollar continued to push the Japanese yen higher. After reaching the level of 84.61, there’s something happened to the bulls that did not allow the dollar to increase higher. Having felt the bulls’ weakness, bears decided to take advantage of the situation and made the pair’s rate decrease to 83.86. Even the fact that the Bank of Japan expanded its Asset Purchase Program did not encourage the bulls to increase above 84.40. Despite the increased chance of the dollar’s decrease towards 83.20 — 81.80, it is premature to talk about changes in the speculators’ attitude towards the Japanese currency. Nevertheless, the probability of the USD/JPY pair’s growth above the 84.40/60 proximity looks pretty low.