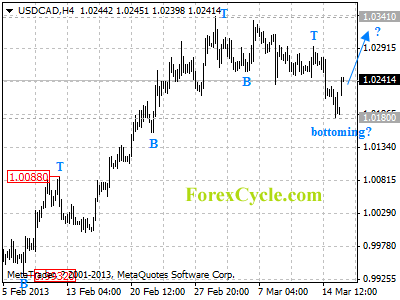
USDCAD may be forming a cycle bottom at 1.0180 on 4-hour chart. Further rise towards 1.0341 previous high would likely be seen in a couple of days. Key support is now at 1.0180, as long as this level holds, the price action from 1.0341 would possibly be consolidation of the uptrend from 0.9815 (Jan 11 low), one more rise towards 1.0500 is still possible after consolidation. On the downside, a breakdown below 1.0180 will indicate that the uptrend from 0.9815 had completed at 1.0341 already, then the following downward movement could bring price back to 1.000 zone.
Part of our job as an investment advisor is to recognise a changing stock market.
We need to figure when to buy and when to sell.
And importantly, we need to tell our clients (subscribers to our monthly investment advisory, Australian Small-Cap Investigator) the best way to manage that advice.
Last Friday the market shot up 1.75% to close near its recent high point. This morning it looks set to give back some of those gains. It has been an extraordinary four months as the stock market has gained more than 20%.
So, has the stock market changed? Yes, it has. But not perhaps in the way you think.
And you’ll need your wits about you to make money from this market over the next nine months…
Most investors think a changed market means it’s set to reverse direction.
In other words, if the market has gone up, the next stage must involve the market going down, and vice versa.
And we wouldn’t blame you if you thought that way. Heck, it’s the first thing we consider when a stock appears to have topped or bottomed out.
But there is another option, and it’s one most investors ignore. That’s right, we’re talking about a sideways moving market…
Market Update: Why Stocks Have Stopped Being Stocks
Looking at the current chart of the S&P/ASX 200, it seems clear to us that the index is about to settle in for a prolonged period of sideways movement. Look at the chart for yourself:
We don’t pretend to be a technical analyst. We prefer to leave that to our trading expert, Murray Dawes. He says the market is on the verge of a major breaking point that could see a bloodbath for the stock market.
But there’s no certainty that will happen straight away. The market has a habit of misbehaving and not reacting in the way you expect.
That’s how things look right now. Because the key thing to remember is that the stock market isn’t just about what’s happening with individual stocks. The stock market has actually become an extension of the interest rate market.
That’s why we believe dividend-paying stocks will move strictly on a relative yield basis for at least the next nine months…possibly longer. What do we mean by that?
Simply put, dividend stocks will rise and fall based on whether the market believes the Reserve Bank of Australia (RBA) will raise or cut interest rates.
If the market thinks the RBA will cut interest rates then you should see dividend-paying stocks go up. But if the market thinks the RBA will raise interest rates then you should see dividend-paying stocks fall. And given the recent strong run, it could be a big fall…hence Murray’s warning.
But do you know what? It’s one big game. We’re not convinced the RBA will move interest rates one jot this year…
It’s All a Game for the RBA
Like many experts, we thought there was a good chance the RBA would cut rates this year. But we’ve now realised something. The RBA is playing a crafty game of cat-and-mouse.
It’s trying to do what all central planners try to do – manipulate the economy and the markets.
The RBA figures that if it can use subtle messages to steer the market rather than actually cutting or raising interest rates, then it will leave itself with something in its arsenal if the economy really hits the skids.
That’s why we now believe the RBA will sit pat for at least the rest of the year.
The flipside is that the RBA also doesn’t want to engineer another stock market bubble just yet. Neither does it want to engineer a crash. It would like to see asset prices just plateau for now, hoping for some stability until the rest of the world gets its game in order.
A stable stock market will also take some heat off the RBA for keeping interest rates low. If stocks just trade in a sideways fashion the RBA can point to the market and say, ‘Look savers, you can get good dividends buying shares, and they aren’t too risky either…they’re just going sideways. So stop complaining.’
If you look at the charts you’ll see the same story played out in the US. That was what all the tap-dancing was about with the US’s money printing and bond buying program. It was (and still is) all about manipulating stock prices.
As always, we could be wrong on this. Dividend stocks could soar or collapse today or tomorrow and leave us with egg on our face. But we don’t think so.
The key for investors now is to make sure you understand the game that’s at hand and use it for your benefit. We’ll explain this in more detail, and the strategy you should use for the year ahead, at the end of the week.
We all know that we should invest for the long term.
Making short-term punts, ducking in and out of stocks in reaction to headlines, and generally trading too much, is a recipe for losing money.
Yet it’s very tempting. If you’re remotely interested in the workings of the financial markets, then it’s very hard not to pay attention to their ups and downs. And when you see ‘hot’ stocks doing well, or exciting new trends taking off, you naturally want to get on board.
So you might be tempted to take the decision out of your own hands, and give all your money over to a fund manager to invest.
The trouble is, what few investors realise is that the ‘professionals’ are beset by exactly the same emotions. In fact, if anything, it’s even harder for them to resist the urge to invest for the short term.
Here’s why – and what it means for your money…
The Investing Incentives Are All Wrong
As Paul Woolley and Dimitri Vayanos point out in the FT, the ‘long-term’ versus ‘short-term’ investing debate is a bit of a hot topic among governments just now.
The most recent paper on the topic has come from the G30 (a think tank comprised of various economists and former central bankers and regulators). According to Woolley and Vayanos, they argue that regulators should draw up ‘best-practice guidelines’ for long-term investors such as pension funds or sovereign wealth funds.
The idea is that this code would help all investors to understand just how damaging the current approach can be to their money.
So what sort of thing would be in it? Interestingly enough, it’s the sort of thing that we’ve been banging on about for a long time.
The distinction between short and long-term investing is not just about the length of time you hold an asset for. What really matters, say Woolley and Vayanos, is ‘the investor’s choice between the two basic investment strategies of momentum trading and fundamental investing.’
Momentum traders forget about trying to value stocks or any other asset. They just buy when prices are rising, and sell when they’re falling. The tools of the trade will usually involve charts and technical analysis.
Fundamental investors try to work out the ‘fair value’ of an asset, based on things like cash flow, and profitability, and balance sheet strength. They’ll look at the books and pore over ratios. If they find something that’s sufficiently cheap, they buy, sit back, and wait for the price to recover.
Both approaches have their place. Dedicated momentum investors can do very well. And ‘fundamental’ investing has made the likes of Warren Buffett a lot of money over the years.
The trouble is, lots of fund managers who purport to be using fundamentals, are really just chasing performance. And this largely comes down to the way the finance industry is structured. Fund managers are measured on short-term performance.
So why would you bother searching for value? Your best bet for a quiet life and some relatively easy money is to hug your benchmark as tightly as possible. If that involves over-trading and racking up lots of costs, so be it. As long as your performance is merely mediocre, and not downright catastrophic, your job will be safe.
It’s called ‘career risk’. We’ve discussed it many times in the past. It’s probably one of the most destructive forces in the market.
The Solution to Career Risk
Woolley and Vayanos come up with some good ideas for what should be in a ‘long-term investing code’. For example, they suggest capping fund turnover at 30% a year, and scrapping performance fees based on short-term results.
Persuading investors to look at other measures of success when choosing funds, could help to push a change of attitude in the business. Particularly now that the consumer focus is falling so heavily on costs.
But you don’t have to wait for this to happen. As an individual investor, you don’t have to worry about justifying your performance to anyone else. So all the distortions caused by ‘career risk’ vanish when you take your investments into your own hands.
You don’t have to worry about beating, or matching a specific benchmark. All you need to do is to keep your nerve. That’s easier said than done.
How to Profit From Short Term Investing
This said, I wouldn’t dismiss momentum investing out of hand. Momentum or trend-following can be a very successful strategy. But you need to know what you’re doing.
Today I want to answer a question that I’ve heard from more than one reader about the North American oil patch, and what it’s doing to world markets. Consider this your cheat sheet.
Doubtless, you’ve heard stories about how US and Canadian oil output is climbing. All true – well, most of it. In the US, it’s the ‘shale gale’, with all the new output from fracking in shale, tight sands and such. In Canada, it’s a similar share story and, of course, the oil sands boom.
I’ve written about the shale gale, both to describe it with admiration, for the technology and ingenuity involved. Also, I’ve offered cautions about believing too much of the press release kind of news, about so-called ‘energy independence’ based on vast new volumes of oil from shale. One big issue is the ‘drilling treadmill’ – the need to drill more and more wells to keep output up.
Let’s set that matter aside, and look at some trends…
A Quick Tour of the World
The fact is that, drilling treadmill or no, US oil output is increasing. And US oil imports are declining. What does it mean?
It means that US imports are falling from nations like Saudi Arabia, Kuwait, Venezuela, Angola, Nigeria, Morocco and Mexico. It also means that these nations have to find new markets for their oil. It’s easy enough to say, ‘China will buy it,’ but that’s not entirely the solution. Even China has its limits, believe it or not.
Basically, the global numbers show that more and more tanker loads of oil don’t have a home. So more and more oil hits the spot market, and this has a downward effect on overall world oil pricing – the Brent Price being the best indicator.
To some extent, it’s demonstrable that Saudi Arabia has cut back on export volumes, to keep up the price. But even then, Saudi Arabia has to export a certain amount of oil, and ring the cash register for a certain amount of money, just to balance its books. So how much can Saudi Arabia cut back? We’ll find out – sooner, likely, than later.
Consider, also, that much Iranian oil is holed up, in the Persian Gulf, due to international sanctions, while Iraq is ramping up its oil output. When these two nations kick into higher gear, a few years downstream, we’ll see more supply pressure on prices.
At the same time, North American shale oil is not just complex technology, it’s expensive, too. The economics of the new oil patch dictate prices in the range of US$60 and more, per barrel, to keep the wells pumping. Yes, new barrels are coming. But they’re not cheap, and every operator has a hard nut to crack every month, to pay the bills.
A North American ‘Lid’ On Oil Prices
The good news, in all of this, is that new North American supply seems to be keeping a lid on upward trends in oil prices. World oil demand is increasing, and every barrel gets used. One estimate is that for every 1% shortfall on global supply, the marginal price could spike up by 20%. Wow. There’s huge pricing risk built into a stalled oil supply. So let’s hope that it doesn’t stall.
Meanwhile, the economics of that North American oil have a floor, below which oil can’t fall for too long without severe disruption to supply. It’s like we’re in the eye of an energy storm. Enjoy it while we’re there.
In other words, with North American oil output growing, there’s a lid on upward price spikes. As for a price drop into the doldrums? Well, not without a global recession to kill off large parts of world demand.
Another benefit? Most of the new North American oil is moving by rail car. In terms of numbers, about 60% of ‘new’ supply moves by rail, versus 40% by pipeline.
For example, oil from the Bakken play in North Dakota is going by rail to Philadelphia, to the old Trainor Refinery. There, the North Dakota oil gets cracked into jet fuel for Delta Airlines.
Delta pipes the fuel to JFK, and has the lowest fuel-cost among all the carriers that fly across the Atlantic. North Dakota oil helps win the business for transatlantic air travel. Who could’ve predicted that?
Consider also, that much of the US coal industry is in the doldrums, what with the closure of coal-fired electric power plants and lack of construction of new coal plants. Most of that coal used to move by rail, from the mines to the power stations.
Now, the slack in coal shipments is being taken up by rail shipments of oil. Again, who would’ve predicted that? We’re sort of back in the days of John Rockefeller, who controlled the oil biz by making deals about shipping oil with railroads.
Anymore? No idea is too crazy. Things that people – including me – thought were nuts just five years ago, are now the common wisdom.
The Physics of Finance and Extreme Weather: Interview with Mark Buchanan, Part I
Author and Physicist Mark Buchanan makes the case for economies as natural, patterned systems.
Mark Buchanan is a former editor at Nature and New Scientist, and currently writes monthly columns for Bloomberg View and Nature Physics. He received the LaGrange Prize for writing on issues in complexity science in 2009. Buchanan brings physics-inspired thinking to the understanding of financial systems.
Mr. Buchanan will speak about his work at the 3rd Annual Social Mood Conference April 13 in Atlanta. Reserve your seat today >>
JMN: Your latest book compares the physics of meteorology to the trajectory of modeling financial markets. Forecast will publish this spring, but how long ago did these ideas begin to crystallize?
MB: I started writing about a year ago. But I suppose I started reading about all the material and doing the research maybe 15 years ago.
Physicists began to model financial markets in a new way about 15-20 years ago. The old traditional economic models look at an economy as a system in equilibrium, or a kind of balance. Each individual in the market has certain aims, and they try to act in a way to reach those aims. Of course, not everyone’s aims can be met at the same time, but… all the forcescome together and find a balance point where everyone is satisfied as well as they can be.
[But markets] aren’t like that. If you look in the real world, they’re hardly peaceful systems that you would describe as tranquil and at rest.
JMN: Hardly.
MB: Rather, they’re churning around every day, crazy things are happening, they’re very unpredictable, there’s kind of wild chaos in the markets. So how can you understand that? Equilibrium theory has the simplest conceptual way of understanding that. They say, “[The market] would be in perfect, calm rest if it weren’t being perpetually knocked about from the outside. There are always new inventions, new companies being started, new managers being hired, and new products come to market. All of this creates information and knowledge that shakes up the market every day…
JMN: Okay, so why is this standard, traditional/fundamental explanation wrong? It does offer a narrative…
MB: That’s a very simple way of thinking. It’s more or less akin to the way physicists think about very simple systems — like the water in a bathtub… It’s smooth on the surface, but if you smack it with your hand it stirs a bunch of waves. There’ll be chaotic motion on the surface for a short period of time and then it will gradually relax into a smooth, stable [resting point]…
JMN: But that’s assuming it’s a simple system, right?
MB: Right: it’s really simple…. The physics of the water in the bathtub is really old physics: it’s a centuries-old understanding. I’d say in the past century, physics has moved on… to thinking about systems that inherently will not come to a state of rest or balance, and have their own internal dynamics…
One of the most obvious [examples] is the weather. If you look at the weather, of course, sometimes we have nice blue skies and sunny days and calm atmospheres. But other days, out of those blue skies — for normal, ordinary reasons– you get storms that brew big weather systems…
Three centuries ago, people tried to understand the weather as an equilibrium system: just a bunch of air being heated near the equator. That warm air rises into the upper atmosphere and travels up toward the poles, and then descends again. [People] tried to think of a system that has a really nice, stable flow of air… really simple (kind of like water in a bath) just sitting there in a very stable pattern. But that doesn’t explain almost anything about the weather.
JMN: Right. It doesn’t explain the more dynamic weather systems…
[And] these continual, churning storms and systems make the weather and the atmosphere very interesting. That was only understood, amazingly enough, starting around the 1950s. It took some of the early computers [for us] to start to understand where weather systems come from.
The basic story is that there are “positive feedbacks” — what we can call “instabilities” by which, if you have a system with no interesting pattern. So everything looks the same, and blue sky is everywhere — if you perturb that a little bit, the disturbance has a tendency to create forces which make it grow, so you get more of a delineation…more of a deviation creates forces again which act again to create positive feedback. You get a driving force that disrupts the nice, stable equilibrium pattern and creates these churning storms and weather systems…
The system has natural forces within it which are continually churning up new patterns that haven’t existed before, creating change. You don’t need anything coming from the outside to “smack the system around.” You don’t need those shocks from the outside in order to have perpetual change and perpetual chaos in the system.
And this is basically true not only in the atmosphere, but also in nearly everything we know in the biological and physical world. It’s true in the human body, in the oceans, even in the way the sun interacts with the earth (solar wind). It’s just true everywhere.
It would be a shock, really, if somehow the economy was the one system in the world that didn’t conform to the same kinds of patterns. In fact, it does not conform to the equilibrium picture. It also falls into this class of disequilibrium systems which have their own internal dynamics.
JMN: And this is where your physics background meets financial theory…
MB: [Instead of] building models of parcels of air being heated and rising and falling in the atmosphere, you build models of individuals or firms acting (within some economy) where they make decisions every day to undertake certain projects, or to buy and sell in a stock market, and they’re looking to the past and forming theories about how they might act best in their own interest. They then take some actions. …
To learn about what Mark Buchanan has found at the intersection between physics and finance, watch this space for Part 2 of the interview…To see him at the 2013 Social Mood Conference, REGISTER NOW>>
By www.CentralBankNews.info Real-time information about the financial sector, such as asset prices, interest rates and credit aggregates, can help predict future changes in the real economy, though less about inflation, according to the Bank for International Settlements. (BIS). However, so far economists have failed to agree on which financial variables to focus on. The BIS, one of the only institutions to voice concern about growing financial imbalances prior to the 2008 financial crises, continues in its latest quarterly review to deepen the understanding of how the financial sector interacts with the real economy. Macroeconomic models typically take a simplistic and abstract approach to the interaction between the real economy and the financial sector. They mainly focus on real variables, such as GDP and prices, along with money and interest rates as financial variables. This modelling shortcut does not mean that economists have disregarded financial factors. Charles Kindleberger’s classic work on the history of financial crises, for example, focused on the link between the business and financial cycles. But Kindleberger, who worked at the BIS shortly before World War II, and other earlier economists adopted a narrative rather than a formally quantitative approach. Current economic models that incorporate financial variables rarely venture beyond the yield curve and/or the price of assets, such as equity or property, BIS said. “However, as the experience of the recent crisis underscored, the channels of transmission between the real and financial sectors can be very strong and diverse, working through asset prices as well as the balance sheets of financial institutions, households and firms,” wrote Magdalena Erdem and Kostas Tsatsaronis in the March BIS quarterly review. The financial crises has triggered a wholesale re-think among economists about their models and work is now underway to build models that reflect the critical role of the financial sector in the real economy. In their feature, Erdem and Tsatsaronis adopt a purely atheoretical, statistical approach and condense information from a broad array of financial variables into a few representative factors to see if they can be used to help in forecasts. Around 90 financial variables from four countries – Canada, Germany, the United Kingdom and the United States – is collected and then grouped into four categories: interest rates and spreads, asset prices; credit and debt aggregates, and indicators of performance for the banking system. “Our results show that, consistently across countries, financial factors do contain information about macroeconomic variables. This is most evident in the case of output,” they write. Interestingly, the authors find a weaker link between financial variables and inflation, suggesting that “economic processes that work through the financial sector may not influence economic activity through the inflation channel.” “This may weaken the information content of inflation as a guide to monetary policy when economic shocks originate in the financial sector,” they write.
The policy implication of a weak link between the financial sector and inflation is important because it means that central banks that narrowly focus on inflation may miss the impact of financial cycles on business cycles.
The global banking market expanded only marginally in the third quarter of 2012 – the smallest quarterly rise in 13 years – as lending to banks in the troubled euro area contracted further while credit extended to non-banks in the United States expanded, rising according to final quarterly data from the Bank for International Settlements (BIS).
Total cross-border claims by banks from 31 countries rose by only $33 billion, or 0.1 percent, slightly up from a $26 billion increase reported by BIS in January’s preliminary lending data.
The minor rise in international bank lending was driven by a $153 billion expansion, or 1.4 percent, in lending to non-banks, mainly in the United States, while lending to other banks, especially in the euro area, fell by $120 billion, or 0.7 percent, BIS said in its March quarterly review.
International bank lending to borrowers in advanced economies rebounded by $106 billion, the first rise after three consecutive quarterly declines, but this was mainly driven by a shift in lending to UK borrowers and away from euro area borrowers, illustrating the challenges facing the euro area.
In a sign of the global retrenchment of euro area banks, their lending to non-banks in the United States fell further. Euro area banks’ share of total foreign claims on the U.S. non-bank private sector fell to 26 percent at the end of September from a peak of 43 percent in end-June 2007, primarily reflecting lower lending by Dutch and German banks.
In contrast, the share of Japanese banks in the United States rose to 22 percent, up from 10 percent, in the same period, and that of Canadian banks rose to 14 percent from 6 percent, confirming figures that were also released in January.
Meanwhile, lending to borrowers in emerging economies contracted by $30 billion, or 0.9 percent, in the third quarter, with lending to banks down by $55 billion, especially in Asia-Pacific and Latin America.
A $47 billion decline in Asia-Pacific was driven by lower lending to banks in China and Korea, only the third quarterly decline to the booming region since 2009, BIS said.
Part of the explanation for the drop in bank lending comes from rapidly rising capital flows to emerging markets from private portfolios.
Private non-bank inflows into emerging economies have risen to $365 billion in 2012 from $155 billion in 2009 wile bank inflows fell to $147 billion from $154 billion in the same period.
A surge in activity in emerging markets’ corporate bond markets explain this shift, with demand for such bonds dominated by high net worth retail investors, BIS said.
Demand from institutional investors for international corporate bonds from emerging economies has remained relatively small, less than 10 percent compared to about 50 percent of the international sovereign bond market, but may rise thanks to greater activity by global money managers, BIS said.
The stock of corporate debt issued by financial and non-financial corporates from emerging economies totaled more than $1.6 trillion at the end of 2012, with Asian borrowers the largest issuers followed by Latin American firms.
By www.CentralBankNews.info Households worldwide have boosted their borrowing since the 1970s and in some countries, such as the United States and Australia, the total amount now exceeds that of companies, the Bank for International Settlements (BIS) said, introducing a new public database for total credit in 40 countries. The explosion in household borrowing is one example of what can be gleaned from the BIS’ new global database that fills a glaring void in economists’ understanding of the vital role of credit. While data on credit in the banking sector has been available, accurate data on credit to the non-financial sector, such as households and corporates, has been largely missing, one of the reasons that policy makers utterly failed to spot the warning signs from the build-up of private sector credit that preceded not only the 2088 financial crises, but most other crises that originate in the financial sector Up to now, data on lending from foreign lenders and non-banks, such as the unregulated yet massive shadow-banking sector, have also been lacking. To remedy this, statisticians from Swiss-based BIS – known as the central bankers’ bank – collaborated with 40 central banks from advanced and emerging economies to create a public database that includes total credit from all sources. The building blocks of the new data series are financial accounts, domestic bank credit and cross-border bank credit. “The new data cover much longer periods and many more countries than nearly all existing total credit series. On average, 45 years of quarterly data are available. For several countries, including Argentina, Germany, Italy and the United States, data start as early as the late 1940s/early 1950s,” BIS said in its latest quarterly review. In addition to the growth of household borrowing, the data shows how credit has substantially outgrown economic growth in nearly all countries. In the 1950s, total credit was around 50 percent of Gross Domestic Product in many advanced economies and then grew over the next 20-30 years and started to top 100 percent in the 1960s and 1970s. By the late 1980s, credit boomed in some countries, such as the United States and the United Kingdom. Other countries, like Germany and Canada, saw modest credit growth while Ireland is the extreme case: In 1995 it had a credit-to-GDP ratio of around 100 percent. Fifteen years later, the ratio peaked at 317 percent and hasn’t dropped much since. The explosion of credit with accompanying boom-bust episodes is hardly limited to advanced economies. In Thailand, for example, private sector borrowing rose from 12 percent of GDP in 1958 to 75 percent 30 years later, BIS said. “A rapid expansion in credit then followed that ended in the 1997 Asian crisis. Thailand’s credit-to-GDP ratio nearly halved over the subsequent 13 years, but started to increase again from 2010 onwards,” BIS said. In general, emerging economies have tracked advanced economies in increasing the level of household credit. In the 1990s, when data are first collected for emerging economies, household borrowing made up 10-20 percent of total credit. Now, it has risen to 30-60 percent, corresponding to the current levels of many advanced economies.
The impact of the Federal Reserve and Bank of England’s large-scale asset purchases in 2008 and 2009 on economic growth may be uncertain, but it is clear their intervention in the global crises helped fend off the risk of deflation, according to the Bank for International Settlements (BIS). The central banks’ unconventional policies of massive purchases of bonds and other securities – known as quantitative easing – has tripled and quadrupled their balance sheets and triggered fears of inflation and concern over how these programs will be unwound. In its latest quarterly review, BIS’ Boris Hofman and Feng Zhu analyse the impact on inflation expectations from the BOE and Fed asset purchase programs, from the announcement of the central bank’s plans to their implementation. As the financial crises spread following the collapse of Lehman Brothers in September 2008, inflation expectations plunged, raising the spectre of deflation. By mid-2009 these fears heightened as consumer prices dropped in both the U.S. and UK. But the announcement of the asset purchase programs on both sides of the Atlantic in late 2008 and early 2009 lead to a rapid reversal of inflation swap rates towards pre-crises levels in the course of 2009, the authors write. “This suggests that asset purchase programmes have made an important contribution to fending off deflation risks,” they wrote, adding that other factors, such as stimulus packages and low policy rates may also had an effect that were not captured by their analysis.
By www.CentralBankNews.info Global debt by households, governments and non-financial enterprises has mushroomed by some $30 trillion since 2007, but governments in advanced economies are not taking advantage of the flood of cheap money to carry out necessary structural reforms that will pay off over time, warned the BIS. Sharpening the Bank for International Settlement’s (BIS) frequent warnings about the danger of the seemingly endless appetite for debt, its economic adviser, Stephen Cecchetti, said he was concerned because buoyant financial markets have become disconnected from economic fundamentals and dependent on easy policy by central banks. While it is positive that central bank policies have reduced tail risks, especially in the euro area, loose fiscal and central bank policies are not a substitute for structural reform, and Cecchetti is sceptical about the effect of further policy easing as debt levels are high and continuing to grow. “Combining households, non-financial enterprises and government since 2007, global debt has risen a combined $30 trillion dollars, or roughly 40 percent of global GDP, “ Cecchetti told journalists in connection with the publication of BIS’ March quarterly review. “One reason to be sceptical about the efficacy of further monetary or fiscal easing is that debt levels are very high and continue to rise,” he said, adding: “It is telling that as asset prices are rallying and firms are issuing more debt, investment in the major advanced economies is not picking up.” Regardless of economic or political persuasion, it is clear that economic growth is driven by investment and this is financed through borrowing, either by governments or the private sector. But households are overburdened, firms are hoarding cash, and governments have reached their borrowing limits. No one wants to borrow more, nor should they, Cechetti said. With monetary and fiscal policies reaching their limits, Cecchetti appealed to policy makers to get busy with structural reform, such as addressing the time bomb in the pension and healthcare systems and reducing barriers to the reallocation of capital or workers across sectors. “Increasing public and private debt ever further until we are not able to fund it is not a substitute for these reforms,” he said.