By www.CentralBankNews.info Thailand’s central bank is worried over the rapid rise in the value of its bath currency and will take action – as yet unspecified – together with the Thai finance ministry when needed.
The Bank of Thailand (BOT) said the rise in the baht was “largely attributable to foreign investors’ confidence in the strength of the Thai economy” and this had spurred businesses into raising their productivity, the BOT said in a statement following a regular macroeconomic briefing of its Monetary Policy Committee where exchange rate developments were discussed.
However, the rise in the baht has also had a negative impact on Thai exporters, particularly small and medium-sized firms, the BOT said, adding that “despite the exchange rate appreciation, the committee expects the Thai economy to remain resilient.”
“The MPC expressed concern over recent volatility and rapid appreciation of the baht, which, at times, have not been justified by economic fundamentals,” the BOT said, adding:
“The committee therefore agreed on the need for a timely implementation of appropriate policy mix as warranted by circumstances, in close coordination with the Ministry of Finance and other agencies.
The Thai bath rose by close to 7 percent against the U.S. dollar early this year but then declined early last week following speculation in foreign exchange markets that the BOT would intervene.
Central Bank News Link List – Apr 30, 2013: UTCC expects Bank of Thailand policy rate cut
By www.CentralBankNews.info Here’s today’s Central Bank News link list, click through if you missed the previous link list. The list comprises news about central banks that is not covered by Central Bank News. The list is updated during the day with the latest developments so readers don’t miss any important news.
- UTCC expects (Bank of Thailand) policy rate cut (Bangkok Post)
- Euro-area 1.2% inflation adds pressure for ECB rate cut (Bloomberg)
- Swiss central bank post $11.95 billion 1Q profit (AP)
- BOK (Korea) freezes key rate in 4-3 vote: minutes (Yonhap)
- Buzz over 50-basis-point (India) rate cut grows louder (Business Standard)
- Decision on euro zone banks review within two months: Bundesbank (Reuters)
- Carstens says slower inflation may pave way to Mexico rate cut (Bloomberg)
- Singapore central bank says inflation could ease to 3-year low (malaysian insider)
- Flood of easy money putting this region (Southeast Asia) at risk (CNBC)
- Peru central bank loosens rules for loans in soles (Reuters)
- The Fed’s favorite measure of inflation continues to fall: QE is here to stay (Forbes)
- How Elvira Nabiullina can improve Russia’s central bank (Bloomberg view)
- Blaming Europe’s central bank (NYT)
- Special Report: Kuroda’s calculus – How the Bank of Japan staged its big bang (Reuters)
- Mozambique’s central bank lowers 2013 growth forecast to 7% (Bloomberg)
- German regulators oppose Fed rule on foreign bank oversight (Bloomberg)
- The Fed broadens its reach (Bloomberg view)
- www.CentralBankNews.info
Dollar Remains Under Pressure Due to Low Liquidity
EURUSD – The EURUSD Increases Above 1.3070
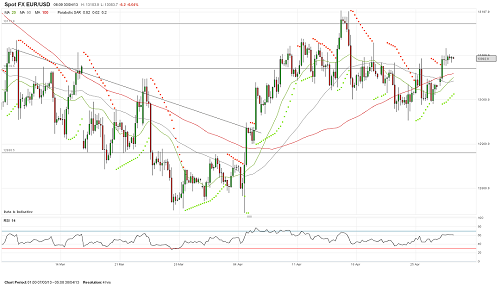
This time, the EURUSD has a good start of the new trading week: the rate has increased above the resistance at 1.3070 and reached the level of 1.3116. The 1.3070 level is the support level this time, and the pair have managed to stay above it so far – this is a positive technical factor for the euro. However, weak dynamics of the pair gives reason to doubt the bulls’ ability to develop the upward movement and overcome the resistance around 1.3170 level, thus it will confirm the uptrend development. The decrease below 1.3070-1.3040 would jeopardize the support around the 30th figure.
GBPUSD – GBPUSD: Support at 1.5485 Constrains the Bears’ Onslaught
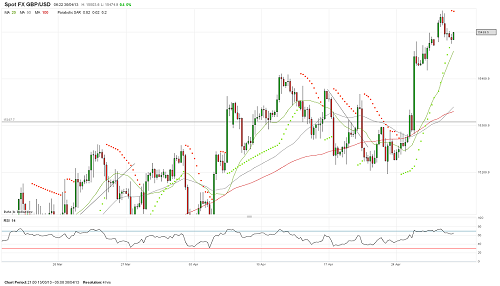
The GBPUSD was slightly appreciated yesterday and tested the 1.5545 level, then returned to its original positions near the level of 1.5485. This support continues to carry out its functions, not allowing the air bears drop below. Thus, the pair is trading above the 20-day MA. In addition, the 50-day MA crosses the 100-day MA, even though the Parabolic SAR was higher than the price chart, the GBPUSD may continue increasing. This will be contributed by the fact that the pair is trading above the 100-day MA on the daily chart. The drop below the 54th figure would worsen prospects of the GBPUSD pair.
USDCHF – The USDCHF May Drop to 0.9218
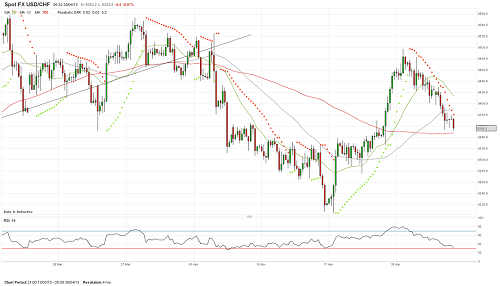
The U.S. dollar continued to lose ground against the Swiss franc, which led the pair to the 0.9350 support, enhanced by the 100-day MA. The Parabolic SAR has bee conveniently located above the price chart, the pair is not oversold, thus the bears may test the major support at 0.9218. In turn, the decrease below the 94th figure has worsened the pair’s outlook and the bulls need to return above 0.9400 this time – this will give them an opportunity to test the 95th figure again.
USDJPY – The USDJPY Keeps Trying to Develop a Downward Correction
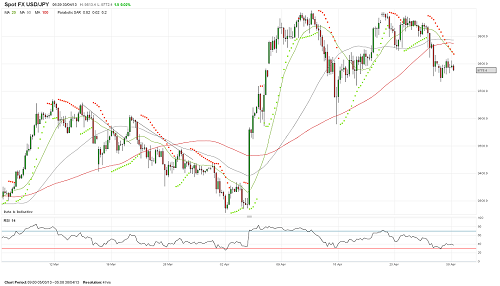
The USDJPY dropped to 97.35, then returned to the level of 98.20, which limited the growth efforts. The whole day and during the Asian session, the pair was trading between these levels, having entered a consolidation phase. The 20-day MA has confidently crossed the 50 and 100-day moving avareges, the Parabolic SAR is above the price chart, thus the downward correction seems quite possible to continue. However, the bears need to break below 97.35 to make their correction dreams come true. Then, they will be able to count on the reduction towards the 96th figure.
Gold’s Recovery “Appears to be Faltering”, But “Diminishing Expectations” for Early End to QE Ahead of Fed Meeting
London Gold Market Report
from Ben Traynor
BullionVault
Tuesday 30 April 2013, 07:15 EDT
FOLLOWING a dip during Asian trading, the gold price climbed back above $1470 per ounce Tuesday morning in London, broadly in line with where it was a day earlier, with China’s markets shut for this week’s Labor Day holiday.
Silver ended the morning in London around $24.40 an ounce, also little-changed from a day earlier, while other commodities and stock markets failed to hold onto gains from earlier in the day, while US Treasuries gained.
“Gold’s recovery appears to be faltering somewhat,” says this morning’s commodities note from Commerzbank.
“From a technical point of view,” adds ANZ head of global markets research Asia Tim Riddell, “although the rebound has been relatively solid, it appears to be a more sustained correction of the fall that we saw from late March, rather than a turn in trend. Really what we need to see is a series of closes above$1505 to take the pressure off.”
By Tuesday lunchtime in London gold looked set to record its biggest monthly loss in Dollar terms since December 2011, down nearly 8%, based on London Fix prices.
In Euro terms gold was headed for a 9.5% loss, the biggest since July 2010. In Sterling gold was down 9.6%, also the biggest monthly loss since July 2010, although an afternoon fix at £951 an ounce or below would make for the biggest monthly drop since October 1990.
Gold’s sharp price drop earlier this month “broke below the $300 range which prevailed from the highs in July 2011,” says technical analysts at Societe Generale.
“This confirmed a major double top which projects a target at $1265…the indicators are toppish and call for vigilance.”
Elsewhere at that bank however another SocGen strategist repeated a case for a $10,000 gold price last week.
Since the low of $1322 an ounce touched on April 16, gold has rallied more than 10% as the lower gold price has been met by strong demand for physical gold in many parts of the world, especially in the form of smaller bars, although “physical buying has slowed down” according to one Hong Kong dealer speaking to newswire Reuters Tuesday.
“The problem in the market is the tight physical supply,” the dealer said. “It will take time to refine the metal.”
“We are producing 24 hours a day,” says Frederic Panizzutti, global head of marketing and sales at Swiss bullion refiner MKS.
“[Strong demand for physical bullion] is all across the globe…the fact that premiums are so high, it means that no one is making enough.”
The US Mint meantime has sold 312,500 of American Eagle bullion gold coins so far this month, the biggest monthly total since June 2010.
By contrast, gold exchange traded funds tracked by Bloomberg continued to see outflows throughout April, losing 168.2 tonnes, the biggest monthly drop on record. By comparison, Barclays reported at the start of the month that gold ETFs saw outflows of around 154 tonnes for the whole of the first quarter of the year.
Of these, the world’s biggest gold exchange traded fund SPDR Gold Trust (GLD) has seen its holdings fall 11.5% this month to 1080 tonnes, the lowest since September 2009.
The recovery in the gold price has also been due to “the combined impact of a weaker Dollar and on market chatter that the Federal Open Market Committee meeting this week and the European Central Bank policy meeting will confirm ongoing monetary easing in the United States and Europe,” says a note from HSBC.
The note adds that HSBC’s currency analysts see diminishing expectations that the Fed will announce an early end to its ongoing quantitative easing asset purchases.
The FOMC begins its latest policy meeting today ahead of a decision tomorrow, while the ECB is due to make its latest policy announcement Thursday.
German unemployment rose by 4,000 this month, figures published Tuesday show, twice the consensus forecast among analysts, although the seasonally adjusted unemployment rate remained steady at 6.9%.
For the Eurozone as a whole meantime the unemployment rate ticked higher to 12.1% last month.
Elsewhere in Europe, Italy’s new prime minister Enrico Letta told parliament Monday that the country “will be lost” unless it adopts policies aimed at stimulating economic growth.
Gold value calculator | Buy gold online at live prices
Editor of Gold News, the analysis and investment research site from world-leading gold ownership service BullionVault, Ben Traynor was formerly editor of the Fleet Street Letter, the UK’s longest-running investment letter. A Cambridge economics graduate, he is a professional writer and editor with a specialist interest in monetary economics. Ben can be found on Google+
(c) BullionVault 2013
Please Note: This article is to inform your thinking, not lead it. Only you can decide the best place for your money, and any decision you make will put your money at risk. Information or data included here may have already been overtaken by events – and must be verified elsewhere – should you choose to act on it.
Here’s the Real Reason Why Stock Market Prices Go Up
Over the past couple of weeks we’d heard stories about the queues forming at bullion dealers.
Our old pal, Diggers & Drillers editor, Dr Alex Cowie had heard first hand from bullion dealers in Melbourne and Sydney about lines forming out the door and down corridors.
Anyway, being a cynical soul, we thought we’d check the scene out ourselves.
Bearing in mind that the last time we turned up at a bullion dealer four months ago, you could swing three cats tied head to tail and still not hit anyone, we were surprised at what we saw…
When we got there just before lunch there were four people ahead of us in the queue.
But by the time we left as the lunch crowd started filing in, there were 19 people waiting, with two others standing at the counter.
The queue was longer at the bullion dealer than it was at the Commonwealth Bank branch on Collins Street.
We certainly now believe the stories about queues the week before as gold slumped more than $200 in just a couple of days.
But we’re not here to talk to you about buying gold or silver bullion. As we mentioned last week, stop over-thinking it and just do it.
However, we do want to look at the impact higher volume has on markets, especially the stock market…
Why Volume Isn’t Important
Measuring stock market volume is different to measuring volume at a bullion dealer. For a start, you can’t go somewhere to see people queuing up in a corridor to buy BHP Billion [ASX: BHP] shares or Commonwealth Bank of Australia [ASX: CBA] shares.
But you can of course see the trading volume in another way. That’s by looking at stock charts.
However, the story isn’t straightforward.
For the most part, when you buy shares you’re buying them from someone who’s selling (obviously). They’re selling because they think the price will fall…or at least, won’t rise much.
In other words, the volume of buys going through the market exactly matches the volume of sells. That’s why looking at volume on its own isn’t always a useful indicator (Murray explains more on this in today’s Money Morning Premium).
In fact, if you crunch the numbers you’ll see very little difference between the volume and value traded two years ago to that traded over the past year.
Take Commonwealth Bank shares as an example. Over the past year, $63 billion-worth of CBA shares has changed hands while the share price soared 37%. In the previous year $64.6 billion changed hands while the shares fell 3.1%.
Or look at it another way.
Yesterday, $118.8 million-worth of Commonwealth Bank shares changed hands. Sounds like a lot right? It is, but not compared to CBA’s market capitalisation of $114 billion.
It means yesterday barely 0.1% of the company’s shares changed hands. And yet that small number of trades caused a 1% change in the share price.
That tells you on any given day, regardless of market conditions, or whether it’s a rising market or falling market, most investors prefer to do nothing. And it also tells you that you don’t need increased volume for share prices to rise.
So why do so many people look at trading volumes? Probably because they think more buyers mean higher prices.
But it doesn’t always work that way. Remember, the volume of bought shares has to equal the volume of sold shares.
Stocks to Rise on a Torrent of Optimism?
This is exactly why when we talk about a torrent of cash flooding into the market, we also talk about the need for investors to believe the economy is improving.
A torrent or volume spike on its own won’t be enough to push the market to the record level we predict for 2015. Short-term volume spikes rarely last long. But a torrent of cash and improved investor optimism…well, that’s a different story.
In short, if investors believe the economy will recover and markets deserve to go higher, then investors will pay and demand higher prices, regardless of the volume traded. That is the real key to the market rising further.
Cheers,
Kris
Join me on Google+
PS. Most novice traders look at two things on stock charts — price and volume. Unfortunately, only one of those is worth looking at. In today’s Money Morning Premium I asked technical trading guru Murray Dawes for his thoughts on trading volume. He told me ‘I would never use it alone as a reason to trade.’ But there is one occasion when he would use it. Click here to upgrade now.
From the Port Phillip Publishing Library
Special Report: TORRENT SIGNAL 3
Daily Reckoning: Australian Deficit: Where Did the Money Go?
Money Morning: How the Rich make Money from the Stock Market
Pursuit of Happiness: Is There More to Life Than Money and Investing?
Australian Small-Cap Investigator:
How to Make Monehttp://www.moneymorning.com.au/?p=26083&preview=truey From Small-Cap Stocks
EURUSD breaks above channel resistance
EURUSD breaks above the resistance of the upper line of the price channel on 4-hour chart, suggesting that the downtrend from 1.3201 had completed at 1.2955 already. Further rise to test 1.3201 resistance could be expected, a break above this level will signal resumption of the uptrend from 1.2747, then next target would be at 1.3500 zone. Support is at 1.3020, only break below this level could trigger another fall to 1.2900 area.
Emerging Markets Should Beware Japan
A few weeks ago, Russell Napier of CLSA suggested to me that the weak yen might at some point trigger an emerging markets currency crisis.
Last week, a note came through from Albert Edwards at Soc Gen suggesting much the same thing. Both are famous bears but both have also had good records of spotting the dangers other market participants prefer to close their eyes to…
It is also worth remembering, as Albert points out, that ‘yen weakness was one of the immediate causes of the 1997 Asian currency crisis and Asia’s subsequent economic collapse.’
Then a weakening yen and rising dollar put pressure on the many countries in Asia that in one way or another pegged their currencies to the dollar (their exports became less competitive relative to Japanese exports as the yen fell and the dollar rose).
That, along with a variety of other factors (this is one of the things academics have on their ‘argue about forever’ lists) led to devaluations across the board (starting with Thailand) and in turn put huge stresses on the many banks (and other companies) in Asia that held debt in dollars (in local currency terms their debts soared). It also meant hefty imported inflation — as currencies weakened, import prices rose.
Could it Happen Again?
The Japanese yen has certainly weakened and looks set to weaken significantly more: most people are convinced that the Bank of Japan is really committed to its 2% inflation target and it is perfectly possible that it will lose control and massively overshoot 2%.
Albert expects ‘accelerating QE [quantitative easing] to undermine the yen further and the market to anticipate this.’ Note that Japan’s big insurers have begun to suggest that they will be upping their foreign bond holdings from now on (so selling yen in the process).
So who gets hurt as a result of this? As many have pointed out, things have changed since the 1990s. China rather than Japan is now the world’s second largest economy and there ‘has been a dispersion of supply chains across different countries in Asia that complicates the issue of relative currency competitiveness.’
At the same time, currencies are not pegged to the dollar as they once were. You might also think that Asian countries’ high levels of foreign exchange (FX) reserves will allow them to protect their currencies if needs be (they use the reserves to buy their own currency, upping demand and preventing falls).
But Albert isn’t having any of this. ‘High levels of FX reserves are no protection,’ he says. ‘If they are sold to prop up Asian currencies, this will only impart a further deflationary monetary squeeze. Boom will turn to bust.’
And ‘when I see a sharp rise in China’s real exchange rate (up 10% in the last two years) and a deteriorating balance of payments, it rings alarm bells. China is not the most vulnerable of the emerging-market currencies to the weak yen, but this conjunction could easily trigger a currency crisis if growth is crushed.’
Albert doesn’t say which he thinks is the most vulnerable, but it is probably fair to say that the South Koreans aren’t exactly thrilled by what they call its potential ‘unintended negative side effects’.
Merryn Somerset Webb
Contributing Editor, Money Morning
Publisher’s Note: This article originally appeared in MoneyWeek
From the Archives…
The Market Rebounds, but We’re Still Not Selling…
26-04-2013 – Kris Sayce
Is This the Last Hurrah for the Australian Dollar?
25-04-2013 – Murray Dawes
Here’s Proof the Silver Bullion Market is Alive and Well
24-04-2013 – Dr. Alex Cowie
Stand By for the Recession Rally in Resource Stocks: Take Two
23-04-2013 – Dr. Alex Cowie
A New Take on Hard Asset Investing
22-04-2013 – Kris Sayce
ABN Amro Predicts Gold Price Collapse
ABN Amro, the Dutch state-owned banking giant, recently revised its global macro and gold outlook, forecasting a $1,300 gold price by the end of this year.
Moreover, the bank forecasts $1,000 gold by December 2014, and $800 gold in 2015. Why?
‘The authorities — especially in Europe — have acted to reduce systemic risks and inflation is going down rather than up. . . Other assets will become increasingly more attractive as the growth outlook improves.’
Wait, hang on; they lost me with the ‘all is well in Europe’ argument.
Across the continent, the dominoes are falling far faster than Angela Merkel, the European Central Bank, and even the IMF can stand them back up again.
Slovenia is now in need of a banking sector bailout. Even according to the OECD’s latest economic survey of the country, ‘Slovenia is facing a severe banking crisis’.
This, amid continually rising debts and record high unemployment in the region.
To put this in context, the number of unemployed in Spain now exceeds the entire population of Madrid…representing about 13% of the entire Spanish population and 27% of the nation’s workforce.
ABN Amro’s reports go on:
‘Systemic risks to the financial system and the global economy have declined notably, despite the bailout of Cyprus.’
Er, ‘despite the bailout of Cyprus…’ You mean the one involving outright confiscation of people’s money? The one where the Russians wagged their fingers at the EU for acting like the Soviet Union?
Sure, despite the bailout of Cyprus, everything’s dandy. And other than that, Mrs. Lincoln, how did you enjoy the show?
ABN continues: ‘Another blow [to the gold price] will come when the Fed’s first rate hike (that we expect in early 2015) comes into view.’
USA Still on the Road to Bankruptcy
Now, bear in mind that US debt already exceeds 100% of GDP.
Even using the US government’s own ridiculous budget projections (which assume 3.5% REAL GDP growth) Uncle Sam will still accumulate over $5 trillion in debt over the next decade.
But here’s the thing — the current $16.75 trillion of US debt has an average maturity of just 65 months. This means that the US government will be on the hook to repay a huge chunk of its debt within the next 5 1/2 years.
So in addition to issuing $5 trillion (optimistically) in new debt, they’ll also have to re-issue trillions more in existing debt.
Someone is going to have to mop up all that debt. The question is…who?
The Chinese are actually REDUCING their Treasury exposure as a percentage of total US debt (see chart). This is consistent with their objective to strengthen the renminbi.

The story is the same with Japan at the moment, whose nominal US debt holdings have actually been decreasing.
The US Social Security trust fund is also a major holder of US debt. Yet, according to the Washington Post, roughly 10,000 people EACH DAY become eligible to receive Social Security pension benefits.
Given the increased outflows and high level of US unemployment (fewer people paying into the system), it’s doubtful that the Social Security trust fund will have sufficient cash to bail out the Federal government.
This leaves the US Federal Reserve as the lone player to mop up all this debt. There simply are no other options; the US government will default in all likelihood, unless the Fed continues debauching the currency to buy Treasuries.
This will drive even more money into real assets, pushing prices higher…especially gold.
Simon Black
Contributing Editor, Money Morning
Publisher’s Note: This article originally appeared in Sovereign Man: Notes from the Field
From the Archives…
The Market Rebounds, but We’re Still Not Selling…
26-04-2013 – Kris Sayce
Is This the Last Hurrah for the Australian Dollar?
25-04-2013 – Murray Dawes
Here’s Proof the Silver Bullion Market is Alive and Well
24-04-2013 – Dr. Alex Cowie
Stand By for the Recession Rally in Resource Stocks: Take Two
23-04-2013 – Dr. Alex Cowie
A New Take on Hard Asset Investing
22-04-2013 – Kris Sayce
Euro climbs vs US Dollar in Forex Trading, EURUSD highest close in almost 2 weeks
By CountingPips.com
The Euro rose today against the US Dollar in forex trading action following up an increase on Friday. The EUR/USD pair peaked over the 1.3100 exchange rate today before retreating to just around the 1.3100 level at the close of the New York trading session at 5pm EST. Today’s close was the highest closing price since April 16th when prices ended the day at approximately 1.3176.
The levels at 1.3100/1.3125 present resistance obstacles to the upside. Piercing these levels would bring a retest of 1.3200 that provided resistance twice recently on April 16th and April 17th. Below looms the major level at 1.3000 which would likely bring a base of support.
Will the Euro be able to maintain its strength?
The European Central Bank interest rate meeting is coming this week on Thursday and there is market speculation of a potential rate cut. A rate reduction could very well sap any upside energy for the euro and perhaps we see a retest of 1.3000 level. But there are two more trading days before then and we can only wait and see how it plays out.
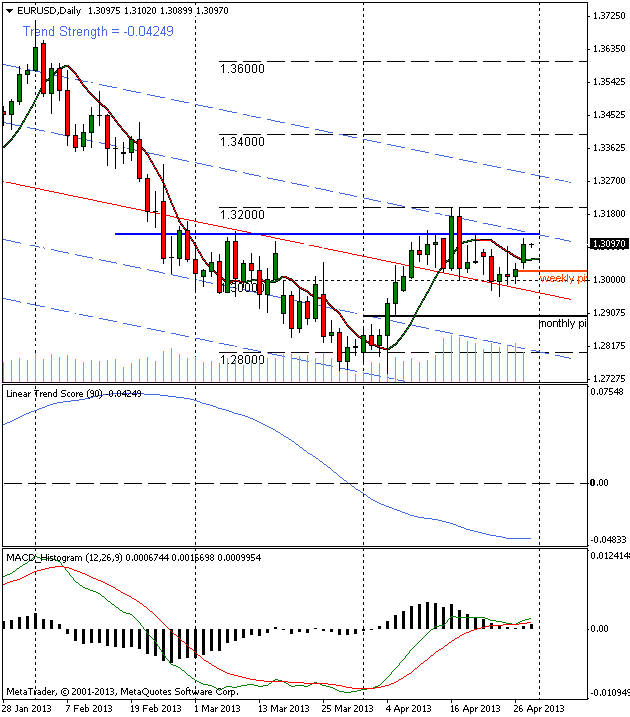
Pivots and Trends Data:
Weekly Pivot Point: 1.30310
Monthly Pivot Point: 1.28883
Linear Regression Indicator Trend / Strength Data:
30-day current trend is BULLISH / Trend strength of 297.8 pips
60-day current trend is BEARISH / Trend strength of -121.2 pips
90-day current trend is BEARISH / Trend strength of -570.1 pips
180-day current trend is BULLISH / Trend strength of 171.3 pips
365-day current trend is BULLISH / Trend strength of 373.3 pips
Happy Trading!
Article by CountingPips Forex Blog, News & Analysis
Angola holds key rate steady, cuts liquidity rate 25 bps
By www.CentralBankNews.info Angola’s central bank kept its main policy rate, the BNA rate, steady at 10 percent but cut the rate on its standing liquidity absorption facility to 1.0 percent from 1.25 percent.
The National Bank of Angola (BNA), which last cut its BNA rate by 25 basis points in January after a similar cut in 2012, did not give a reason for cutting the standing liquidity rate.
Angola’s inflation rate rose slightly to 9.11 percent in March from 9.04 percent in February with the largest price change seen in the category for food and non-alcoholic beverages, rising by 0.84 percent in the month and accounting for 58.24 percent of the change in the overall inflation rate.
The BNA said credit to the economy rose by 1.34 percent, the average exchange rate of the Kwanza to the U.S. dollar was stable at 95.98 at the end March while the central bank sold $1,445 million of foreign exchange to the market during March for a total $4,252 million in the first quarter of 2013.