By www.CentralBankNews.info Colombia’s central bank held its benchmark interest rate steady at 3.25 percent, as expected, and will continue to buy foreign exchange worth at least $2.5 billion from June to September to keep the peso from rising.
The Central Bank of Colombia said the peso, like other currencies in Latin America, has depreciated against the U.S. dollar, either due to lower international prices of basic goods or because investors are speculating that the U.S. Federal Reserve will be being to reduce its asset purchase program.
“The interventions of the Central Bank in the local exchange market, as well as measures taken by the government, have reinforced the trend towards depreciation of the peso,” the central bank said.
In January Colombia’s central bank said it would spend at least of $3 billion between February and May, with daily purchases of not less than $30 million, to buy foreign exchange to hold down the peso.
The peso has eased some 7 percent against the U.S. dollar this year and continued to drop after news the central bank would continue to intervene, helping reverse a 10 percent rise in 2012.
The central bank said second quarter economic growth should improve from the first quarter – estimated at less than 3.0 percent – with consumer confidence improving significantly as previous rate cuts are being transmitted to lower nominal interest rates which has stopped the fall in credit.
Colombia’s central bank has held rates steady since March after cutting the benchmark rate by 200 basis points since July 2012.
Economic growth is expected to rise throughout this year as spending continues to react to earlier rate cuts and the government’s $2.7 billion stimulus program from last month.
Exports, however, are expected to rise slower than previously estimated due to slower growth in emerging markets, the central bank said.
The central bank’s staff has kept its 2013 growth forecast at 3.0-5.0 percent, with 4.3 percent growth the most likely outcome. In 2012 Colombia’s economy grew by 4.0 percent, down from 2011’s 6.6 percent.
The latest official data show that Colombia’s Gross Domestic Product expanded by 1.8 percent in fourth quarter, sharply up from the third quarter’s 0.7 percent contraction, for annual growth of 3.1 percent, up from 2.7 percent.
Inflation in Colombia rose slightly to 2.02 percent in April from 1.91 percent but the central bank said core inflation showed no significant change and both measures were below the central bank’s 3.0 percent target. It is highly likely that inflation will remain around the target range of 2-4 percent.
The bank said the probability was hight that inflation would remain in the target range.
Zambia raises rate 25 bps on risks to 2013 inflation target
By www.CentralBankNews.info Zambia’s central bank raised its policy rate by 25 basis points to 9.5 percent, saying inflationary pressures “would be threat to the achievement of end-year inflation target of 6.0%.”
The Bank of Zambia, which raised rates by 25 basis points in 2012, said in April that it expected inflationary pressures to continue to moderate in the month of April.
Inflation rose to 7.0 percent in April from 6.5 percent in March and the central bank said it was anticipating upward risks to inflation in June due to recent increases in the pump price of fuel coupled with the lagged effects of the recent exchange rate depreciation.
These pressures will be moderated by the relative stable prices of food due to a positive food balance as indicated in recent crop forecast surveys, the bank said.
Zambia’s average inflation rate in 2012 was 6.6 percent, according to the International Monetary Fund, which forecasts a decline to 6.5 percent this year.
Fiji holds rate steady, growth still on track to hit forecast
By www.CentralBankNews.info Fiji’s central bank held its benchmark Overnight Policy Rate (OPR) steady at 0.5 percent as domestic economic activity remained mixed and inflation tumbled to its lowest level since May 2009.
The Reserve Bank of Fiji, which has maintained an accommodative policy stance and unchanged rates since December 2011, said the economy remains on target to reach a projected 2.7 percent growth in 2013. The International Monetary Fund put Fiji’s 2012 growth at 2.1 percent.
Fiji’s inflation rate fell to 1.0 percent in April from 3.3 percent in March. Separately, the central bank governor was quoted as saying in local media that inflationary pressures were expected to remain subdued and inflation to settle around 3.0 percent by year-end.
Consumption continues to trend upward, financed by strong growth in private credit and higher inward remittances, and new bank loans for investment purposes more than doubled to $39.5 million in the year to April, underpinned by loans to the building and construction sector.
However, gold production and visitor arrivals were weak, with annual gold production down by 41 percent in the year to March due to the low quality of ore, and in January visitor arrivals fell 7.9 percent due to the impact of Cyclone Evan, the bank said in its latest economic review.
In Fiji’s financial sector broad money (M3) rose by an annual 7.6 percent in April due to growth in domestic credit, and outstanding loans by commercial banks rose by 12.7 percent on higher lending.
In the year to April, the Fiji dollar rose 21.3 percent against the Japanese yen and the Fiji dollar’s nominal effective exchange rate (NEER) rose by a monthly 0.2 percent, implying a slight appreciation against major trading partners. However, the real effective exchange rate (REER) fell by 0.2 percent during the month of April due to lower domestic inflation.
By May 30, Fiji’s foreign exchange reserves stood at $1,603 million, sufficient to cover 4.6 months of imports, up from 4.2 months as of April 26.
Gold Slips from 2-Week High, Chinese “Frenzy Won’t Continue” as Japan Fails to Shake Deflation
London Gold Market Report
from Adrian Ash
BullionVault
Fri 31 May, 08:15 EST
The PRICE of gold slipped from a new 2-week high in London trade Friday morning, nearing the weekend 2.9% above last week’s finish, but losing more than 4.6% from the start of May.
Silver also edged lower, cutting its weekly gain to 0.3% and standing 7.6% lower for the month.
European stock markets meantime extended this week’s drop, but held onto better than 5% gains for May.
“The kind of frenzied gold buying in late April and early May won’t be repeated,” said Zhang Bingnan, secretary-general of the China Gold Association, overnight to Bloomberg.
Zhang’s comments came as market-development group the World Gold Council forecast record quarterly gold demand amongst Asian households for April to July.
Gold prices in India – the world’s heaviest gold-buying nation – this week slipped back to $4 over international benchmarks from $20 per ounce a fortnight ago, Reuters reports.
Gold gifts will be given to some 6.6 million Chinese brides in 2013, the China Gold Association says. But bargain-hunting to acquire that jewelry may have accounted for a large part of April’s surge in demand, sparked by a 15% drop in world gold prices, Zhang believes.
China’s gold imports through Hong Kong had already doubled to record monthly levels in March, however.
Here in London, gold dealing volumes through the largest bullion banks – centre of the world’s wholesale gold trade – rose 10% by weight in April to hit a 20-month high, trade body the London Bullion Market Association said in new data Thursday.
Silver volumes rose 25% to the highest level in 16 months. Trade in both metals rose much less sharply by value, however, growing 3.1% and 9.2% respectively.
“[Gold’s] ability to hold above $1410 on a close basis removes some of the bearish pressure,” says the latest technical analysis from Scotia Mocatta bank.
“Support now seen at $1394 with resistance at $1425.”
“[Thursday’s] renewed price slide on the Nikkei,” says Germany’s Commerzbank, “has made it clear once more that the latest boom on the equity markets is no one-way street.
“This evidently makes gold more attractive in the eyes of some market players, as is also evidenced by lower E.T.F. outflows.”
After rising for the first time in 3 weeks on Wednesday, gold bullion holdings were unchanged Thursday for the world’s largest exchange-traded gold trust fund, the SPDR (ticker: GLD).
Japan’s Nikkei stock index bounced Friday from its second slump in a week, but still ended the month 13% below mid-May’s new 5-year highs.
New data meantime showed Japan’s industrial production beating analyst forecasts with 1.7% annual growth in April.
Despite aggressive new money-creation by the Bank of Japan’s quantitative easing program, however, consumer prices continued to fall, down 0.4% last month from March for the sixth consecutive month of deflation.
“The short-term trend [in gold prices] seems to be higher for the moment,” says the latest note from brokers INTL FC Stone.
“[But] we think gold prices will be lower by year-end…considering that by then, the US Fed should give the markets more clarity as to when it is going to step back [from quantitative easing] if it hasn’t done so already.”
“Based on what the Fed is doing now,” said Anthony Scaramucci, partner at the $7.6 billion SkyBridge Capital asset managers, to CNBC yesterday, “giving us more transparency, I’m not a buyer of gold here.”
“Inflation is going to hit at some point. But it’s pretty far out based on macro econometric estimates.”
Gold price chart, no delay | Buy gold online
Adrian Ash is head of research at BullionVault, the secure, low-cost gold and silver market for private investors online, where you can buy gold and silver in Zurich, Switzerland for just 0.5% commission.
(c) BullionVault 2013
Please Note: This article is to inform your thinking, not lead it. Only you can decide the best place for your money, and any decision you make will put your money at risk. Information or data included here may have already been overtaken by events – and must be verified elsewhere – should you choose to act on it.
Restaurant and Bar Sales Up: How to Invest
Great Recession? What Great Recession?
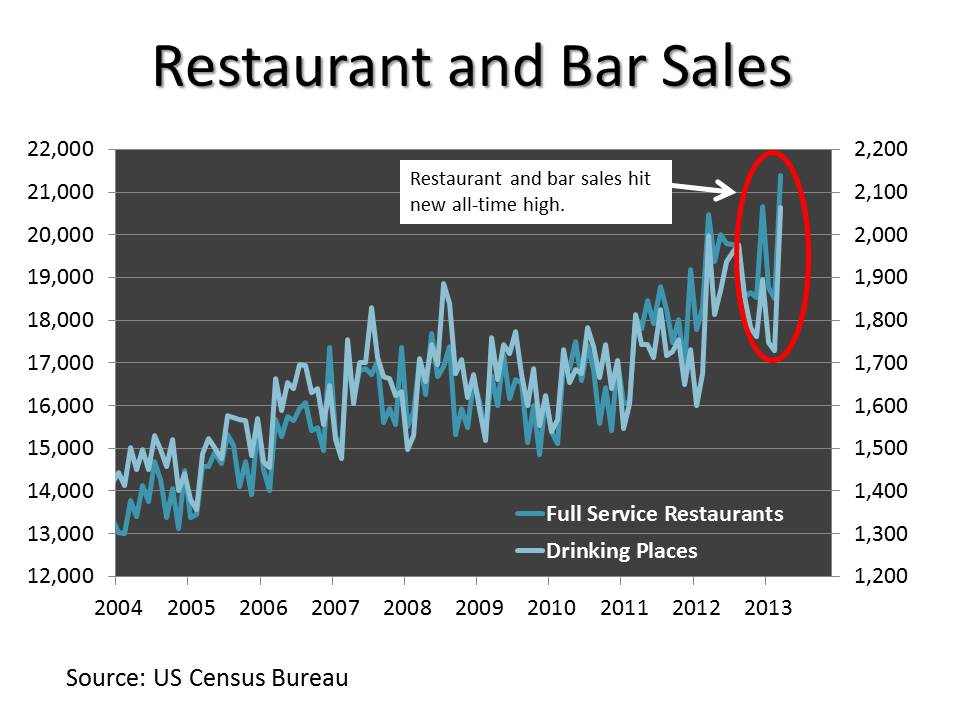
After flatlining for five years, restaurant and bar sales hit new all-time highs earlier this month (see chart). It would seem that the scrimping and ramen noodle eating that became so common after the 2008 meltdown is now a distant memory.
Well, sort of. There are a couple things to keep in mind. To start, the sales data do not take into account inflation, which, while modest, makes the recent gains a little less spectacular than they look. And Americans haven’t exactly returned to their free spending ways; according to the National Restaurant Association, 49 percent of American adults do not eat in restaurants as often as they would like.
There is also a demographic angle at work. 20-somethings are splurging more on meals and booze, but nearly half of the 50-64 age bracket—which roughly corresponds to America’s Baby Boomers—are spending less and consider the lower spending to be their “new normal.”
For anyone with an academic interest in demographics (yes, there are some of us who do), this is precisely what you would expect. The Baby Boomers are saving for a retirement that most are not prepared for. And even under more normal economic conditions, spending on food and alcohol in restaurants and bars tends to peak in the mid-50s. I appears that, once the kids leave the nest, Americans like to enjoy one last hurrah of feasting and boozing before they settle down.
Meanwhile, while unemployment is still high among the young, most are employed and earning more than at any time in their lives. Most 20-somethings are also childless, meaning that a larger percentage of their incomes are disposable.
And importantly, this large generation—alternatively called Gen Y, the Echo Boomers, or the Millennials—has a lot of spending left to do. The largest cohort is still in their early 20s.
So, with all of this said, how do we profit?
I’ve been a fan of alcoholic beverage stocks for years, and Heineken ($HEINY) and Diageo ($DEO) are both long-time portfolio holdings. But these are primarily “emerging market lite” plays, as both have better prospects in the developing world than in North America.
What about restaurant stocks?
I’ve had several restaurant and casual dining stocks on my watch list with the Echo Boomers in mind. The problem is that while I might loves some of the companies, I’m not too fond of the stocks.
Consider Chipotle Mexican Grill ($CMG). It’s a compelling story backed by strong, secular trends: the move towards healthier and more organic eating and the convergence between fast food and casual dining. And frankly, I could eat there every day and never get tired of it.
There is one big problem: while Chipotle’s burritos are reasonably priced, its stock isn’t. It currently trades for nearly 30 times expected earnings and 4 times sales.
Buffalo Wild Wings Inc. ($BWLD), another trendy casual dining stock, is likewise a little too pricey for my liking. It trades for over 20 times expected earnings. Panera ($PNRA) isn’t any cheaper. It trades for 24 times expected earnings. None of these three pay a dividend.
Moving up the price ladder, we get to Darden Restaurants ($DRI), the owner of the Olive Garden, Red Lobster, and Longhorn Steakhouse among others and Brinker International ($EAT), the owner of Chili’s and Maggiano’ Little Italy. Brinker has had a decent run, up about 60% over the past two years, compared to around 20% for the S&P 500. Darden has lagged and is flat for the period.
Brinker and Darden are not sexy. They epitomize the American suburbs, which is about as anti-sexy as you can get when it comes to a night out. These restaurants are also the restaurants frequented by the Baby Boomers when they were raising their kids. Those same Boomers are now past that stage, and their children are not yet in it themselves.
So, we can’t expect a huge surge in revenues tomorrow. However, with the American housing market recovering and with the Echo Boomers reaching the marriage and family formation stages of their lives, there is a long-term, 10-15-year story here.
Brinker is not particularly overpriced at 14 times expected earnings and pays a 2% dividend. But Darden would seem to be the more attractive of the two. It’s slightly more expensive at 16 times earnings, but it pays a nice 3.7% dividend. Importantly, the company has been growing that dividend aggressively since 2008.
Darden isn’t a homerun stock, but it should be a nice income producer with the potential for decent growth in the years ahead as the Echo Boomers settle down and move to the ‘burbs.
Sizemore Capital is long HEINY and DEO. This article first appeared on InvestorPlace.
Is the Bull Market In REITs and MLPs Over?
Over the past 10 days, a period where the S&P 500 has traded sideways, REITs and MLPs are down 8% and 6%, respectively, as measured by the Vanguard REIT ETF ($VNQ) and the JP Morgan Alerian MLP ETN ($AMJ).
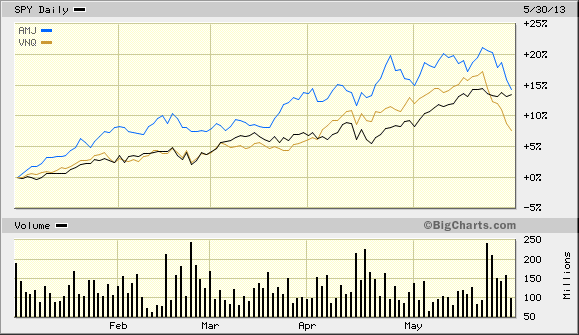
Individual REITs and MLPs got hit harder. The popular Realty Income ($O) and Martin Midstream ($MMLP) were down 15% and 10%, respectively.
Ouch.
All of these securities have one thing in common: they have become extremely popular with yield-starved income investors in recent years. And the Fed’s recent pronouncements—which indicate that quantitative easing may be ending sooner than expected—slammed them in response.
So is that it? With rates now destined to rise, is the bull market in income-focused securities over?
Not so fast. To start, it is not entirely certain that interest rates will materially rise. Sure, we probably won’t see the 10-year note at 1.5% again (or mortgages at 3.3%). But as the experience of Japan has proven, rates can stay much lower for much longer than anyone expects during a prolonged period of deleveraging and aging demographics.
The U.S. is not Japan, of course. But we have a supply/demand mismatch in the fixed income market. Supply of fixed income from government and private-sector borrowers has not kept up with demand for fixed income by retiring Baby Boomers. Putting it another way, there is a surplus of investable funds out there, and that surplus means that the price of money—i.e. interest rates—will likely stay low irrespective of what the Fed does.
In other words, don’t expect to see 4-5% Treasury note yields any time soon.
But beyond this, even if yields do rise modestly, a well-bought portfolio of REITs and MLPs can offer something that a standard bond portfolio cannot: an income stream that rises over time. With demand for pipeline infrastructure charging ahead and with the U.S. commercial real estate markets continuing to improve, the fundamentals of REITs and MLPs as a group are strong and looking to get stronger.
That said, investors had gotten a little carried away this year. Realty Income and Martin Midstream had been up by as much as 35% and 45%, respectively, since January 1. They needed a correction…and they got it.
Where do we go from here?
I continue to like both REITs and MLPs as asset classes for the next 5-7 years. But it’s never good trading advice to try to catch a falling knife. I would recommend averaging into your favorite REIT and MLP shares on any additional weakness. You don’t have to buy your entire target allocation in one trade; buy on dips to enjoy a lower cost basis and plan on holding for a while.
If I’m wrong—very wrong—and inflation goes through the roof in the years ahead, REITs and MLPs will take a hit, at least initially. But both also have a degree of built-in inflation protection in that real estate and pipeline assets should hold their value in real terms even while the debts used to finance them get inflated away.
Disclosures: Sizemore Capital is long O, MMLP, AMJ and VNQ. This article first appeared on TraderPlanet.
SUBSCRIBE to Sizemore Insights via e-mail today.
Central Bank News Link List – May 31, 2013: Brazil’s central bank in ‘in a process’ of combating inflation – report
Here’s today’s Central Bank News’ link list, click through if you missed the previous link list. The list comprises news about central banks that is not covered by Central Bank News. The list is updated during the day with the latest developments so readers don’t miss any important news.
- Brazil’s central bank in ‘in a process’ of combating inflation – report (Dow Jones)
- IMF deputy chief expresses hope for Japan’s economic growth strategy (Kyodo)
- Bank of Korea governor fears Fed tightening (WSJ)
- Hungary central bank mull signal on criteria for end of easing (Bloomberg)
- Fed off’l calls for broadening stress-tests, enhancing fin info (MNI)
- Swedish banks need to double mortgage risk weights, IMF says (Bloomberg)
- Bank of Russia head says Ulyukayev hasn’t filed resignation (Dow Jones)
- www.CentralBankNews.info
U.S GDP First quarter revised slightly lower
According to the data released from the Commerce Department, the data shown prove that the U.S economy grew an annual rate of 2.4% in the first three months of the year.
On Thursday, The department’s Bureau of Economic Analysis said that the figures were slightly slower than the 2.5% rate predicted for the quarter to 24%. Although the consumer spending were stronger than expected. Some of the other reports released on Thursday were the increased in the jobless claims in the past week and the positive signs of recovery in the housing market.
The reports showed that the economy was getting stronger regardless of its major financial drag according to Ellen Zentner, an analyst from Nomura Securities International. “The GDP data continue to paint the picture of an economy with strengthening fundamentals that is facing significant fiscal drag,” she said.
The Organisation for Economic Co-operation and Development (OECD) lowered its predictions for the global growth to 3.1% this year and 4% in 2014. Major of the U.S. trading partners are predicted to remain in recession for the rest of the year.
The reports show that the consumers might have been encouraged by the decrease of the unemployment rate. Over 200,000 jobs have been added to the jobs market.
The government’s spending fell to a 4.9% annual rate compared to the initial predication of 4.1% .Businesses bought less and growing at a slower pace. Analysts are predicting a slower growth in the next three months.
The post U.S GDP First quarter revised slightly lower appeared first on | HY Markets Official blog.
Article provided by HY Markets Forex Blog
Italy’s unemployment rate reaches all-time high
The unemployment rate in Italy reached an unexpected all-time high in the first quarter, according to the National institute of statistics reports released on Friday. Increased from the previous quarter of 11.4%, unemployment rate stood to an unexpected 11.9% as it picked up to 12.0% in April month-on-month.
Joblessness (ITMUURS) increased by 12 percent after March reading was revised up from 11.5 percent to 11.9 percent ,according to reports from the national statistics office lstat.
Italy’s recession will continue through the year and the economy will contract 1.8 percent in 2013 as the effects of the economic tightening and credit conditions will hold down the economic activity, the Organistation for Economic Co-operation and Development (OECD) .
Employment rate are expected to fall, as cutting household budgets and spending. According to OECD, part of the cause of the quick rise of the unemployment rate back in 2012, was due to the increase in the labor force.
Last year, Italy’s gross domestic product (GDP) went down by 2.4 percent and the European Commission (EC) expects the economy should contract 1.3 this year. Public debt-to-GDP ratio is expected to reach 132.2% of GDP by 2014, EC data also showed.
Italy’s Prime Minister Enrico Letta said that employment will be the top priority of his government. The unemployment rate between the age range of 15 to 24 rose to 40.5 percent in April.
The post Italy’s unemployment rate reaches all-time high appeared first on | HY Markets Official blog.
Article provided by HY Markets Forex Blog
Friday Charts: Crooked Politicians, “Redneck Intelligence” and Stock Market Seasonality
It’s Friday in the Wall Street Daily Nation!
That means the long-winded analysis is out. (Hallelujah!)
And some carefully selected charts are in. (Amen!)
So without further ado, check out these snapshots of the big thorn stuck in small business’ side… a “sell in May” update… and, as I promised yesterday, one of my favorite stocks to own during this economic recovery.
Move Government, Get Out the Way!
I’ve featured the NFIB Small Business Optimism Index here before.
So what does the latest reading tell us? In short, Washington is still a major problem.

The number of businesses citing poor sales as their biggest concern keeps falling. But the number of those that blame taxes and government red tape keeps climbing.
In fact, 44% of small business owners rank these two factors as their biggest problems. Mind you, that’s almost double the low hit in September 2008.
Maybe President Reagan was on to something when he warned: “The nine most terrifying words in the English language are: ‘I’m from the government and I’m here to help.’”
Let’s all do our part to help Washington get the message.
Copy and paste this chart into an email to your elected representatives with a simple message (from the wise words of Ludacris): “Get out the way!”
Sell in May? Nope! How About June?
I hate to say “I told you so.” But… I told you so!
On May 1, I warned: “Selling in May and going away is not all it’s cracked up to be.”
And sure enough, the market kept on rallying. As I write, the S&P 500 Index and Dow are both up about 3%, while the Nasdaq is up about 4%.
So what’s in store for June? A little gloom – that is, if history is a reliable guide.

Although the Dow averaged a gain of 0.37% in June over the last 100 years, it’s only delivered positive returns 48% of the time, according to Bespoke Investment Group.
If we focus on the last 50 and 20 years, the average performance is even weaker. The Dow actually averaged declines of 0.37% and 0.76%, respectively. And it only posted positive returns 46% and 40% of the time.
Now, if that has you thinking about ditching stocks to sidestep the potential selloff, might I suggest an alternative?
For instance, a stock that’s uniquely positioned to buck the trend…
You Might Be a Redneck If…
If you live anywhere in the South, you might be accused of being a redneck if you own a pickup truck. (I know, because it’s happened to me.) Chances are, though, that you’re a small business owner, too.
As I’ve noted before, small business owners account for a large portion of pickup sales, particularly Ford (F) F-Series trucks. That means, by gauging sales of F-Series trucks, we can track the health of the economy.
And there’s no mistaking the underlying trend…

Year-to-date through April, Ford has sold just as many F-150 trucks as it did right before the recession hit. And there’s more road ahead.
So much so, that Ford is planning to boost North American production to meet the demand.
Tack on the fact that sales in Europe are bottoming out, and Ford is certainly in store for an earnings boost.
My conservative estimate calls for the company to earn $2 per share in 2014, which would represent a 41% increase over the consensus estimate for this year.
Given that stocks ultimately follow earnings – and that Ford is trading on the cheap at less than 11 times earnings, compared to 16.8 times for the S&P 500 Index – shares could easily rally another 50% from current levels.
Throw in a modest 2.7% dividend yield, and what’s not to like?
You might be a redneck if you drive a pickup. But you’d be a pretty darn smart redneck if you also owned a few hundred shares of Ford.
That’s it for this week. Before you go, though, let us know what you think of this weekly column – or any of our recent work at Wall Street Daily – by sending an email to [email protected], or leaving a comment on our website.
Ahead of the tape,
Louis Basenese
Article By WallStreetDaily.com
Original Article: Friday Charts: Crooked Politicians, “Redneck Intelligence” and Stock Market Seasonality