ETF Selling Continues in Gold, Futures Bearishness Marks “Possible Turn in Sentiment”

London Gold Market Report

from Adrian Ash

BullionVault

Mon 9 Dec 08:35 EST

The PRICE of wholesale gold held steady around $1230 per ounce in London trade Monday morning, ticking upwards as European shares slipped but Asian stock markets closed higher after strong data from China.

 The Euro rose to 6-week highs vs. the Dollar on the FX market, capping gold priced in the single currency beneath €900 per ounce.

 Silver rose 0.7% as commodities also gained, together with major government bond prices, reaching $19.65 per ounce.

 “A lot of [gold] selling has now been done,” reckons Frances Hudson, co-manager of $271 billion at Standard Life Investments in Edinburgh, quoted by Bloomberg.

 “So you could see a more stable base for the gold price to build on.”

 Last week the giant SPDR Gold Trust (ticker: GLD) shed another 0.9% of the metal held to back its exchange-traded shares, taking the total down to a near 5-year low beneath 836 tonnes.

 Bearish betting by money managers, hedge funds and other speculators meantime rose in the week-to-last-Tuesday to 315 tonnes equivalent, well above the 250-tonne average of 2013 to date.

 That compares with the previous 5-year average short position of 96 tonnes.

 Overall, however, so-called speculative traders remain bullish on gold in aggregate, with their long position in US futures and options outweighing those short bets by 151 tonnes – the smallest “net long” since midsummer’s multi-year lows.

 “This could be just the news that the gold bugs wanted to hear,” says the Financial Times.

 “More and more traders have lost faith…Yet the more that a consensus [for lower 2014 prices] builds, the closer to a possible turn in sentiment.”

 “We could expect a short-term recovery in prices,” Reuters quotes Hong Kong economist Alexis Garatti at Haitong International Research.

 “[Because] in our view, the mood of the market is exaggerated regarding the macroeconomic situation in the US.”

 New data from Beijing meantime showed a surge in China’s exports for November, taking the overall trade surplus to a sudden 4-year high.

 The world’s largest gold mining producer, China is now also the world’s largest end-buyer of gold, overtaking India in 2013, which will likely see a drop in gold imports to 900 tonnes according to comments Monday from market-development group the World Gold Council.

 Gold prices on the Shanghai Gold Exchange rose Monday in brisk trade, even as the Yuan exchange rate was raised to new highs against the Dollar by the People’s Bank.

 “There’s so much room to grow,” says World Gold Council investment director for the Far East, Roger Liu, quoted by the Wall Street Journal.

 Noting China’s current gold accumulation of 4.5 grams per head per year, and contrasting it with the global 24-gram average, “I expect more [ETF trust fund] products along the lines of SPDR Trust to pop up in China,” Liu concludes.

Adrian Ash

BullionVault

Gold price chart, no delay | Buy gold online


Adrian Ash is head of research at BullionVault, the secure, low-cost gold and silver market for private investors online, where you can fully allocated bullion already vaulted in your choice of London, New York, Singapore, Toronto or Zurich for just 0.5% commission.


(c) BullionVault 2013

Please Note: This article is to inform your thinking, not lead it. Only you can decide the best place for your money, and any decision you make will put your money at risk. Information or data included here may have already been overtaken by events – and must be verified elsewhere – should you choose to act on it.


Why Apple and Twitter stocks should be in your Portfolio?

Article by Investazor.com

AppleTwitter-9.12.2013

Twitter and Apple were in the spotlight last week with the social media company rallying to the best level in a month and the smartphone manufacturer which hit the highest point in a year. The timeline of the events which led to these moves for Apple is the following:

On Wednesday, 4th of December, Apple announced the acquisition of Topsy for 200 million dollars, a company that analyzes Twitter data by allowing users to analyze millions of Twitter posts, helping them figure out trends, identify influential Twitter users and measure the effectiveness of campaigns on the social network. According to The Wall Street Journal, Topsy is one of Twitter Inc. partners that have access to all tweets since 2006.So why did Apple buy Topsy? Or, let me put it this way, why would Apple ever be interested in Twitter’s data? Because social media is kind of THE thing at the moment, could be one answer.

Remaining the top U.S. smartphone manufacturer in the October quarter, in a market where 149 million people in the U.S. own smartphones and according to comScore with a market share of nearly 41% bring me to a second answer. In a more challenging mobile and social world in which Apple’s stake is threatened by its competitors, the smartphone manufacturer made a smart move adapting to the social media business ecosystem of our days.
Who is the winner of this deal? Both of them, Apple by integrating Twitter within its own software which in turn could be used to boost Apple’s own social networking strategy and Twitter by enhancing its image of a growth company and proving it is on right path towards the profits every investor expects from the social media company.

Thursday, 5th of December, was that kind of day when you buy on the rumor and sell on the news. Following a Wall Street Journal report late Wednesday that citing an anonymous source familiar with the matter, said Apple signed a deal for Chinese telecom giant China Mobile to carry the iPhone beginning in mid-December, Apple reached a 52-week-high on Thursday as the iPhone maker’s shares rose $10.17 to $575.14.

“We are still negotiating with Apple, but for now we have nothing new to announce,” China Mobile spokeswoman Rainie Lei said, declining to elaborate. Apple also declined comment. After all, there was no deal yet and Apple ended the day with a gain of $2.90 a share, closing at $567.90.
Why it is so important that Apple make this deal? China Mobile is the world’s largest mobile-phone carrier in terms of subscribers, with more than 700 million. The move would make Apple’s latest iPhone models available to a network that has more than 700 million mobile-phone subscribers which translates into big business for the Silicon Valley-based company.

This deal is seen so important by the markets so that on Tuesday, 3rd of December, UBS analyst Steven Milunovich raised his rating on Apple to buy from neutral, and lifted his price target on the company’s stock to $650 a share “in anticipation of China Mobile” getting the iPhone. Milunovich said the Chinese government should soon issue licenses for 4G networks, leading to China Mobile adding support for the iPhone in mid-to-late December.

The interesting fact is that two days after the rating change on Apple from neutral to buy, China’s Ministry of Industry and Information Technology issued 4G licenses to China Mobile, China Unicom and China Telecom in a widely expected move. So, this China Mobile’s 4G TD-LTE license thing paves the way for offering iPhones as Apple’s latest models support the standard and also increases the chance for a deal between the two giants.

The Wall Street Journal article from late Wednesday also mentioned that the rollout of iPhones by the world’s largest mobile carrier by users is expected to start around the time of China Mobile conference in the city of Guangzhou, which takes place on December 18. Again, these are just rumors, but I can’t stop from wonder myself.

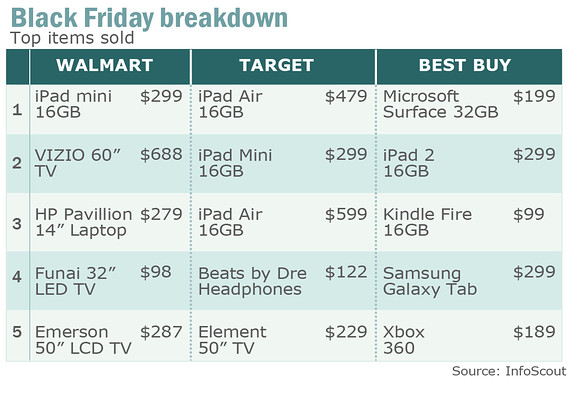
Could be China’s Ministry of Industry and Information Technology decision to issue 4G licenses for the Chinese telecom giants with two weeks before is made an official announcement regarding the deal between Apple and China mobile just a coincidence? I don’t know, but what I do know is that Apple is not dead and buried and it still has the potential to grow its business, the deal with China Mobile being just one opportunity to do that. To continue on this note, Black Friday numbers showed that the iPad was the winner of the day.

friday-breakdown-results-9.12.2013
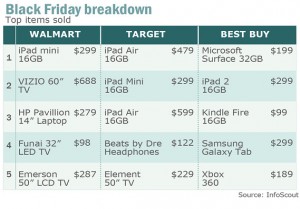
According to the market research firm InfoScout, at Wal-Mart and Target Stores the iPad Mini 16GB and iPad Air 16GB were the top sellers, various iPad products representing 18% of Target’s sales and the iPad Mini alone accounting for 6.5% of Wal-Mart’s sales on Black Friday.
Online, a research conducted by price-comparison site PriceGrabber.com also showed iPad Air and iPad Mini were the top searched items of the weekend since Thanksgiving.
All these numbers show how dominant Apple still is in the smartphone and tablets industry and prove that those who were singing the demise of this tech giant were so wrong. So, in this context, a China Mobile deal could be the thing Apple needs in order to return to the highs of 2012.

As a conclusion, Apple is gathering momentum and is a Buy for the next three to six months for a couple of reasons. From a historically-macro perspective, December is the second best month of the year for stocks and Apple should perform in line with the stock market indices which hold a 26% gain since the beginning of the year. Of course, this is not a must as the probability of tapering increased in the recent period, but the market’s reaction regarding the improving state of the American economy suggests that it takes into account a tapering, but only to take place next year, most probably in March. The other two reasons refer to holyday season spending euphoria and, of course, the possibility of the China Mobile deal, which seems quite probable to happen on 18th of December.

The timeline of the events for Twitter is the following:

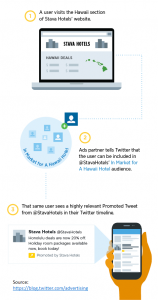
On Thursday, 5th of December, Twitter product manager Abhishek Shrivastava, announced in a blog post a new feature, called “tailored audiences,” which would help advertisers find and send ad messages to “existing and potential customers” on the social network. How does this feature work? The following example from the Twitter product manager’s blog, where has been made the announcement, is aimed at understanding how the feature blends in Twitter’s micro-blogging service:
“Let’s say a hotel brand wants to advertise a promotion on Twitter and they’d prefer to show their ad to travel enthusiasts who have recently visited their website. To get the special offer to those people who are also on Twitter, the hotel brand may share with us browser-related information (browser cookie ID) through an ads partner. We can then match that information to Twitter accounts in order to show the matched users a Promoted Tweet with the travel deal. The end result is a highly relevant and useful message for the user.”

new-twitter-system-09.12.2013

Twitter shares rallied more than 5% on the announcement and touched 46.30$, the best level since the day after the IPO, as the new feature brings hope that San Francisco-based company will explore new ways to cash in on its huge user base of more than 230 million.

But Twitter’s “tailored audiences” new feature could spark privacy worries, which is why the company said users can opt out by unchecking the box next to “promoted content” in their privacy settings. Twitter would then “not match their account to information shared by our ads partners for tailoring ads.”

Friday, 6th of October, was a day with mixed “feelings” for Twitter. First, we found out that “cashtags” turn tweets into dollars. Celebrities and brands are letting consumers buy products or donate to their charities simply by adding a hashtag like #buy to their tweets.
But how can a simple hashtag lead to a transaction? Chirpify , a company launched last year, lets consumers sign up on its website and once customers enter their personal and credit-card information, when campaigns like Eminem’s or Lady Gaga’s launch, they can tweet, Facebook or Instagram a specified hashtag and buy items instantly.

The fact is while the tweet-to-buy concept is in its infancy, it is “a growing trend” and some companies and consumers are no doubt intrigued by this concept, but the opinions are shared. The pro’s are talking about the easiness of the service, whereas the con’s mention the privacy issues which will arrive and that it won’t work for a lot of consumers as they will be reticent in sharing their personal information so that they could buy something through a hashtag.

The controversial news of the day was the publication of the letters between The Securities and Exchange Commission and Twitter in which SEC regulators ask the company to explain its unusual patent system in the weeks leading up to its initial public offering.
To cut the story short, “In such event (one of its inventors does leave for another company and uses its patented technology to compete with Twitter), we may be limited in our ability to assert a patent right against another company, and instead would need to rely on trade secret protection or the contractual obligation of the inventor to us not to disclose or use our confidential information,” the company said.

The thing is that investors are seeing Twitter’s policy as giving engineers too much saying on patents and I think this patent controversy could be a long-term headache for Twitter if they will not take action soon. As a reaction to this news, Twitter’ shares lost 0.80$ and closed the day at 44.95$, 5 cents shy of 45$.

As a conclusion, I reassert what I said before the IPO, putting Twitter in a moderately bullish perspective and also seeing it as a Buy and Hold stock for the six to nine months. I’m saying this because Twitter is a young company with very good growth prospects so, if you’re looking for growth, go ahead and chase Twitter. Of course, fundamentally speaking, there are losses expected in 2013 and 2014 by most analysts. But, the key metrics of interest here is the 22% and 21% sequential revenue growth shown in the most recent quarters. This is a quite fast growth and it is what investors like and are betting on.

The post Why Apple and Twitter stocks should be in your Portfolio? appeared first on investazor.com.

The Senior Strategist: A week of politics

U.S. stocks rised after strong Jobs Report. Early Friday the Labor Department reported that the U.S. economy added 203.000 jobs in November, and the unemployment rate fell to 7% from 7.3%.

This week is more a week of politics – and some important economic data to look forward to, according to The Senior Strategist Ib Fredlund Madsen.

Legal information

Video courtesy of http://en.jyskebank.tv/


USDJPY Looks For 104 – Elliott Wave Forecast

USDJPY Daily

USDJPY accelerated nicely to the upside in the last few weeks after breaking above 100.60 swing high that represents a wave D) high in a triangle. Usually when this high is broken it means that triangle is complete and that market is moving impulsively. With that said, we think that prices are in a red wave 3) of (5) moving up towards new highs. USDJPY is now in bullish move as long as pair trades above 99.50.

USDJPY Daily Elliott Wave

USDJPY 4h

USDJPY has retraced back to 101.60 last week where three wave decline appears complete after recent rally above above 103.00 level. We are talking about wave 4 pullback that is now pointing higher for wave 5 move towards 104.40-105.40 projected target as long as 101.60 holds.

USDJPY 4h Elliott Wave

Written by www.ew-forecast.com

2 week trial


Oil Prices Climbs Six-week High on China’s Upbeat Trade Surplus

By HY Markets Forex Blog

Crude oil prices were seen trading higher on the first day of the trading week, as China reported a fresh trade balance data for the last month.

West Texas Intermediate (WTI) crude oil rose 0.13% higher, trading at $97.78 per barrel as of the time of writing, while the European benchmark Brent added $111.74 per barrel at the same time.

China, the second largest oil consumer in the world, imported approximately 23.56 million tons of crude in November, accounting for 5.73 million barrels per day and marking a rise of 19.1% from the previous month on a daily basis.

Meanwhile in Japan, the country reported its gross domestic product (GDP), up by 0.3% in three months to September, marking the slowest quarterly pace this year, following the 0.9% climb in the previous quarter and 1% recorded in the first quarter.

Oil Prices – China

Trade surplus in China climbed to $33.8 billion in November, marking the highest trade surplus since January 2009, while exports growth pace slightly picked up above expectations. Exports rose 12.7% higher, almost doubling analysts forecast of a 7% rise, while imports advanced 5.3%, on a yearly basis.

The Consumer Price Index (CPI), climbed 3% year-on-year in the previous month, a report from the National Bureau of Statistics confirmed on Monday.

Oil Prices – US Data

On Friday, the Bureau of Labour Statistics posted its jobs release for November, showing an addition of 203,000 new employees in the US economy during the month.

The Non-farm payrolls data revealed 203,000 new jobs were added in November, up from the 200,000 recorded in the previous month and exceeding analysts’ forecast of 185,000, according to the Bureau of Labour Statistics.

The unemployment rate in November dropped to 7.0%, compared to 7.3% in the previous month and beating analysts forecast of 7.2%


Win a luxurious trip to the Maldives & up to $30,000 cash for trading with us!

Visit for details http://alturl.com/2kysk 

The post Oil Prices Climbs Six-week High on China’s Upbeat Trade Surplus appeared first on | HY Markets Official blog.

Article provided by HY Markets Forex Blog

Euro Pulls-back From October Highs

By HY Markets Forex Blog

The euro currency withdrew from its October high on Monday and traded flat against the US dollar during the European morning trading hours. While Germany posted a drop in its trade surplus for October, falling below analysts’ estimates.

The euro-bloc currency stood at $1.3700 against the US dollar as of 7:52am GMT, after it rose to its highest level in over a month earlier in the session, the pair was at $1.3721. The euro rose 0.15% higher at ¥141.14 against the yen and edged 0.07% lower to £0.8374 against the pound sterling at the same time.

Euro – ECB

“The EUR has been supported of late, mainly on the back of a less dovish than expected ECB press conference. Although central bank President Draghi continued to stress downside risk to growth, he did not make a case for additional policy action to be imminent. We remain of the view that EUR/USD upside should be limited from the current levels,” Credit Agricole wrote in a note on Monday.

On Friday, the European Central Banks (ECB) decided to maintain its interest rates at 0.25%.

German Trade Surplus

Germany’s trade balance came in at €17.9 billion in October, from €20.3 billion recorded in the previous month. Exports rose 0.2% to €99.1 billion in October, while imports edged up 2.9% to €81.2 billion.

Germany’s industrial production is forecasted to rebound and rise 0.7% month-on-month, compared to the 0.9% recorded in September.

US Labour data

On Friday, the Bureau of Labour Statistics posted its jobs release for November, showing an addition of 203,000 new employees in the US economy during the month.

The Non-farm payrolls data revealed 203,000 new jobs were added in November, up from the 200,000 recorded in the previous month and exceeding analysts’ forecast of 185,000, according to the Bureau of Labour Statistics.

Market participants remain focused on the Federal Reserve’s (Fed) next meeting; which would likely hint when the central bank could  to begin taper its asset-purchases scheme.


Get $100 FREE Funded into your MT4 Account as well as many more amazing benefits! Register with HY Markets today…

http://www.hymarkets.com/english/reg/reg.hyml …

The post Euro Pulls-back From October Highs appeared first on | HY Markets Official blog.

Article provided by HY Markets Forex Blog

Monday Charts: The Positive Side to All the Negative Thinking

By WallStreetDaily.com

The bull market deniers have been out in full force lately.

From Pimco’s Bill Gross, who swears that “all asset prices are bubbly,” to billionaire Jim Rogers, who keeps urging caution because “the big, big rally in the U.S. stock market” isn’t based on reality.

Those are just two notable examples. Rest assured, countless others exist. Don’t just take my word for it, either…

In a recent note to investors, Bespoke Investment Group said, “There’s been so much ‘bubble’ talk lately that our heads are spinning.”

So true! But I’ll take it by the truckload.

Why? Because the more negativity that’s swirling around – and the more pundits that are warning about a top – the more likely it is that we’re nowhere even close.

In other words, their sentiment is a contrarian indicator.

That’s a fact of investing Sir John Templeton validated long ago, when he said (emphasis mine), “Bull-markets are born on pessimism, grow on skepticism, mature on optimism and die on euphoria.”

Newsflash: We’re clearly in the “growing” phase, not the “dying” phase.

If you want concrete proof, look no further than the American Association of Individual Investors (AAII) sentiment survey:

No, this isn’t a printout from my latest electrocardiogram test. It’s the week-to-week swings in bullish sentiment since the current rally began in March 2009.

Forget euphoric, everyday investors appear downright schizophrenic. Their sentiments shift violently and without warning.

But perhaps you don’t put much stock – if any – in sentiment data. Fair enough.

Please realize that rock-solid fundamental data supports the bull market believers, too.

Nothing Bubbly Here

Much has been made about the expanding price-to-earnings (P/E) ratio for the S&P 500 Index. It’s up from 14.5 at the beginning of the year to 16.9 right now.

However, such expansion is perfectly natural for a bull market – especially when more money is chasing after fewer opportunities, as I indicated here.

Keep in mind, while multiples might be expanding, they’re nowhere near extreme levels.

Truth be told, nine out of ten sectors are actually trading at a discount to their average P/E ratios since 1990, according to Bespoke.

As for the entire market, it’s trading at a 14.2% discount to the average since 1990.

All in Cash, Still

Not only are stock market valuations still reasonable, but many investors remain on the sidelines.

In fact, the latest BlackRock Investor Pulse survey reveals that cash is the dominant investment for 48% of Americans. That’s a lot of people “stuck” in cash. Still.

I don’t know what the heck they’re waiting for. When these latecomers finally decide to pull the trigger – and go “all in” on stocks – that’s when we need to worry. But that time definitely isn’t here yet.

Good Tidings For Stocks

How about a short-term correction, a momentary sell-off before resuming the upward march? That’s not very likely, either.

You see, seasonal trading patterns are also working in stocks’ favor.

Despite the month getting off to a rocky start with four down days, December is historically one of the strongest months for stocks.

Take a look:

The average gains are among the strongest in December, and so is the consistency of positive returns.

Over the last 20, 50 and 100 years, the Dow has delivered positive returns 70%, 66% and 73% of the time, respectively.

Bottom line: Ignore the fear mongers and stay long and strong stocks. With the Fed still printing money non-stop, this party’s far from over.

Ahead of the tape,

Louis Basenese

The post Monday Charts: The Positive Side to All the Negative Thinking appeared first on Wall Street Daily.

Article By WallStreetDaily.com

Original Article: Monday Charts: The Positive Side to All the Negative Thinking

Monetary Policy Week in Review – Dec 2-6, 2013: Egypt, Uganda cut as low inflation worries ECB, Canada, Norway

By CentralBankNews.info
    Last week the central banks of Egypt and Uganda cut key interest rates while the ECB, the Bank of Canada and Norges Bank voiced concern over low inflation as the debate over the U.S. Federal Reserve’s tapering of asset purchases rumbled on.
    The use of exchange rates as a internationally competitive tool – one of this year’s recurring themes – also surfaced last week as the Reserve Bank of Australia (RBA) again voiced its concern over the “uncomfortably high” Australian dollar and the Canadian dollar fell to three-year lows on the view that the Bank of Canada (BOC) has turned more dovish just at the same time that the Fed may decide that the U.S. economy is strong enough to handle a reduction in its $85 billion monthly bond purchases.
   Mario Draghi, president of the European Central Bank (ECB), again stressed that he was ‘‘ready and able’’ to take new steps to aid the euro area economy and forecast a “prolonged period of low inflation,” a phenomenon that raises the specter of Japan’s 20 year battle to rid the country of deflation.
    Although the BOC already dropped its policy tightening bias in November, last week’s reference to the growing downside inflation risks, the lack of stronger exports and the expected soft landing for the housing sector reinforced the impression that Canadian rates will be on hold until 2015.
    Echoing Canada’s easier policy stance, Norway’s central bank pushed back any rate increase by 12 months to the summer of 2015.
   As the BOC, Norges Bank referred to lower-than-expected inflation, a decline in house prices and the possibility of low wage growth. The only positive factor for Norway’s economy was a depreciation of the krone currency.
    Uganda’s central bank surprised markets by cutting its rate by 50 basis points to 11.5 percent, only two months after warning that it could raise rates if core inflation were to accelerate and a rate rise in September.
    Egypt’s central bank also surprised markets by cutting its rate by 50 basis points to 8.25 percent as inflation rose in October and may rise further in November and December. Economists had also expected the bank to maintain rates to avoid any further outflow of capital.
    But the Central Bank of Egypt said the downside risks to the economy outweighed the upside risks to inflation given the “persistently negative output gap since 2011” and challenges facing the euro area and softer growth in emerging markets.
    In addition to the ECB, the BOC, the RBA and Norges Bank, the central banks of Poland, the United Kingdom and Mexico maintained their rates last week.
 
    Through the first 49 weeks of this year, central banks have cut their policy rates 111 times, or 23.6 percent of the 473 policy decisions taken by the 90 central banks followed by Central Bank News.
    This is unchanged from the previous week, but down from 25.3 percent after the first half, reflecting the recent rate rises by some of the major emerging market central banks.
     Policy rates have been raised 26 times this year, or 5.5 percent of this year’s policy decisions, up from 4.7 percent after the first half of the year.

     LAST WEEK’S (WEEK 49) MONETARY POLICY DECISIONS:

COUNTRYMSCI     NEW RATE           OLD RATE         1 YEAR AGO
AUSTRALIADM2.50%2.50%3.00%
UGANDA11.50%12.00%12.00%
CANADADM1.00%1.00%1.00%
POLANDEM2.50%2.50%4.25%
NORWAYDM1.50%1.50%1.50%
UNITED KINGDOMDM0.50%0.50%0.50%
EUROSYSTEMDM0.25%0.25%0.75%
EGYPTEM8.25%8.75%9.25%
MEXICOEM3.50%3.50%4.50%

    This week (week 50) 11 central banks are scheduled to hold policy meetings, including Sri Lanka, Iceland, South Korea, New Zealand, Namibia, the Philippines, Serbia, Indonesia, Switzerland, Peru and Fiji.

COUNTRYMSCI             DATE CURRENT  RATE        1 YEAR AGO
SRI LANKAFM9-Dec6.50%7.50%
ICELAND11-Dec6.00%6.00%
SOUTH KOREAEM12-Dec2.50%2.75%
NEW ZEALANDDM12-Dec2.50%2.50%
NAMIBIA12-Dec5.50%5.50%
PHILIPPINESEM12-Dec3.50%3.50%
SERBIAFM12-Dec10.00%11.25%
INDONESIAEM12-Dec7.50%5.75%
SWITZERLANDDM12-Dec0.25%0.25%
PERUEM12-Dec4.00%4.25%
FIJI12-Dec0.50%0.50%

    www.CentralBankNews.info

Murray Math Lines 09.12.2013 (AUD/USD, EUR/JPY, SILVER)

Article By RoboForex.com

Analysis for December 9th, 2013

AUD/USD

Australian Dollar started deeper and more serious correction and right now is moving between Super Trends. If later price rebounds from daily Super Trend, pair will start new descending movement. In this case, target will be at the 0/8 level again.

At H1 chart, Super Trends formed “bullish cross”. Most likely, in the nearest future price will continue growing up towards the 4/8 level. If later bears are able to rebound from this level, instrument may start new descending movement.

EUR/JPY

EUR/JPY is still growing up; last Friday price reached new maximum. Considering that pair is already moving above the 5/8 level, market may continue growing up towards the 8/8 one.

At H1 chart, pair is moving inside “overbought zone”. Most likely, in the nearest future price may form local correction.  After pair breaks the +2/8 level, lines at the chart will be redrawn.

SILVER

At H4 chart, Silver is moving between Super Trends. Last week, market was just several pips away from the 0/8 level. During the next several days, correction towards the 2/8 level may continue.

Price is moving in the middle of H1 chart. Last Friday, instrument rebounded from Super Trends again. If later market is able to keep price above the 5/8 level, instrument will continue growing up towards the 8/8 one.

RoboForex Analytical Department

Article By RoboForex.com

Attention!

Forecasts presented in this section only reflect the author’s private opinion and should not be considered as guidance for trading. RoboForex LP bears no responsibility for trading results based on trading recommendations described in these analytical reviews.


Japanese Candlesticks Analysis 09.12.2013 (EUR/USD, USD/JPY)

Article By RoboForex.com

Analysis for December 9th, 2013

EUR/USD

H4 chart of EUR/USD shows bullish tendency within ascending trend. Three Methods pattern, Three Line Break chart, and Heiken Ashi candlesticks confirm ascending movement.

H1 chart of EUR/USD shows bullish tendency. Three Line Break chart and Heiken Ashi candlesticks confirm ascending movement; price may form several bearish patterns inside resistance area.

USD/JPY

H4 chart of USD/JPY shows completion of descending correction, which is indicated by Tower pattern near closest Window. Three Line Break chart and Heiken Ashi candlesticks confirm ascending movement.

H1 chart of USD/JPY shows bullish tendency. Three Line Break chart and Heiken Ashi candlesticks confirm ascending movement.

RoboForex Analytical Department

Article By RoboForex.com

Attention!
Forecasts presented in this section only reflect the author’s private opinion and should not be considered as guidance for trading. RoboForex LP bears no responsibility for trading results based on trading recommendations described in these analytical reviews.