WTI Crude Bounces Back From Biggest Weekly Drop

By HY Markets Forex Blog

Futures for the North American WTI crude rebounded on Monday following the crude’s biggest weekly drop in 16 months, dragged lower by analysts forecast which revealed a rebound in the service industries in the US, the world’s largest oil consumer.

WTI for February delivery rose 0.10% higher, trading at $94.06 per barrel on the New York Mercantile Exchange at the time of writing. On January 3, the contract dropped 1.6% lower to $93.96, the lowest since Dec 2.

The European benchmark Brent crude for February settlement rose 0.19% higher at $107.10 per barrel on the ICE Futures Europe exchange at the same time. Brent crude was at a premium of $13.03 to WTI.

The Institute for Supply Management’s (ISM) non-manufacturing data for December is expected to be released later in the day, with predictions of a rise to 54.5 points according to analysts. On Friday, the Energy Administration data revealed the US distillate stockpiles rose above analysts’ forecasts while the crude output advanced to the highest level since 1988.

WTI Crude – Libya

Libya has restarted its largest oil fields, El Sharara on Monday, with an initial output of 60,000 barrels a day after protesters in the area agreed to end their blockade which has been disrupting production in the country for weeks, the state National Oil Corp (NOC) confirmed.

Production in Libya dropped to 250,000 barrels a day, down from 1.43 million barrels per day in July 2012.

WTI Crude – US Economy

The US distillate stockpiles, which includes diesel and heating oil, rose by 5.04 million barrels to 119.1 million in the week ended December 27, according to the Energy Administration data. Rising above analysts forecast of a rise by 750,000 barrels.

According to forecasts, the ISM’s non-manufacturing index is expected to show a rise of 54.5 points, rebounding from the previous reading of 53.9 seen in November.

Gasoline inventories added 844,000 barrels to 220.7 million, rising above the forecasted climb of 1.38 million.


Win a luxurious trip to the Maldives & up to $30,000 cash for trading with us!

Visit for details http://alturl.com/2kysk 

The post WTI Crude Bounces Back From Biggest Weekly Drop appeared first on | HY Markets Official blog.

Article provided by HY Markets Forex Blog

The Shakespeare Omen Haunts This Year’s Market

By WallStreetDaily.com The Shakespeare Omen Haunts This Year's Market

“Come, gentlemen, I hope we shall drink down all unkindness.” – William Shakespeare

Well, there may be a lot of “unkindness” to drink down this year.

I realize this may sound preposterous…

But many pundits love to take a single day of trading action to predict the stock market’s direction for the full year.

And the fact that stocks started the New Year by dropping almost 1% – the market’s worst start since the dreaded year, 2008 – has some experts extremely nervous about what lies ahead in 2014.

Should we join them? Hmm… Are you ready for some myth busting?

Because I’m about to tackle the old broker’s tale that “as the market goes on the first day of the year, so it goes for the rest of the year.”

(Have an idea for another myth to bust? Email me here.)

Don’t Fall for Recency Bias

Last year, stocks started the New Year with a pop.

The Dow surged 308.41 points, its best-ever start to the year. And, well, the rest is history.

Over the course of the year, the Dow hit 52 new all-time highs on its way to a 26.5% gain – its best annual performance in nearly two decades.

Fast forward to today, and we can’t let the most recent events cloud our judgment.

As Todd “Bubba” Horwitz of Average Joe Options wrote in a note to his subscribers, while stocks took a “pounding” yesterday, “we want to see more evidence this is a market beginning to correct.”

Try a lot more evidence, Bubba.

What’s One Day… or Five?

Howard Silverblatt, Senior Index Analyst at S&P Dow Jones Indices – also known as the “High Priest of Stats” – reveals that the first day of the year has virtually no predictive ability.

Or as he puts it, “The opening day and full-year performance [have] moved in the same direction 50.6% of the time, with the two moving in different directions 49.4% of the time. Flip a coin.”

So a pop to start last year and a thud to start this year doesn’t mean that stocks are destined to head lower in 2014.

What if we extend our analysis beyond one day to the first five trading days of the year? Still doesn’t tell us a darn thing.

Dan Greenhaus, Chief Strategist at BTIG, says that the “First Five Days of January” indicator is similarly “baloney.”

Rest assured, he’s not exaggerating to make headlines.

An analysis by MarketWatch’s Mark Hulbert last year found that there’s no statistical significance between stock price moves in the first five days and over the course of the entire year.

Truth is, no matter what happens in the first five days of January, there’s a 65% chance that stocks will rise that year. In other words, the long-term trend is – you guessed it… up!

What if we extend our analysis to 31 days? Well, that’s a different story altogether…

The Truth Behind the “January Effect”

As I shared in a myth-busting column last year, an entire month’s performance does hold predictive abilities. Particularly when that month in question is January.

Again, I’ll turn to number-cruncher extraordinaire, Silverblatt, for the irrefutable proof.

He calculated that the market adage, “as January goes, so goes the year,” has been right in 62 out of the last 85 years. That works out to 72.9% of the time.

While it’s not a sure thing, the odds of January’s performance predicting the year’s overall outcome is much better than flipping a coin.

Bottom line: There are perfectly logical explanations for the stock market’s poor performance on the first day of trading in 2014. Like annual rebalancing, profit taking, bad data out of China, a strengthening dollar… the list goes on.

But there are no logical conclusions that can be drawn about how the rest of the year will turn out. We have to wait until the end of the first month to make those conclusions.

So there’s no reason to be worried… yet.

Ahead of the tape,

Louis Basenese

The post The Shakespeare Omen Haunts This Year’s Market appeared first on Wall Street Daily.

Article By WallStreetDaily.com

Original Article: The Shakespeare Omen Haunts This Year’s Market

Ichimoku Cloud Analysis 06.01.2014 (GBP/USD, GOLD)

Article By RoboForex.com

Analysis for January 6th, 2014

GBP/USD

GBPUSD, Time Frame H4. Tenkan-Sen and Kijun-Sen intersected and formed “Dead Cross” (1). Ichimoku Cloud is going down (2); the price is inside Kumo Cloud. Short‑term forecast: we can expect resistance from D Kijun-Sen and Senkou Span B, and decline of the price.

GBPUSD, Time Frame H1. Tenkan-Sen and Kijun-Sen intersected below Kumo Cloud and formed “Dead Cross” (1); all lines are horizontal. Ichimoku Cloud is going down (2). Short‑term forecast: we can expect resistance from Tenkan-Sen and D Kijun-Sen, and decline of the price.

GOLD

XAUUSD, Time Frame H4. Tenkan-Sen and Kijun-Sen are influenced by “Golden Cross” (1). Ichimoku Cloud is going up (2); the price is above the lines. Short-term forecast: we can expect support from Tenkan-Sen and growth of the price

XAUUSD, Time Frame H1. Ichimoku Cloud is going up (2); the price is on Tenkan-Sen. Short‑term forecast: we can expect support from Kijun-Sen and ascending movement of the price.

RoboForex Analytical Department

Article By RoboForex.com

Attention!
Forecasts presented in this section only reflect the author’s private opinion and should not be considered as guidance for trading. RoboForex LP bears no responsibility for trading results based on trading recommendations described in these analytical reviews.


GBPUSD remains in uptrend from 1.5854

GBPUSD remains in uptrend from 1.5854 (Nov 12, 2013 low), the fall from 1.6593 could be treated as consolidation of the uptrend. Deeper decline could be expected, and the target would be at the lower line of the price channel on 4-hour chart. As long as the channel support holds, the uptrend from 1.5854 could be expected to resume, and one more rise towards 1.7000 is still possible. On the downside, a clear break below the channel support will indicate that the uptrend from 1.5854 had completed at 1.6593 already, then the pair will find support around 1.6100.

gbpusd

Provided by ForexCycle.com

Monetary Policy Week in Review – Dec 30-Jan 3, 2014: ‘Year of the Taper’ starts quiet, two banks maintain rates

By CentralBankNews.info

    Global monetary policy was quiet last week with most of the world celebrating Christmas and the start to 2014 – already nicknamed ‘Year of the Taper’ – with only the central banks of Sri Lanka and Uganda taking policy decisions.
    Both Sri Lanka and Uganda maintained their policy rates but Sri Lanka added some spice by rejigging its policy framework.
    The Central Bank of Sri Lanka replaced its previous rate corridor with a Standing Rate Corridor (SCR) with the Standing Deposit Facility Rate (SDFR) setting the floor and replacing the current repurchase rate as a benchmark.
    The ceiling in the corridor will be known as the Standing Lending Facility Rate (SLFR) and determines the rate for the central bank’s provision of overnight funds to the banking system.
    The central bank took advantage of the opportunity to narrow the width of the corridor to 150 basis points from 200 basis points by cutting the SLFR by 50 basis points to 8.0 percent and keeping the SDFR steady at 6.50 percent.
    The Bank of Uganda held its policy rate steady at 11.5 percent but sent a distinctly hawkish message, saying it “shall take appropriate action to ensure that annual core inflation remains around the policy target of 5 percent in the medium term.”
    While expecting inflation to slow in coming months, the central bank expects it to accelerate later this year, mainly due to an improving economy, with the rise in inflation depending on the exchange rate and changes in commodity prices, always a critical component of inflation in emerging and frontier markets.
          LAST WEEK’S (WEEK 1) STORIES ON POLICY DECISIONS:   
          LAST WEEK’S MONETARY POLICY DECISIONS:

COUNTRYMSCI     NEW RATE           OLD RATE        1 YEAR AGO
UZBEKISTAN10.00%12.00%12.00%
SRI LANKA FM6.50%6.50%7.50%
UGANDA11.50%11.50%12.00%
      This week (Week 2) monetary policy will be in focus right away as the U.S. Senate is set to vote on Monday afternoon on Federal Reserve Vice Chair Janet Yellen’s nomination as successor to Fed Chairman Ben Bernanke who will be leaving at the end of this month after eight years as the world’s leading central banker.
      Seven central banks will decide on their monetary policy stance this week, including those from Romania, Poland, South Korea, Indonesia, United Kingdom, the European Central Bank and Peru.

COUNTRYMSCI             DATE CURRENT  RATE        1 YEAR AGO
ROMANIAFM8-Jan4.00%5.25%
POLANDEM8-Jan2.50%4.00%
SOUTH KOREAEM9-Jan2.50%2.75%
INDONESIAEM9-Jan7.50%5.75%
UNITED KINGDOMDM9-Jan0.50%0.50%
EUROSYSTEMDM9-Jan0.25%0.75%
PERUEM9-Jan4.00%4.25%

The One Asset You Should Own… Cash or Stocks?

By MoneyMorning.com.au

As you know from reading Money Morning, we’ve made it clear that you can’t afford to be out of the stock market.

One reason is that for most Aussie investors there just isn’t a wide enough range of alternative investments.

You can own cash, stocks or property. That’s pretty much it in terms of main investments. Yes, you can also invest in gold, but we don’t see gold as a wealth builder; we see it as a wealth protector.

And since property investing is so expensive (it costs thousands in transaction and financing costs) most investors only have two choices: cash or stocks.

That puts you in a bind. Wherever you choose to invest, you’ve got to face a big risk – the risk of being in stocks versus the risk of not being in stocks. But one financial planning veteran says the choice is a no-brainer.

This veteran says investors should only own one asset. And unlike most financial planners he won’t make a penny in commissions if you follow his advice…

In fact, we can tell you right now what asset he recommends putting 100% of your money into.

He won’t mind, because he openly tells anyone who’ll listen. The asset? Cash.

It’s plain and simple advice. But why does this financial planning veteran tell investors to only hold cash? And how does that sit with your editor, who says investors should have up to 50% of their investable assets in stocks?

It’s an interesting (some would say confusing) conflict of opinion. The thing is, while we may have different views on asset allocation, our view on the overall state of the world economy is broadly the same. We’ll explain more on that in a moment.

It really comes down to the timing, your attitude to risk, and the risks you’re prepared to take (or not take) in order to achieve your investment goals.

Cash Tsunami to Strike Markets

Our position is clear. We say that central banks and governments will do all they can to unleash continued torrents of cash into financial markets.

In fact, these torrents will become so large that the only way to describe them will be to call them a financial tsunami. This huge inflow of freshly printed cash into the markets will help central banks and governments to achieve their goal – more inflation.

And what will that mean? From a non-investment standpoint it means a higher cost of living. Put another way, things will become more expensive.

The most dangerous aspect of this is that gradual and persistent inflation is a ‘silent killer’. It’s hard to spot as it’s happening. For the most part you only notice it years down the line, when you suddenly notice that things are more expensive than they used to be.

So how can you combat this? Well, there isn’t a guaranteed solution. Many people think that gold is the best way to hedge against inflation. That’s not necessarily true. The best way we know of to beat inflation is the stock market.

That’s why we suggest investors have up to 30% of their investable assets in dividend paying stocks. We also suggest investors have another 20% of their investable assets in speculative small-cap and blue-chip growth stocks.

We know there’s a risk that stocks could fall if the world economy goes through a repeat of 2008. But our bet is that’s not on the agenda…yet. To tell the truth, our bet is the central banks could keep the tsunami of new cash flowing into the market for another 10 or 20 years…perhaps even longer!

That’s where we differ with Vern Gowdie – the veteran financial planner we mentioned at the top of this letter.

Stocks or Cash?

At first glance it seems impossible to reconcile the idea that two people who offer completely opposite investment advice could agree on the outlook for the economy and markets.

But we do. We both see big trouble ahead if central banks and governments keep meddling in the economy.

Our big point of difference is when the day of reckoning will occur. As we mentioned above, right now we say the current situation could last for 20 years. That’s why we’re in no hurry to ditch stocks.

We’re so bullish that we’ve gone on record to say the Australian market will hit 7,000 points in 2015. And we’ll go on record now to say that if it takes out that high, the next target for the index would be 10,000 points and even 15,000 points.

That may seem unlikely today, but that’s the thing with inflation-induced stock rallies, they tend to soar to previously unthinkable highs.

But what about Vern’s view and his 100% cash allocation? Unlike your editor, Vern doesn’t see the current situation lasting another couple of years, let alone 20 years. That’s why he says it’s just not worth the risk to own anything other than cash.

Many may see this as an extreme view. Others will see it as a prudent way to allocate, manage and preserve their wealth.

Whatever happens, you can’t afford to sit on your hands and not think about it. Be in no doubt that the meddling will lead to an unpleasant outcome. But whether that happens within the next two years or in 20 years is impossible to say today.

All we can say is, for months you’ve heard our view on the subject. If you’re still undecided on what you should do, you would be doing yourself a disservice if you didn’t at least look at Vern’s point of view as well. 100% cash? It may sound crazy, but for you it could be the best advice you’ll get all year. You can find out more on the subject here.

Cheers,
Kris

PS: Vern’s special report outlines five Aussie stocks he says are overvalued following their rally from the 2009 low. If you own any of these five stocks it may be time to cash in your chips and look for better value elsewhere. Go here for more.

Special Report: The Recession Strategy

Join Money Morning on Google+


By MoneyMorning.com.au

Ben Bernanke vs Ben Franklin: Beating the Low Interest Rate Problem

By MoneyMorning.com.au

Dear Resource Hunter,

A penny saved is twopence clear,‘ wrote Benjamin Franklin in his now-classic Poor Richard’s Almanack, published annually between 1732-58. Franklin’s Almanack embodied – and perhaps shaped – the ethos of money in Colonial America.

Today, we’re a far from pennies earning more pennies. Heck, we hardly even talk about pennies after a century of inflation. These days, if you deposit money in a bank, you receive historically low interest rates. I’ll show you an astonishing chart in a moment.

First, though, consider… What are the implications of low interest rates? How should you tailor investing to low interest? In this write-up, I have some thoughts on beating the low interest problem while preserving your wealth over the long haul…

How bad are interest rates – for savers, at least? Look at the chart below, based on data going back to 1790. It puts a new spin on Ben Franklin’s old quip about a ‘penny saved’. A penny saved earned strong interest, back in Franklin’s day!

Throughout most of US history, you could ‘earn’ decent money by following Franklin’s advice and saving pennies. For over two centuries, US interest rates have seldom been less than 4-5%. Often, rates were higher. If you’d followed Franklin’s advice and saved pennies, you’d have earned decent returns over the long haul.

Not anymore! In the past five years, interest rates have crashed below even previous rock bottoms during the Great Depression and the Second World War. How low is low these days? Let’s take a closer look, using a chart of interest rates over the past six decades, prepared by the Federal Reserve Bank of St. Louis.

Just eyeballing the chart, you can see the 5% interest level running across much of the past six decades. Rates were lower sometimes and higher at other times. For example, look at how the fed funds rate spiked up strongly during the recessions of the 1970s and early 1980s, in a battle against inflation.

But look at interest rates since 2008. Over the past five years, they plummeted. Where’s Ben Franklin when you need him? After the crash of 2008, the Fed dropped rates like a stone, and kept them down near zero.

Ben Bernanke vs Ben Franklin

Savers suffer at zero interest. Down at the bank, you don’t even earn pennies on the dollar. The Federal Reserve and its principals know this. In fact, they know it and don’t care!

Last year, none other than Fed Chairman Ben Bernanke cried crocodile tears over the low interest issue. In a speech, Bernanke stated, ‘I know that people who rely on investments that pay a fixed interest rate, such as certificates of deposit, are receiving very low returns, a situation that has involved significant hardship for some.

Yes, and boohoo for you. If you’re a saver, Ben Bernanke feels your pain. But pain or no, the Fed has kept interest rates low, and that’s the plan looking ahead.

Even worse, there may be more pain to come, because lately there’s talk of banks charging fees to hold your funds. That is, you’ll pay the banks, in a form of ‘negative’ interest! In the brave new world of modern money, the Fed’s Ben has turned the other Ben – Mr. Franklin – on his head.

The Wall of Risk

Low interest rates rob the noble saver. The saver defers instant gratification, yet receives nothing for the effort. It goes against history. It ought to change, ‘one of these days’. But we’re stuck with this situation for now – even as we enter the Janet Yellen era.

Along the way, it’s infuriating to do the ‘right thing’ and save but then get kicked around for it. All that and, broadly speaking, it’s not so much individual savers who are harmed by low interest rates. Large-scale damage from low interest rates affects institutional money and pension funds. We’re not talking about ‘pennies saved’ here. We’re looking at literally trillions of dollars of pension funds and such all seeking return.

With low interest rates, many basic assumptions behind large-scale saving and future returns go out the window. Institutional and fund managers look ahead, run the numbers and foresee account deficits. Then? Well, then they change their behaviour. Often as not, people do things inconsistent with long-term economic growth. Like what?

Consider that at low interest rates, many individuals save more, borrow less and pay down debt. That’s good for the individual, perhaps, but slows the economy.

Elsewhere, businesses divert funds from new capital expansion to bulk up pensions. Meanwhile, institutions beat up company managements to cut costs (often as not by laying off workers) and fund share buybacks. Fewer workers? Less capex? There goes the future seed corn for growth.

Even governments bite the bullet. The political tendency is to raise taxes and/or scale back on, say, maintenance on infrastructure, while steering funds to undercapitalised pension accounts.

At the Fed, policy honchos – welcome to the club Janet Yellen – claim that low interest rates stimulate borrowing and spur the economy. So after five years of low rates, where’s the spurred-on economy? One can just as easily argue that low interest rates lead to less money going to concrete, steel and new machinery. If the past five years are any guide, economic growth is slow when interest rates are zero.

Plus, low interest rates create large amounts of essentially ‘dry tinder’ across the economy. That is, people and firms borrow simply for the sake of borrowing at low interest. It’s more fun to play with somebody else’s money, right?

But looking ahead into 2014 and beyond, what happens when the business cycle turns and profits or incomes fall? How does the borrower service debt? Or worse, what happens when (not if) those interest rates go back up? Where’s the money? Well, I suppose that’s what bankruptcy court is for.

Investing Around Low Interest

In an era of low interest rates, investors aren’t getting return down at the bank. To paraphrase that famous line from the television show Seinfeld, ‘No Ben Franklin for you!’

Meanwhile, we have to wait for the other interest rate shoe to drop from the Fed. My concern is what will happen when the markets sense the first signs of interest rates rising. Eventually, somebody has to pull that trigger and get rates back to some semblance of historical norm. On that day, expect heavy selling pressure as people book gains.

We’re not there yet – even in the face of the taper, nobody is raising rates. For now, you need to appreciate the situation. As investors, we have to balance the need for return in a time of low rates with the risk of what happens when things begin to turn. Stick to those quality dividend payers. I’ll write about this much more as 2014 unfolds.

Thanks for reading.

Byron W. King
Contributing Editor, Money Morning

Ed Note: Ben Bernanke vs Ben Franklin was originally published in Daily Resource Hunter.

Join Money Morning on Google+


By MoneyMorning.com.au

Central Bank News – 2014 Global central bank calendar

By CentralBankNews.info
    Following is the 2014 calendar for meetings by central bank committees that decide monetary policy.
    The table includes scheduled meetings for more than 25 of the world’s central banks. In the event that meetings by monetary policy committees take place over several days, the date listed below is for the final day when decisions are normally announced.
    Work is underway to expand the number of central banks covered. You may replicate the table in part or in full only if you link to this page. The calendar can always be accessed at this link.
    The calendar is updated regularly to reflect the latest information as some central banks only release tentative schedules at the beginning of the year and then finalize their calendar as the meeting nears.

  Central Bank News – 2014 Global Central Bank Calendar

               DATE  FX CODE COUNTRYCENTRAL BANK
        JANUARY 
3-Jan    UAHUgandaBank of Uganda
8-Jan    RONRomaniaNational Bank of Romania
8-Jan    PLNPolandNational Bank of Poland
9-Jan    IDRIndonesiaBank Indonesia
9-Jan    GBPUnited KingdomBank of England
9-Jan    EUREuro areaEuropean Central Bank
9-Jan    KRWKoreaBank of Korea
9-Jan    PENPeruCentral Reserve Bank of Peru
13-Jan    SEKSwedenThe Riksbank
15-Jan    BRLBrazilCentral Bank of Brazil
16-Jan    RSDSerbiaNational Bank of Serbia
16-Jan    CLPChileCentral Bank of Chile
16-Jan    EGPEgyptCentral Bank of Egypt
21-Jan    TRYTurkeyCentral Bank of Republic of Turkey
21-Jan    HUFHungaryCentral Bank of Hungary
22-Jan    JPYJapanBank of Japan
22-Jan    CADCanadaBank of Canada
22-Jan    THBThailandBank of Thailand
27-Jan    ILSIsraelBank of Israel
28-Jan    INRIndia Reserve Bank of India 
29-Jan    USDUnited StatesFederal Reserve
29-Jan    MYRMalaysiaCentral Bank of Malaysia
29-Jan    ZARSouth AfricaSouth African Reserve Bank
30-Jan    NZDNew ZealandReserve Bank of New Zealand
30-Jan    FJDFijiReserve Bank of Fiji
31-Jan    MXNMexicoBank of Mexico
        FEBRUARY
4-Feb    RONRomaniaNational Bank of Romania
5-Feb    PLNPolandNational Bank of Poland
6-Feb    PHPPhilippinesCentral Bank of Philippines
6-Feb    GBPUnited KingdomBank of England
6-Feb    EUREuro areaEuropean Central Bank
6-Feb    CZKCzech RepublicCzech National Bank
12-Feb    ISKIcelandCentral Bank of Iceland
12-Feb    GELGeorgiaNational Bank of Georgia
13-Feb    IDRIndonesiaBank Indonesia
13-Feb    RSDSerbiaNational Bank of Serbia
13-Feb    KRWKoreaBank of Korea
18-Feb    JPYJapanBank of Japan
18-Feb    TRYTurkeyCentral Bank of Republic of Turkey
18-Feb    HUFHungaryCentral Bank of Hungary
18-Feb    CLPChileCentral Bank of Chile
24-Feb    ILSIsraelBank of Israel
26-Feb    BRLBrazilCentral Bank of Brazil
27-Feb    FJDFijiReserve Bank of Fiji
27-Feb    EGPEgyptCentral Bank of Egypt
        MARCH 
4-Mar    AUDAustraliaReserve Bank of Australia
4-Mar    UAHUgandaBank of Uganda
5-Mar    CADCanadaBank of Canada
5-Mar    PLNPolandNational Bank of Poland
6-Mar    RSDSerbiaNational Bank of Serbia
6-Mar    EUREuro areaEuropean Central Bank
6-Mar    GBPUnited KingdomBank of England
6-Mar    MYRMalaysiaCentral Bank of Malaysia
12-Mar    THBThailandBank of Thailand
13-Mar    IDRIndonesiaBank Indonesia
12-Mar    THBThailandBank of Thailand
13-Mar    NZDNew ZealandReserve Bank of New Zealand
13-Mar    KRWKoreaBank of Korea
13-Mar    CLPChileCentral Bank of Chile
19-Mar    USDUnited StatesFederal Reserve
19-Mar    ISKIcelandCentral Bank of Iceland
20-Mar    CHFSwitzerlandSwiss National Bank
21-Mar    MXNMexicoBanco de Mexico
21-Mar    TRYTurkeyCentral Bank of Republic of Turkey
24-Mar    ILSIsraelBank of Israel
25-Mar    MADMoroccoBank of Morocco 
25-Mar    HUFHungaryCentral Bank of Hungary
27-Mar    NOKNorwayNorges Bank
26-Mar    GELGeorgiaNational Bank of Georgia
27-Mar    FJDFijiReserve Bank of Fiji
27-Mar    PHPPhilippinesCentral Bank of Philippines
27-Mar    ZARSouth AfricaSouth African Reserve Bank
27-Mar    CZKCzech RepublicCzech National Bank
        APRIL 
1-Apr    AUDAustraliaReserve Bank of Australia
2-Apr    BRLBrazilCentral Bank of Brazil
2-Apr    UAHUgandaBank of Uganda
3-Apr    EUREuro areaEuropean Central Bank
8-Apr    JPYJapanBank of Japan
8-Apr    IDRIndonesiaBank Indonesia
9-Apr    SEKSwedenThe Riksbank
9-Apr    PLNPolandNational Bank of Poland
10-Apr    GBPUnited KingdomBank of England
10-Apr    KRWKoreaBank of Korea
16-Apr    CADCanadaBank of Canada
17-Apr    RSDSerbiaNational Bank of Serbia
17-Apr    CLPChileCentral Bank of Chile
23-Apr    THBThailandBank of Thailand
24-Apr    NZDNew ZealandReserve Bank of New Zealand
24-Apr    FJDFijiReserve Bank of Fiji
24-Apr    EGPEgyptCentral Bank of Egypt
24-Apr    TRYTurkeyCentral Bank of Republic of Turkey
25-Apr    MXNMexicoBanco de Mexico
28-Apr    ILSIsraelBank of Israel
29-Apr    HUFHungaryCentral Bank of Hungary
30-Apr    USDUnited StatesFederal Reserve
        MAY  
5-May    UAHUgandaBank of Uganda
6-May    AUDAustraliaReserve Bank of Australia
7-May    PLNPolandNational Bank of Poland
7-May    CZKCzech RepublicCzech National Bank
7-May    GELGeorgiaNational Bank of Georgia
8-May    PHPPhilippinesCentral Bank of Philippines
8-May    EUREuro areaEuropean Central Bank 
8-May    NOKNorwayNorges Bank
8-May    GBPUnited KingdomBank of England
8-May    MYRMalaysiaCentral Bank of Malaysia
8-May    RSDSerbiaNational Bank of Serbia
8-May    IDRIndonesiaBank Indonesia
9-May    KRWKoreaBank of Korea
15-May    CLPChileCentral Bank of Chile
21-May    ISKIcelandCentral Bank of Iceland
21-May    JPYJapanBank of Japan
22-May    TRYTurkeyCentral Bank of Republic of Turkey
22-May    ZARSouth AfricaSouth African Reserve Bank
26-May    ILSIsraelBank of Israel
27-May    HUFHungaryMagyar Nemzeti Bank
28-May    BRLBrazilCentral Bank of Brazil
29-May    FJDFijiReserve Bank of Fiji
29-May    EGPEgyptCentral Bank of Egypt
        JUNE   
3-Jun    AUDAustraliaReserve Bank of Australia
4-Jun    UAHUgandaBank of Uganda
4-Jun    CADCanadaBank of Canada
4-Jun    PLNPolandNational Bank of Poland
5-Jun    GBPUnited KingdomBank of England
5-Jun    EUREuro areaEuropean Central Bank
6-Jun    MXNMexicoBanco de Mexico
11-Jun    ISKIcelandCentral Bank of Iceland
12-Jun    RSDSerbiaNational Bank of Serbia
12-Jun    NZDNew ZealandReserve Bank of New Zealand
12-Jun    IDRIndonesiaBank Indonesia
12-Jun    KRWKoreaBank of Korea
12-Jun    CLPChileCentral Bank of Chile
13-Jun    JPYJapanBank of Japan
17-Jun    MADMoroccoBank of Morocco 
18-Jun    THBThailandBank of Thailand
18-Jun    USDUnited StatesFederal Reserve
18-Jun    GELGeorgiaNational Bank of Georgia
19-Jun    PHPPhilippinesCentral Bank of Philippines
19-Jun    CHFSwitzerlandSwiss National Bank
19-Jun    NOKNorwayNorges Bank
23-Jun    ILSIsraelBank of Israel
24-Jun    TRYTurkeyCentral Bank of Republic of Turkey
24-Jun    HUFHungaryCentral Bank of Hungary
26-Jun    FJDFijiReserve Bank of Fiji
26-Jun    CZKCzech RepublicCzech National Bank
        JULY  
1-Jul    AUDAustraliaReserve Bank of Australia
2-Jul    UAHUgandaBank of Uganda
2-Jul    PLNPolandNational Bank of Poland
3-Jul    SEKSwedenSveriges Riksbank
3-Jul    EUREuro areaEuropean Central Bank
10-Jul    GBPUnited KingdomBank of England
10-Jul    IDRIndonesiaBank Indonesia
10-Jul    KRWKoreaBank of Korea
10-Jul    MYRMalaysiaCentral Bank of Malaysia
10-Jul    RSDSerbiaNational Bank of Serbia
11-Jul    MXNMexicoBanco de Mexico
15-Jul    JPYJapanBank of Japan
16-Jul    CADCanadaBank of Canada
16-Jul    BRLBrazilCentral Bank of Brazil
17-Jul    TRYTurkeyCentral Bank of Republic of Turkey
17-Jul    EGPEgyptCentral Bank of Egypt
17-Jul    ZARSouth AfricaSouth African Reserve Bank
22-Jul    HUFHungaryCentral Bank of Hungary
24-Jul    NZDNew ZealandReserve Bank of New Zealand
28-Jul    ILSIsraelBank of Israel
30-Jul    USDUnited StatesFederal Reserve
31-Jul    FJDFijiReserve Bank of Fiji
31-Jul    PHPPhilippinesCentral Bank of Philippines
31-Jul    CZKCzech RepublicCzech National Bank
        AUGUST  
4-Aug    UAHUgandaBank of Uganda
5-Aug    AUDAustraliaReserve Bank of Australia
6-Aug    THBThailandBank of Thailand
7-Aug    GBPUnited KingdomBank of England
7-Aug    EUREuro areaEuropean Central Bank
7-Aug    RSDSerbiaNational Bank of Serbia
8-Aug    JPYJapanBank of Japan
13-Aug    GELGeorgiaNational Bank of Georgia
14-Aug    KRWKoreaBank of Korea
14-Aug    IDRIndonesiaBank Indonesia
20-Aug    ISKIcelandCentral Bank of Iceland
25-Aug    ILSIsraelBank of Israel
26-Aug    HUFHungaryCentral Bank of Hungary
27-Aug    TRYTurkeyCentral Bank of Republic of Turkey
28-Aug    FJDFijiReserve Bank of Fiji
28-Aug    EGPEgyptCentral Bank of Egypt
        SEPTEMBER
2-Sep    UAHUgandaBank of Uganda
2-Sep    AUDAustraliaReserve Bank of Australia
3-Sep    BRLBrazilCentral Bank of Brazil
3-Sep    PLNPolandNational Bank of Poland
3-Sep    CADCanadaBank of Canada
4-Sep    SEKSwedenSveriges Riksbank
4-Sep    JPYJapanBank of Japan
4-Sep    EUREuro areaEuropean Central Bank
4-Sep    GBPUnited KingdomBank of England
5-Sep    MXNMexicoBanco de Mexico
11-Sep    NZDNew ZealandReserve Bank of New Zealand
11-Sep    PHPPhilippinesCentral Bank of Philippines
11-Sep    IDRIndonesiaBank Indonesia
11-Sep    RSDSerbiaNational Bank of Serbia
12-Sep    KRWKoreaBank of Korea
17-Sep    USDUnited StatesFederal Reserve
17-Sep    THBThailandBank of Thailand
18-Sep    MYRMalaysiaCentral Bank of Malaysia
18-Sep    NOKNorwayNorges Bank
18-Sep    CHFSwitzerlandSwiss National Bank
18-Sep    ZARSouth AfricaSouth African Reserve Bank
22-Sep    ILSIsraelBank of Israel
23-Sep    MADMoroccoBank of Morocco 
23-Sep    HUFHungaryCentral Bank of Hungary
24-Sep    GELGeorgiaNational Bank of Georgia
25-Sep    TRYTurkeyCentral Bank of Republic of Turkey
25-Sep    FJDFijiReserve Bank of Fiji
25-Sep    CZKCzech RepublicCzech National Bank
        OCTOBER
1-Oct    ISKIcelandCentral Bank of Iceland
2-Oct    UAHUgandaBank of Uganda
2-Oct    EUREuro area European Central Bank
7-Oct    AUDAustraliaReserve Bank of Australia
7-Oct    JPYJapanBank of Japan
7-Oct    IDRIndonesiaBank Indonesia
8-Oct    KRWKoreaBank of Korea
8-Oct    PLNPolandNational Bank of Poland
9-Oct    GBPUnited KingdomBank of England
16-Oct    RSDSerbiaNational Bank of Serbia
16-Oct    EGPEgyptCentral Bank of Egypt
22-Oct    CADCanadaBank of Canada
23-Oct    PHPPhilippinesCentral Bank of Philippines
23-Oct    TRYTurkeyCentral Bank of Republic of Turkey
23-Oct    NOKNorwayNorges Bank
27-Oct    ILSIsraelBank of Israel
28-Oct    SEKSwedenThe Riksbank
28-Oct    HUFHungaryCentral Bank of Hungary
29-Oct    BRLBrazilCentral Bank of Brazil
29-Oct    USDUnited StatesFederal Reserve
30-Oct    FJDFijiReserve Bank of Fiji
30-Oct    NZDNew ZealandReserve Bank of New Zealand
31-Oct    MXNMexicoBanco de Mexico
        NOVEMBER 
4-Nov    UAHUgandaBank of Uganda
4-Nov    AUDAustraliaReserve Bank of Australia
5-Nov    PLNPolandNational Bank of Poland
5-Nov    ISKIcelandCentral Bank of Iceland
5-Nov    THBThailandBank of Thailand
5-Nov    GELGeorgiaNational Bank of Georgia
6-Nov    CZKCzech RepublicCzech National Bank
6-Nov    GBPUnited KingdomBank of England
6-Nov    EUREuro areaEuropean Central Bank
6-Nov    MYRMalaysiaCentral Bank of Malaysia
13-Nov    RSDSerbiaNational Bank of Serbia
13-Nov    IDRIndonesiaBank Indonesia
13-Nov    KRWKoreaBank of Korea
19-Nov    JPYJapanBank of Japan
20-Nov    ZARSouth AfricaSouth African Reserve Bank
20-Nov    TRYTurkeyCentral Bank of Republic of Turkey
24-Nov    ILSIsraelBank of Israel
25-Nov    HUFHungaryCentral Bank of Hungary
27-Nov    FJDFijiReserve Bank of Fiji
27-Nov    EGPEgyptCentral Bank of Egypt
        DECEMBER 
2-Dec    AUDAustraliaReserve Bank of Australia
2-Dec    UAHUgandaBank of Uganda
3-Dec    BRLBrazilCentral Bank of Brazil
3-Dec    CADCanadaBank of Canada
3-Dec    PLNPolandNational Bank of Poland
4-Dec    GBPUnited KingdomBank of England
4-Dec    EUREuro areaEuropean Central Bank
5-Dec    MXNMexicoBanco de Mexico
10-Dec    ISKIcelandCentral Bank of Iceland
11-Dec    NOKNorwayNorges Bank
11-Dec    KRWKoreaBank of Korea
11-Dec    PHPPhilippinesCentral Bank of Philippines
11-Dec    NZDNew ZealandReserve Bank of New Zealand
11-Dec    RSDSerbiaNational Bank of Serbia
11-Dec    IDRIndonesiaBank Indonesia
11-Dec    CHFSwitzerlandSwiss National Bank
12-Dec    FJDFijiReserve Bank of Fiji
16-Dec    SEKSwedenThe Riksbank
16-Dec    MADMoroccoBank of Morocco 
17-Dec    CZKCzech RepublicCzech National Bank
17-Dec    THBThailandBank of Thailand
17-Dec    USDUnited StatesFederal Reserve
17-Dec    GELGeorgiaNational Bank of Georgia
18-Sep    HUFHungaryCentral Bank of Hungary
19-Dec    JPYJapanBank of Japan
24-Dec    TRYTurkeyCentral Bank of Republic of Turkey
29-Dec    ILSIsraelBank of Israel

My Top 5 Resolutions for 2014

By Investment U

We’ve closed the book on 2013, and it’s time to make resolutions for the new year. Alexander Green’s “Four Resolutions That Will Make You Rich” is great advice for investors. Now, let me share with you my five resolutions.

  1. Adjust the Signal-to-Noise Ratio. I read and study voraciously, and a lot of that is done on the Internet. There is a tremendous amount of information out there. But separating the signal (useful) from the noise (harmful) can be difficult.

    I want to adjust that ratio so my useful signals are stronger and I absorb less noise.

    This means tuning out the people who beat the same note over and over, and those who draw conclusions that just don’t line up with the facts.

  1. Don’t Panic. Bad news often sells well in financial publishing. So, in the time it takes me to go out for coffee, my inbox will fill up with articles from prominent people predicting imminent catastrophe. These people were wrong all during the 30% gain the S&P 500 racked up this year, and many of them have been wrong for the entire 63% gain that the market has racked up since the last major bottom in October 2011.

    That doesn’t mean the market won’t pull back. Heck, it may be overdue for a pullback. A correction of up to 10% wouldn’t surprise me. But any pullback is a buying opportunity, not a reason to panic.

    This market is incredibly resilient. We should call it the “Flubber” market because it bounced back higher than ever from several scares this year, including drumbeats of war in the Middle East, the budget crisis in Washington and more.

    Every single pullback was a buying opportunity… despite the constant cries of alarm from the merchants of fear.

  1. Find the Contrarian Opportunities. It’s easy to let your thinking get into a rut. And it’s so, so easy to go along with the crowd. The problem with going along with the crowd is you miss the opportunities in untrodden pastures. And if you find those opportunities early, the payoffs can be extraordinary.

    Mind you, there’s no point in being a contrarian just for the sake of it. If the fundamentals of any investment class are getting worse, then that investment class is likely to get cheaper. It’s only when things bottom out – when bad news is greeted by higher prices – that the real contrarian opportunities can be found.

    My resolution is to find more of those contrarian opportunities in 2014.

  1. Argue Less, Discuss More. There’s a poster that I’m going to print out and put over my desk. Here’s what it says: “There are some people who always seem angry and continuously look for conflict. Walk away; the battle they are fighting isn’t with you, it is with themselves.”

    In the past, I’ve been one of those dummies who thinks that just because some person is loudly, angrily wrong on the Internet, I have to engage them. I don’t. I’ll be a happier person – and probably a better trader – if I limit my discussions to people who are expressing interesting points of view, even if those are points of view I currently disagree with.

    After all, they might be right. If I don’t engage people who disagree with me, I can’t find out if I’m wrong. But I can give my blood pressure a break by avoiding arguments with people who seem to love bickering for its own sake.

  1. Keep an Eye on the Long Game. I don’t know about you, but it’s time for me to start planning my estate, something I’ve put off for far too long. Mortality is one of those inescapable eventualities. If you think you’re getting out of this alive, it’s time for a rethink. And it’s time for meto think hard about estate planning.

    I can’t control where and when I’ll die. But I cancontrol the financial picture I leave behind. It could be a simple process that makes things easy on my family, or it could be a giant mess. So this month my wife and I are going to update our wills, which is long overdue, and make a list of who gets what in the safety deposit box, so there’s no fighting. We also need to formally appoint guardians for our children in case we kick the bucket at the same time.

    I also need a living will and to appoint someone to make medical decisions if I become incapacitated.

Your own list of resolutions may be different. But it’s time to make that list of resolutions, and stick with it.

Here’s to a great 2014,

Sean

Article By Investment U

Original Article: My Top 5 Resolutions for 2014

Weekend Update by The Practical Investor

Weekend Update by  www.thepracticalinvestor.com

January 3, 2014


— During Christmas Week it appears that VIX completed declining in a Primary Wave [5].  This week it closed at weekly Intermediate resistance at 13.84 and still has to overcome Long-Term resistance at 14.05, but the reversal appears real.  Confirmation of a change in trend lies above that level with confirmation of the trend change at 16.44 to 16.75.

SPX reverses within the Broadening Top.

— SPX made its final intraday high on December 31, then closed the week within the Orthodox Broadening Top, which began forming in mid-November.  The Orthodox Broadening Top is formed by three successively higher tops and two bottoms, the second of which must be lower than the first. This forms a “Megaphone” pattern.  A decline from this peak through the bottom trendline of the Broadening Top completes the formation and sets up the initial downside target.


(ZeroHedge) The weakness in stocks accelerated after Europe’s close, was briefly stalled by algo wildness and VWAP buys on Bernanke’s completely non-news speech this afternoon, then dropped into the close, but was far outweighed by the moves in commodities. WTI Crude has dropped over 6% in the last 4 days – its biggest such drop in almost 8 months. The last 2 days have seen gold rise at its fastest pace in almost 3 months.

NDX closes the week at its trendline.

— NDX closed the week at the upper trendline of its Ending Diagonal formation after making a new closing high on Tuesday.   The 4.8 year rally may now be finished.  Confirmation of that would come with a decline beneath the trendline followed by a further decline below the Cycle Top line at 3447.58.


(ZeroHedge)  As we warned was likely to happen back in February of 2013 (given the typical trajectory of earnings expectations through a year), JP Morgan has confirmed that the S&P 500 is now more expensive on a forward P/E basis than it was at its peak in October 2007. So, despite the self-referential bias of each and every talking head asset-gatherer on mainstream media’s denial, stocks do not offer value here… no matter how many TINAs or BTFATHs you hear…

The Euro reverses at its Cycle Top.


.  


           — The Euro reversed down this week after challenging its Cycle Top resistance at 138.07 for the past two weeks.  It closed just above its weekly Intermediate-term support at 135.81.   Final support is at 132.93 and 130.88, beneath which the Euro decline may accelerate.


(ZeroHedge)  One of our favorite themes in the past year has been watching Mario “Whatever it takes” Draghi reel powerless before the relentless contraction in Eurozone credit. Most recently, inNovember we reported that “when the ECB announced a “surprising” rate cut, 67 out of 70 economists who never saw it coming, were shocked. We were not. As we observed ten days prior, Europe had just seen the latest month of record low private sector loan growth in history. Or rather contraction.

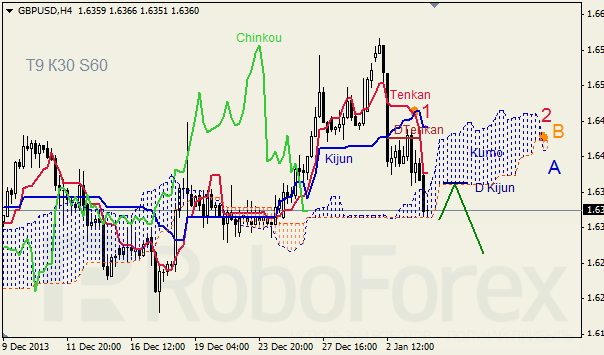
The Yen is now testing its Head & Shoulders neckline.

–The Yen slipped below the Head & Shoulders neckline at 96.00 over the holidays. It appears to be breaking down beneath the neckline in a Primary Wave [5] in a very strong decline that may last through mid-February.


The US Dollar closed above mid-Cycle resistance.


— USD closed above its weekly mid-Cycle resistance at 80.95 and has closed above its December high.  The Cycle Model suggests the next phase of the rally lasting through late January that may bring the USD above its inverted Head & shoulders pattern shown in the chart.  The bear trap for dollar shorts has now been sprung.

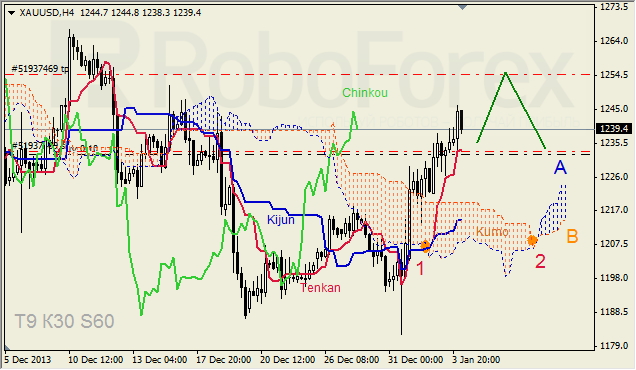
Gold bounces from a new Head & Shoulders formation.

— Gold bounced from its new Head & Shoulders neckline at 1181.40 and appears to have stopped its retracement just under Short-term resistance at 1243.77.  Indications are that gold may turn back down early next week.  A bearish Cup with Handle formation has already been triggered, so any additional rally may be limited in breadth.


(ZeroHedge)  Sales of gold coins are booming even as the precious metal’s price is falling (and it’s not just central banks). Despite gold futures 28% drop in 2013 (its worst since 1981), the WSJ reports that demand for gold coins shot up 63% to 241.6 metric tons in the first three quarters of 2013.


Treasuries decline beneath the Broadening Wedge.


— USB declined beneath the trendline of its massive Broadening Wedge formation and may be threatening its 32.25-year trendline.  The Broadening Wedge suggests a probable 20% loss beneath this support level.  More importantly, the loss of a long term uptrend is in jeopardy.


(Bloomberg)  Treasury yields traded at almost the highest levels since 2011 as Federal Reserve Chairman Ben S. Bernanke said the headwinds that have held back the U.S. economy may be abating, leaving the country poised for faster growth.


Crude has a mighty reversal this week.

— Crude plunged nearly 6% in two days, turning a mildly bullish outlook in WTIC to bearish.  This implies that further downside beneath the prior low at 91.77 may confirm that a downtrend is already in place.  Upside movement, should it appear, may be inhibited by the overhead resistance between 94.25 and 98.73.

(Bloomberg)  West Texas Intermediate crude fell, capping the biggest weekly decline in 19 months, after a government report showed that U.S. supplies of distillate fuel and gasoline climbed.  Futures dropped 1.6 percent today and 6.3 percent this week. The Energy Information Administration said stockpiles of distillate fuel, including heating oil and diesel, rose 5.04 million barrels last week to 119.1 million. Gasoline inventories gained 844,000 barrels to 220.7 million. Fuel demand tumbled 7.2 percent, the most since January 2012. Crude supplies slid as Gulf Coast refiners curbed deliveries to reduce local taxes.

China stocks take a plunge.

–The Shanghai Index consolidated at new lows not seen since last Summer.  SSEC may continue its decline through mid-January in what appears to be a growing liquidity crunch.  In the process, it has a high probability of making some new lows.  The duration of this decline may not be finished until mid-March..

(Reuters) – About 3.33 million hectares (8 million acres) of China’s farmland is too polluted to grow crops, a government official said on Monday, highlighting the risk facing agriculture after three decades of rapid industrial growth.

China has been under pressure to improve its urban environment following a spate of pollution scares.  But cleaning up rural regions could be an even bigger challenge as the government tries to reverse damage done by years of urban and industrial encroachment and ensure food supplies for a growing population.

The India Nifty retreats back to support.

— The India Nifty retreated back to Short-term Support at 6177.33 this week.  The decline into early January came as expected and may continue through mid-February.  This decline may be deflationary to an extreme, since equities have become thoroughly saturated with liquidity from India’s central bank and simply cannot absorb any more.  Indian investors are leveraged to the hilt.  The potential for a panic decline to the weekly Cycle bottom (4741.71) is very high.

The Bank Index  is still flying high.

— BKX  has closed exactly at 50% of its decline from 2007 to 2009.  The momentum oscillators are winding down and the 50% Fibonacci level may be all it takes for a reversal.  The resumption of the secular bear market may be most spectacular in BKX.

(ZeroHedge)  On December 31 we demonstrated the biggest operation in the history of the Fed’s temporary open market operations: a $198 billion reverse repo under its brand new fixed-rate scheme, which, at least according to the Fed, was supposed to be a mechanism designed to prepare the market for the “normalization” of the Fed’s balance sheet and allow seamless liquidity extraction. What the Fed did not announce was that it was also the biggest collateral window-dressing scheme ever conceived (that there was $200 billion in free liquidity sloshing around was a distant second highlight).

(TheEconomist) “NAUGHTY or nice” is not a discussion investment bankers have with Santa before Christmas but one they have with their bosses early in the new year. The haggling usually opens with the boss saying what a tough year it has been and the bankers, often experienced traders and dealmakers, talking about how valuable they are. This year’s negotiations will be unusually tense. At stake will not simply be pay, an issue complicated by the introduction on January 1st of a bonus cap in Europe, but also jobs.

After peaking at the end of 2010, employment in the investment-banking industry has been declining steadily. Deutsche Bank reckons that the number of bankers employed by the ten largest firms will fall by about 3,000 in 2014, leaving the total 20% below its peak. Add in job losses at smaller firms and declines in support staff, and total worldwide employment in the industry may fall by 20,000 this year.

(ZeroHedge) The ongoing debacle of Italy’s Banca Monte dei Paschi (BMPS) took a turn for the worst today. The bank’s largest shareholders (MPS Foundation) approved (read – forced through) a delay in a EUR 3 billion capital raise, which the bank needs to avoid nationalization, until May. The delay (which will cost the bank EUR 120 million in interest) allows MPS more time to liquidate their 33.5% holding before their stake is massively diluted. Management is ‘considering’ resignation and is “very annoyed,” but the city Mayor is going Nationalist with his delay-supporting comments that “we cannot let the third biggest bank in this country fall prey to foreign interests.” So Europe is recovering but they can’t even raise a day’s worth of POMO to save the oldest bank in the world?

Is this progress???

Regards,

Tony

Anthony M. Cherniawski

The Practical Investor, LLC

P.O. Box 129, Holt, MI 48842

www.thepracticalinvestor.com

Office: (517) 699.1554

Fax: (517) 699.1558


Disclaimer: Nothing in this email should be construed as a personal recommendation to buy, hold or sell short any security.  The Practical Investor, LLC (TPI) may provide a status report of certain indexes or their proxies using a proprietary model.  At no time shall a reader be justified in inferring that personal investment advice is intended.  Investing carries certain risks of losses and leveraged products and futures may be especially volatile.  Information provided by TPI is expressed in good faith, but is not guaranteed.  A perfect market service does not exist.  Long-term success in the market demands recognition that error and uncertainty are a part of any effort to assess the probable outcome of any given investment.  Please consult your financial advisor to explain all risks before making any investment decision.  It is not possible to invest in any index.


The use of web-linked articles is meant to be informational in nature.  It is not intended as an endorsement of their content and does not necessarily reflect the opinion of Anthony M. Cherniawski or The Practical Investor, LLC.  


P.O. Box 129  Holt, MI  48842  (517) 699-1554  Fax: (517) 699-1558

Email: [email protected]  www.thepracticalinvestor.com