Apple Inc. Price Action Entering the 5th Wave

Article by Investazor.com

aapl-entering-5th-wave-resize-13.01.2014

On the 27th of June the price of Apple Inc.’s stocks reached the second low of the Double Bottom pattern ,confirmed in the end of July by a breakout above 463$ per share. The pattern gave a very good signal for the trend reversal.

From the beginning of July until the mid of September the price has drawn a 5 small waves up moves, drawing Wave 1 on a higher level, and an abc correction, ending as well the 2nd wave. From 16th of July started another up move formed by 5 lower rang waves, which in my opinion has drawn the 3rd wave at the higher level that has ended in the beginning of December.

From 5th of December all the way to 10th of January 2014, the price has drawn a 3 wave, corrective move, which has touched the uptrend line and got pretty close to the 100 EMA. This means that around the price can find a good support area around 525$ per share. If the 4th wave will be over around here, I expect the price to rally to 600$ per share, ending this way the 5 wave pattern mentioned in Elliott Wave Theory.

Even though the price moved beautiful conform EWT I would be attentive at this support zone. If bulls will not pressure the price to bounce, we might see a fall under the trend line. A daily close under the 100 EMA could annihilate the current analysis and the price might fall back to retest 500$ per share, or, why not, even lower.

The post Apple Inc. Price Action Entering the 5th Wave appeared first on investazor.com.

Japanese Candlesticks Analysis 13.01.2014 (EUR/USD, USD/JPY)

Article By RoboForex.com

Analysis for January 13th, 2014

EUR/USD

H4 chart of EUR/USD shows bullish tendency, which started after Harami and Tweezers patterns. Three Methods pattern, Three Line Break chart, and Heiken Ashi candlesticks confirm that bullish tendency continues.

H1 chart of EUR/USD shows also shows bullish tendency, which continued after Morning Star and Tweezers patterns. Closest Window is resistance level. Three Line Break chart and Heiken Ashi candlesticks confirm ascending movement.

USD/JPY

H4 chart of USD/JPY shows bearish tendency, which is indicated by Tower pattern. Closest Window is broken; now it’s resistance level. Three Line Break chart and Heiken Ashi candlesticks confirm descending movement.

H1 chart of USD/JPY shows descending trend. Closest Window is resistance level. Three Line Break chart and Heiken Ashi candlesticks confirm descending movement.

RoboForex Analytical Department

Article By RoboForex.com

Attention!
Forecasts presented in this section only reflect the author’s private opinion and should not be considered as guidance for trading. RoboForex LP bears no responsibility for trading results based on trading recommendations described in these analytical reviews.


Murray Math Lines 13.01.2014 (AUD/USD, EUR/JPY, SILVER)

Article By RoboForex.com

Analysis for January 13th, 2014

AUD/USD

Correction turned out to be deeper than we expected; market formed bearish Wolfe Wave, that’s why price may yet continue falling down. I opened quite a risky sell order and plan to move stop into the black right after pair rebounds from Wolfe Wave’s upper border.

At H1 chart we can see, that bulls have already reached the 8/8 level. If pair rebounds from it during the day, bears will return to the market. Closest target is at the 6/8 level: if price breaks it, pair will continue falling down.

EUR/JPY

Right after the market opening, pair reached new minimum and I moved stop on my order into the black. I’m planning to close my sell order using Take Profit at the 2/8 level. However, if price breaks this level, I may open sell orders again.

At H1 chart, Super Trends formed “bearish cross”; earlier price rebounded from the 7/8 level several times. Right now, market is being corrected, but may start new descending movement in the nearest future.

SILVER

Silver is moving upwards and trying to rebound from the 8/8 level. In addition to that, price is very close to the already tested trend line, which means that instrument may start, at least, new local descending movement.

The lines at the H4 and H1 charts are completely the same. If price is able to stay below Super Trends and later break the 4/8 level, I’ll increase my short position. However, this trade is quite risky, that’s why I’m planning to move stop into the black right after instrument starts moving downwards.

RoboForex Analytical Department

Article By RoboForex.com

Attention!
Forecasts presented in this section only reflect the author’s private opinion and should not be considered as guidance for trading. RoboForex LP bears no responsibility for trading results based on trading recommendations described in these analytical reviews.


Crude Oil Trading Pushes Price of WTI to 8 Month Low

By HY Markets Forex Blog

Crude oil trading resulted in West Texas Intermediate crude falling to its lowest price in eight months on Jan. 9.

This contract managed to decline in value as traders expressed their concerns about the supply-demand fundamentals that exist for the commodity, according to The Wall Street Journal. These industry participants emphasized that the demand for petroleum fell last week, and that domestically, the production of crude oil recently rose to record levels.

Prices fall to eight-month low

February WTI futures settled at $91.66 a barrel on the New York Mercantile Exchange, which represented the lowest closing price for the contracts since May 1, Bloomberg reported. In addition, brent futures scheduled for February settlement finished the session down 0.7 percent at $106.39 a barrel on the London-based ICE Futures Europe exchange.


Oil Production Surges

On Jan. 8, WTI experienced a 1.4 percent decline, which coincided with data released by the Energy Information Administration, indicating that during the most recent week, 8.15 barrels of crude were produced per day, according to the news source. This represented the highest amount generated since September 1998.

One factor that has helped to bolster the production of U.S. oil companies is advances in available technology, which have made it easier for industry participants to extract the commodity from shale rock formations, The Wall Street Journal reported.

“There’s been a huge increase in domestic crude-oil production,” Adam Wise, who works for Manulife Asset Management in Boston as a managing director, told Bloomberg. “The gains in output should continue. They’ve turned on the spigot and are getting better at finding ways to move the oil to market.”


Libya speculation helps provides headwinds

Another factor that helped stimulate crude oil trading and push the price of the commodity lower was speculation that in the near future, the African nation of Libya will start generating a greater amount of oil, according to Investing.com.

In 2013, the nation’s production of oil was curtailed sharply as protestors helped to hinder operations, the media outlet reported. Amid these challenges, Libya managed to create around 100,000 barrels per day. In 2014, this production has reportedly risen to 650,000 barrels per day. Even though Libya has started generating more oil, the nation is only generating roughly 50 percent of what it is capable of producing.

The Sharara oil field recently resumed generating the raw material, and other locations in the nation have started producing the commodity once again, according to Bloomberg. Ibrahim Al Awami, who is the top official at the oil ministry’s department of measurement and inspection, told the media outlet on Jan. 8 that crude supplied by Sharara will soon by exported by the port of Zawiya, which is located in Western Libya.

The price of oil received a minor boost during the day as a result of production problems in the North Sea, The Wall Street Journal reported. The Buzzard field, which usually generates about 200,000 barrels of oil every day, stopped operating, according to Bloomberg. Operator Nexen Inc. told the media outlet that the the field would soon be producing once again.

“The halt of Buzzard production gave the market a pop,” John Kilduff, partner at New York-based hedge fund Again Capital LLC, told the news source. “Disruptions in North Sea supply have repeatedly boosted prices over the last year.”


Government data indicates surging stockpiles

In addition, government reports indicating the robust stockpiles of oil that the United States has accumulated helped to put downward pressure on the price of the commodity, according to The Wall Street Journal.

Data provided by the EIA revealed that during the week that ended on Jan. 3, a total of 357.9 million barrels worth of oil were held in U.S. stockpiles, Investing.com reported.

In addition, the total reserves of motor gasoline inventories rose by 6.24 million barrels during the period, which was far higher than the increase of 2.28 million barrels that was expected, according to the news source. The existing stockpile of distillate fuel also rose during the week, increasing by 5.83 million barrels.

“We’re still digesting yesterday’s EIA data,” Bob Yawger, who works for Mizuho Securities USA Inc. as director of the futures division, told Bloomberg. “Crude supplies have dropped more than 33 million barrels in six weeks, which is huge. This is being balanced by an avalanche as far as the products are concerned.”

Demand concerns

Many traders have indicated that they are concerned about the demand that exists for distillates and gasoline, according to The Wall Street Journal. The reserves of these two rose by more than expected during the week ending Jan. 3.

“The fundamentals don’t look good,” Phil Flynn, senior market analyst at the Price Futures Group in Chicago, told Bloomberg. “Crude production continues to surge ahead and the refiners are processing this into fuel that is going into storage.”

The post Crude Oil Trading Pushes Price of WTI to 8 Month Low appeared first on | HY Markets Official blog.

Article provided by HY Markets Forex Blog

GBPUSD remains in uptrend from 1.5854

GBPUSD remains in uptrend from 1.5854 (Nov 12, 2013 low), the price action from 1.6593 could be treated as consolidation of the uptrend. Key support is at 1.6337, as long as this level holds, the uptrend could be expected to resume, and another rise towards 1.7000 is still possible. On the downside, a breakdown below 1.6337 support will indicate that the upward movement from 1.5854 had completed at 1.6593 already, then the following downward move could bring price back to 1.6100 zone.

gbpusd

Daily Forex Analysis

Who Says the Federal Reserve is Giving up on Stimulus?

By MoneyMorning.com.au

More than once we’ve explained that it’s important to make predictions when investing.

If you don’t make predictions you’re flying blind with your investments.

You need to predict what you think will happen to a share price…to a sector…to an entire economy.

So folks who say that making predictions about the future is pointless are fools. What would they suggest investors try to predict? The past?

No, you’ve got to predict. And regardless of whether you get the prediction right or wrong, it at least means that you’ve weighed up all the possibilities about what could happen next.

So, what will happen next?

We’ll get to what happens next in a moment.

But when it comes to predictions there aren’t many with a better record of getting them right than our old pal Dan Denning.

In 2007 he told readers of his investment advisory service to sell US stocks just before the market hit the record high and then collapsed. It was a prescient move.

At the end of 2012 he told readers of The Denning Report that the market would likely shift from bonds to stocks in order to benefit from falling interest rates and higher dividend yields. That was pretty much the start of the rally that took stocks to multi-year highs in 2013.

Now Dan is back with his predictions for 2014. You shouldn’t miss his take on where stocks are going next. Go here for more.

Who Says the Fed is Giving up on Stimulus?

As for our view, nothing much has changed.

Our bet remains that Aussie and global stocks have barely started what could be a multi-year (perhaps even a multi-decade) stock rally.

The fact that the Aussie market has lagged many other markets only confirms our belief that the Aussie market has plenty of ground to make up over other national stock markets. That’s why we’re betting on the Aussie market having a standout year in 2014.

But that doesn’t mean it will be risk-free returns. Stories such as this from Bloomberg News suggest we’re still in for a volatile time:

The Federal Reserve will stick to its plan for a gradual reduction in bond purchases, economists said after a government report showed that U.S. employment rose at the slowest pace in three years in December.

The Fed will reduce purchases by $10 billion at each of the next six meetings this year before ending the program in October, according to the median forecasts of 42 economists in a Bloomberg survey.

Suppose the Federal Reserve does cut back its current bond-buying program to zero; it still means the Fed will buy a heck of a lot of bonds between now and October. Let’s do some rough maths. The Fed doesn’t meet on a regular monthly schedule like the Reserve Bank of Australia. The Federal Open Markets Committee (the body that sets the Fed’s interest rate target) meets eight times per year, at roughly six week intervals.

If the Federal Reserve began cutting back its spending each month, here’s how it would pan out:

January – buys US$75 billion – cuts program for February to US$65 billion

February – buys US$65 billion – FOMC doesn’t meet

March – buys US$65 billion – cuts program for April to US$55 billion

April – buys US$55 billion – cuts program for May to US$45 billion

May – buys US$45 billion – FOMC doesn’t meet

June – buys US$45 billion – cuts program for July to US$35 billion

July – buys US$35 billion – cuts program for August to US$25 billion

August – buys US$25 billion – FOMC doesn’t meet

September – buys US$25 billion – cuts program for October to US$15 billion

October – buys US$15 billion – cuts program for November to zero

The cumulative amount of bonds the Fed will buy between now and October would be US$450 billion.

Once again, that’s US$450 billion. Put another way, that a hair’s breadth short of half a trillion dollars. Perhaps you see now why we laugh at the notion that the Fed is somehow cutting the markets adrift.

And remember, this assumes that the Fed follows the expected plan and cuts by US$10 billion at every single meeting. In our view there’s a better than even chance that the Fed doesn’t cut at all some months, just to show the market that it’s ready to step back in and support if necessary.

Bigger Than TARP

We’ll put it another way to make our point.

Do you remember TARP (Trouble Asset Relief Program) back in 2008? It was the big scheme put in place by former US president George W Bush and his Treasury Secretary Hank Paulson.

At the time, the size of the program stunned everyone. Paulson announced the US Treasury would authorise up to US$700 billion-worth of asset purchases. As it turns out, the program ‘only’ spent US$431 billion.

In other words, over the next 10 months the US Federal Reserve will spend more than the entirety of TARP with its bond buying program. So let’s put an end to the idea that the Fed is somehow pulling back on supporting the financial markets.

Remember the name we gave the latest Fed bond-buying program? That’s right, we called it ‘QE Infinity’. We gave it that name because we have no doubt the Fed will keep buying assets and propping up the market. The Fed has made that clear in all its statements.

As have the other central banks such as the European Central Bank (ECB) whose president, Mario Draghi, said the ECB would do ‘whatever it takes‘ to support the markets.

This all goes to support our view that, despite plenty of bumps along the way, stocks will keep rising this year. Even if the Federal Reserve cuts its current program to zero, be in no doubt that another program will emerge if markets get withdrawal symptoms.

So, that’s our prediction for the year. As we mentioned at the top of this letter, it’s important to make predictions. By making a prediction for the year ahead you can judge where you believe the market is heading and how confident you are of your prediction.

We’re certain we’re right. That’s why we recommend buying stocks to potentially benefit from a rising market. But we’re also aware that there are still many problems facing world economies. If things pan out worse than we expect and central banks aren’t quick enough to prop up falling markets then you could see stock prices fall.

Cheers,
Kris+

Special Report:  Three Predictions for 2014

Join Money Morning on Google+


By MoneyMorning.com.au

The #1 Fact Gold Investors MUST Know, Is…

By MoneyMorning.com.au

Gold’s main fundamental relationship over the past 10 years has broken down.

It’s a rude awakening to gold holders. However, understanding this break in the trend is imperative for figuring out gold’s next move – up or down.

Today we’ll take an in-depth look at what’s going on. Avoid this gold update at your own peril!

Most gold bugs won’t see it coming‘ says my colleague Greg Guenthner, editor of the aptly named Rude Awakening.

Unfortunately for them‘ he continues, ‘many of these gold bugs will keep holding – trying to ‘hope’ the losses away – all the way to the bottom.

Although he didn’t specifically come out and say it, I know Mr. Guenther was referencing what I believe is the #1 fact that gold investors must know. That is, you can’t trust the most commonly-listed fundamentals for gold.

Luckily we’ve got a graphic to sum up what I’m talking about.


You see, the seemingly unbreakable 10-year, fundamental relationship between gold and the M2 money supply is done-for. Now that we’ve given the long-term chart some time to shake-out, it’s clear that this is a game-changer.

Point being: the money supply is still rocketing higher, interest rates are abysmally low, the Fed is continuing to pile nearly $1 trillion per year into bond purchases and yet gold prices are floundering.

Gold, from a fundamental standpoint, is now on its own. We can’t count on any semblance of a relationship with the money supply. Frankly we can’t even count on supply and demand data in the physical space – even that’s been a crapshoot lately. In a moment I’ll tell you what gold we CAN count on, but first…

If you didn’t pick up on this trend early in 2011 or 2012, then 2013 was a staunch reminder that the good old days of gold fundamentals are gone. In regard to the chart above, the relationship between the money supply and gold, for now, is dead. You can’t say it any other way.

That’s the great part about analysing the charts. You don’t need to get into the nitty gritty of quantitative easing (QE)…where the money is flowing…or what the new Fed Chairman Janet Yellen is thinking. Instead you can just look at the aftermath. From the chart above you can see that there’s a clear disconnect between a gold bug’s fundamental argument and what’s really happening – a costly disconnect for traders.

In the meantime, if you’re wondering what IS following the money supply higher, the answer is simple: stocks.


Over the past five years The Dow, S&P and Nasdaq have continued a steady move higher. Over the past 24 months these broad-based stock barometers have moved in near lock-step fashion with the Fed’s increased balance sheet.

Indeed, as the Fed continued to utilise its QE policies it was stocks, not gold, that have gained.

Back to our metal discussion, gold is on its own now.

On that note allow me to be clear: Just because gold decoupled from its fundamental relationship doesn’t mean it’s automatically headed lower. No, this does NOT guarantee gold’s demise. Rather, it’s an important factor you MUST consider when investing in gold or gold shares.

You can’t just look at the skyrocketing money supply and assume gold is headed higher.

Same goes with some of the other fundamentals we’ve followed in these pages. Sure, you can tally the physical gold buying world-over, the easy money policies in the US , check your favourite ‘overbought/oversold’ indicators or even look at the US dollar index as an inverse indicator – but over the past 12-24 months none of them would have done us a lick of good.

The single factor that we can count on going forward is simple price action. Until we can latch on to the next meaningful fundamental trend, we’ll have to keep a keen eye on price targets, support and resistance.

The most recent level of important support is the $1,200-level. For gold to make a leap higher we’ll have to see continued support above this level. If gold breaks to the downside – no matter what happens in the fundamentals – we could be in for a rocky road.

To steal a term from Mr. Guenthner above, in the short-term we won’t be able to ‘hope’ the losses away. Keep an eye on prices and beware of latching on to fundamentals – it could prove to be our best advice for the coming year.

Matt Insley
Contributing Editor, Money Morning

Ed Note: The above article was originally published in Daily Resource Hunter.

Join Money Morning on Google+


By MoneyMorning.com.au

Gold Market Traders – New Gold Bull Market Cycle Has Started

By Chris Vermuelen – The Gold and Oil Guy

2013 was one of the worst years for gold in a generation and the strangest part of it is that this loss came during a time in what should have been a banner year for gold.

When the Fed launched its QE1 and QE2 programs, gold posted huge gains but with QE3, we only had a brief rally in late 2012, it’s been all downhill for there.

The price of gold over the last year highlights just how much Europe has become a powerful driver behind gold vs. the US which has historically been the main mover. When the European debt crisis started a few years ago, people fearing a financial meltdown in Europe put a lot of their money into gold as it was the save haven of choice.

However, with financial and political risk in Europe subsiding, we have seen money leave gold and move into other markets, hence the big outflows from gold ETF’s.

Other factors that have dragged on gold over the last year include falling jewelry demand, the loss of its role as an inflation hedge with deflation becoming more of a concern in some areas, also tax increases on gold imports in India, and the supposedly improving economy in the US. All these contributed to the selling of gold.

Gold and gold stocks crashed last year in the summer. They have since been going through a stage one base. This suggests that 2014 will mark the start of a new bull market for gold, gold mining stocks and commodities. The commodity sector as a hole should be your focus in the coming months if you want to be able to invest in something for longer than a few days or weeks and make a huge amount of money be sure to check out my gold newsletter.

Gold Market Traders & Manipulators Provide Contrarian Bullish Outlook

Gold market traders and manipulators like some of the commercial banks/brokerage firms have been verbally slamming gold, and it turns out many are not as negative as lead us to believe…

Goldman Sachs we all know are the biggest hypocrites. While advising clients to sell gold in the second quarter of 2013, they bought a stunning 3.7 million shares of the GLD. And when Venezuela needed to raise cash and sell its gold, guess who jumped in to handle the transaction? Yup, GS! So while they tell everyone to sell gold, they are accumulating as much as they can without being obvious.

There is a lot more reasons and fundamentals to be bullish on commodities and gold, but that is not the point of this technical based report.

Weekly CRB Commodity Index – Bull Market Cycle About To Start

Taking a quick look at the CB index which is a basket of commodities, it looks as though a breakout above its down trend line will trigger a new bull market in the commodity sector. While this has not yet happened it looks s though it may happen in the next few months.

On stock market that recently broke out of a Stage 1 basing pattern (new bull market) is the Toronto Stock Exchange. This index is heavily weighted with commodity based stocks. I talk about this more in my new long-term algorithmic trading newsletter.

Gold Newsletter


In this report I want to show you some interesting charts that are pointing to a new gold bull market cycle which looks to be starting.

The chart below of the gold miner’s bullish percent index is often misread by many traders and trade off its information incorrectly. Many for example think this index is based on stocks trading above a moving average which is no correct.

How a bullish percent index is calculated is based on Point & Figure buy and sell signals with each individual stock within the sector and in our case the gold minders ETF GDX.

Gold prices peaked in 20111 at $1923 an ounce when the gold mining stocks index was above 80%. Why is this important? Because gold stocks typically lead the price of gold in both directions, tops and bottoms.

As of today we have the reverse situation with the bullish percent index at 13% and showing bullish divergence from that of gold stocks. This is an early signal that the new gold bull market cycle is turning up and it should not be overlooked.

Also we see the 5th and final Elliott wave pattern forming and we could once again whiteness another multi year rally in the price of gold.

Gold Mining Bullish Percent Index – Weekly Chart

Elliott Wave Gold Forecast

Gold Miners ETF – Monthly Chart

Gold stocks have not yet broken out to start a rally as you can see in the chart below. But the important thing to note is that the daily chart has formed a mini Stage 1 Basing patterns and could breakout this week to kick start a multi month/year rally.

Gold Market Traders

Gold & Gold Stock Bull Market Conclusion:

If you have been following me for a while, you know I don’t try to be a hero and pick tops or bottoms. We all know that strategy is a losing one over the long run.

Since 2011 I have been a very dormant gold trader. Why? Because the price and technical indicators topped out and confirmed a massive consolidation or bear market was in motion.

With gold, gold stocks and precious metals about to start a new bull market, it is time to get back to trading gold and gold stocks.

You can get my daily gold, silver and gold stock analysis every morning with my gold newsletter and save 50% on your membership by joining today!

Get My Gold & Gold Stock Trading Alerts And Save 50% Today! http://www.thegoldandoilguy.com/signup.php

Chris Vermeulen


EUR/USD Forecast For January 13-17

Article by Investazor.com

The Euro has just past through a ruff week, after it hit a new low for this year, managed to recover and close the week with some modest gain. The single currency tried to keep itself higher in the beginning of the week after the good German economic data, but was hit pretty hard by Mario Draghi, at the press conference, right after the ECB announced that it will keep the interest rate unchanged at 0.25%.

The European Central Bank’s president said that the bank will keep a close look over the money markets to prevent other damage to the Euro and that it will fight the falling inflation, but said nothing about the means of actions. All this triggered a fall for the EURUSD to a new low for the week, and year, under 1.3550.

On the last day of the week, the balance changed once more. The weak Non-Farm Payrolls (74K vs. 196K exp.) weakened the dollar, even though the Unemployment Rate fell 0.3% to 6.7%. The overall data showed that the unemployment rate dropped even though there were not that many jobs added, resulting that the population participation was poor in calculating the rate.

Latest EURUSD Post on Fundamental: Our Outlook for the First Non-Farm Payrolls in 2014

Let us see what are the main events and publications from the Euro Area that could have an impact over this currency pair:

Economical Calendar

Euro Zone Industrial Production – Tuesday (10:00 GMT). In December it fell 1.1% from another 0.2% drop in November, even though it was expected a raise of 0.4%. Last week German Industrial Production rose 1.9% after a 1.2% drop and the French Industrial Production rose 1.3%. If Monday’s Italian Industrial Production will be published at least in line with the expectations of a 0.6% rise, then the probability for the Euro Area I. Production to gain 1.6 percent or more would be quite high, and the Euro could gain on the short run.

Euro Zone Trade Balance Wednesday (10:00 GMT). The Euro Area Trade Balance had a pretty interesting evolution. In October met the analysts expectations, as well as in November when it got to 14.3B. In December was lower than estimates, but still rose to 14.5. This month it is expected to be released 16.7B. Even though it is not a high impact indicator, a big difference of the next publication from the expected number could trigger some volatility for the Euro.

ECB Monthly Bulletin Thursday (09:00 GMT). In December’s Bulleting the ECB stated that it will closely keep an eye on the money markets so that the rates will not affect the Euro Area Economy. They will continue to provide liquidity and maintain their forward guidance. Mario Draghi enhaced these points after the Minimum Bid Release, at the press conference. This month’s Bulletin is expected to state the position of the ECB regarding current inflation and the lack of it.

Euro Area CPI/Core CPI Thursday (10:00 GMT). The inflation rate of the Euro Area it is a key factor for the economic recovery. The ECB is closely following the evolution of the price stability and their main interest is to bring it close to their target. This month’s CPI is expected to be 0.8%, while the Core CPI to raise to 0.9% on y/y basis.

German Constitutional Court Ruling Friday. The German Federal Constitutional Court is due to announce a ruling regarding the constitutionality of the ECB’s Outright Monetary Transactions policy (OMT), in Karlsruhe.

Even though we posted some important factors from the Euro Area, that could move the EURUSD currency pair, it is necessarily to look also over the USA’s economic releases. Because as we saw last week these can also have a big, or even bigger, impact on the price evolution of the pair.

Next week are programmed to be released for US economy:

Monday: Federal Budget Balance – expected to raise with 44.3B;

Tuesday: Core Retail Sales – Exp. 0.4% with a previous growth of 0.4% (Retail Sales Exp. +0.2%); Import Prices – Exp. +0.3% ; Business Inventories – Exp. 0.4%; FOMC members Fisher and Plosser are expected to talk.

Wednesday: PPI m/m – Exp. +0.5% (Core PPI m/m – Exp. +0.1%); Beige Book;

Thursday: CPI m/m – Exp. +0.3% (Core CPI m/m – Exp. +0.1%); Unemployment Claims – Exp. 327K (lower than the previous week’s 330K); TIC Long-Term Purchases – Exp. 42.3B (from 35.4B last month); Philly Fed Manufacturing Index – Exp. 8.8 (from 7.0 in December);

Friday: Building Permits – Exp. 1.01M; Industrial Production – Exp. 0.4% (from 1.1% in December); Prelim UoM Consumer Sentiment – Exp. 83.4 (up from 82.5 last month).

As you can see there are some important publications scheduled next week for the United States, if the numbers will surprise in one way or another EURUSD could get to know an increase in the volatility and fast directional changes.

Technical View

Chart: EURUSD – Daily

eurusd-daily-week13-17-12.01.2014-resize

Daily Support: 1.3400, 1.2700;

Daily Resistance: 1.3800, 1.4000;

On the daily chart the EURUSD continued to draw higher highs and higher lows inside the up channel. This is a clear signal that the uptrend is still in place, at least as long as no lower lows will be touched. On medium term the price has moved in a range limited by the 1.3800 resistance area and the 1.3400 support area.

Chart: EURUSD – H1

eurusd-h1-week13-17-12.01.2014-reseize

H1 Support: 1.3653, 1.3610, 1.3560;

H1 Resistance: 1.3675, 1.3730, 1.3800;

On the H1 (60 min.) chart we can observe that the last week’s price action hit several times the 1.3560 support but is couldn’t get through. On the upper side the price couldn’t break 1.3674 not even after the NFP publication which has disappointed. The two big rising candles from Friday could signal that bulls are in power and might get the price higher.

If we stick to the technicals I would say that a break through the Key H1 Resistance (1.3675) could trigger a rally to the next important level, 1.3730. On the other hand a drop under the Local Support (1.3653) can open the door for another drop of the Euro to 1.3610 support.

Latest EURUSD post on Technical Analysis: EURUSD & GBPUSD Overview, Volume is Picking Up after NYE

Bullish or bearish?

In my opinion EURUSD has a good probability to continue the sideways move noted on the daily chart, between 1.3400 and 1.3800 with no big surprises for the week ahead. In what concerns the lower time frame I believe that for the moment bulls are in power. Some good economic data from the Euro Area combined with some in line or under expectations readings from the USA could be the motive for buying the single currency at least in the first part of the week.


The post EUR/USD Forecast For January 13-17 appeared first on investazor.com.

Weekend Update by the Practical Investor

Weekend Update

January 10, 2014


— VIX made a very deep 84.5%retracement of the rally from its Primary Wave [5] low on December 26.  Preliminary evidence of a reversal may come with a breakout above its January 2 high at 14.59.  Confirmation of a change in trend lies at 16.26 to 16.75.

SPX no longer making new highs.

— SPX made four probes at a new high this week, but failed to overcome daily Cycle resistance between 1843.00 and 1845.00.  The Orthodox Broadening Top, otherwise known as a “Megaphone” pattern, is still the key formation at this juncture.  A decline from this peak through the bottom trendline of the Broadening Top completes the formation and sets up the initial downside target.


(ZeroHedge) Late last night the music may have just skipped a major beat after Goldman released a Friday evening note that is perhaps the most bearish thing to come out of Goldman’s chief strategist David Kostin in over a year, (and who incidentally just repeated what we said most recently a week ago in “Stocks Are More Expensive Now Than At Their 2007 Peak“). To wit:

S&P 500 valuation is lofty by almost any measure, both for the aggregate market (15.9x) as well as the median stock (16.8x). We believe S&P 500 trades close to fair value and the forward

path will depend on profit growth rather than P/E expansion.

NDX closes the week at its trendline.

— NDX closed the week at the upper trendline of its Ending Diagonal formation without making a new high this week.   The 4.8 year rally may now be finished.  Initial confirmation of that would come with a decline beneath the trendline followed by a further decline below the Cycle Top line at 3465.74.


(ZeroHedge)  …David Stockman, author The Gret Deformation, notes Wall Street’s institutionalized fiddle of GAAP earnings made P/E multiples appear far lower than they

actually are, and thereby helps perpetuate the myth that the market is “cheap.”

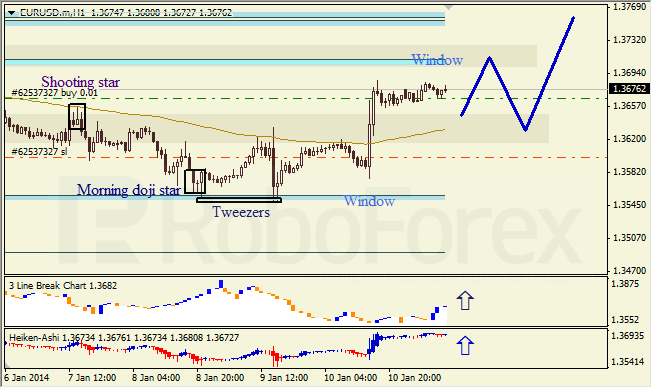
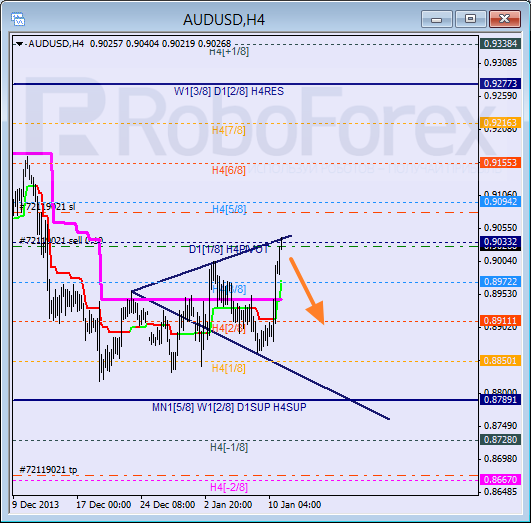
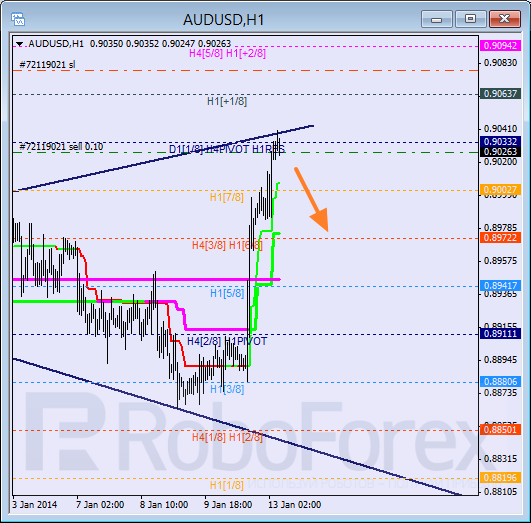
The Euro declines, bounces from weekly supports.


.  


           — The Euro declined to its weekly Intermediate-term support at 136.03, then bounced in a near-50% retracement.  It may be done or nearly so with the retracement and appears ready to resume its decline this week.   Final support is at 133.07 and 130.90, beneath which the Euro decline may accelerate.


(BBCNews)  The President of the European Central Bank, Mario Draghi, has urged MEPs and EU governments to set up a “true banking union”.

Giving evidence to the Economic and Monetary Affairs Committee on 16 December 2013, he said he welcomed the agreement reached last week to set up common rules on a “resolution fund”.  This means that each EU member state will build up a fund to help banks in trouble.

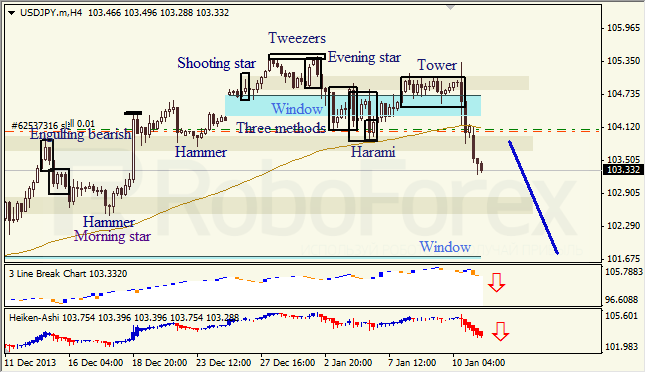
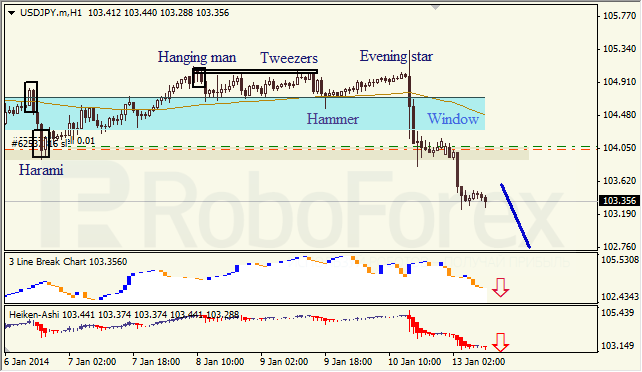
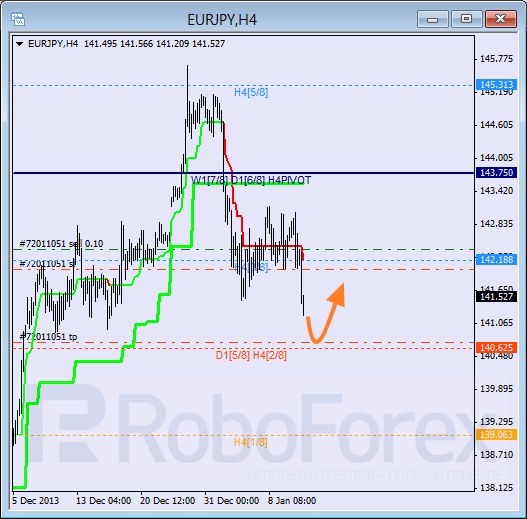
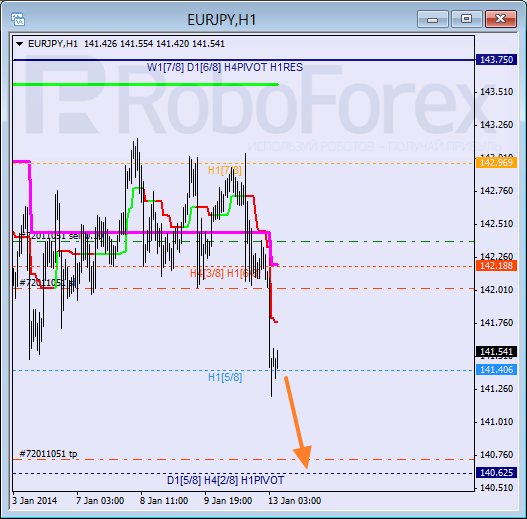
The Yen continues  testing its Head & Shoulders neckline.

–The Yen has tested the Head & Shoulders neckline at 96.00 for a second week.  The breakdown to a new low and the inability to rally above the neckline suggests a continuation of a Primary Wave [5] in a very strong decline that may last through mid-February.


The US Dollar closed beneath mid-Cycle resistance.


— After USD closed above its weekly mid-Cycle support/resistance at 80.98 it pulled back to its weekly Short-term support at 80.64.  The Cycle Model suggests the next phase of the rally lasting through late January that may bring the USD above its inverted Head & shoulders pattern shown in the chart.  Surprised Dollar bears may help make this rally a memorable one.


Here’s one dollar bear’s view…”Central banks around the world are increasingly diversifying their currency reserves away from the US Dollar. Even as overall holdings soar to a record $11.4 trillion, the US Dollar accounted for 61.44% (down from well over 65% at the peak of the crisis in 2008). With China outspokenly concerned at the US Dollar’s future status, we suspect this will only become more ‘diversified’.”


Gold bounces from a new Cup with Handle formation.

— Gold bounced from its new Cup with Handle formation at 1181.40 and appears to have closed at Short-term resistance at 1248.50.  Indications are that gold may turn back down early next week.  A bearish Cup with Handle formation may be triggered beneath the Lip at 1181.40, so be prepared for that probability.   There are simply too many goldbugs who have called for a bottom to be a valid one.  See below.


(ZeroHedge)  It’s been one of the worst years for gold in a generation. A flood of outflows from gold ETFs, endless tax increases on gold imports in India, and the mirage (albeit a convincing one in the eyes of many) of a supposedly improving economy in the US have all contributed to the constant hammering gold took in 2013.  Perhaps worse has been the onslaught of negative press our favorite metal has suffered. It’s felt overwhelming at times and has pushed even some die-hard goldbugs to question their beliefs… not a bad thing, by the way.

Treasuries retest the Broadening Wedge.

— USB bounced from its 32.25-year trendline, testing both the trading channel trendline (blue) and it Broadening Wedge trendline (red).  The Broadening Wedge suggests a probable 20% loss beneath this resistance level.  More importantly, the loss of a long term uptrend is in jeopardy, should it decline beneath 127.35.


(WSJ)  Treasury bond prices rallied Friday as a disappointing employment report diluted concerns that the Federal Reserve could wind down its bond purchases at a faster pace in coming months.

The world’s largest economy added 74,000 jobs last month, the smallest gain in three years and sharply below 200,000 forecast by economists. The report stood in contrast with releases earlier this week that had showed employment gathering speed.

Crude challenges its Head & Shoulders neckline.

— Crude challenged the neckline of its Head & Shoulders formation this week.  It may have more of a bounce next week, but we now have confirmation that a downtrend may already be in place.  Upside movement, should it appear, may be inhibited by the weekly Short-term resistance at 95.63 and mid-cycle resistance at 96.26.

(Reuters) – A fire on a crude oil tanker on a Canadian National Railway Co train that derailed this week in New Brunswick was extinguished by Friday afternoon and CN said blazes on cars carrying liquid petroleum gas (LPG) would be put out shortly.

China approaches its Cycle Bottom.

–The Shanghai Index is approaching its Weekly Cycle Bottom support at 1972.13.  this may set up a bounce next week back to the Model resistance cluster at 2140.93.  Once the bounce is complete, it has a high probability of making some new lows.  The duration of this decline may not be finished until late February to mid-March..

(ZeroHedge)  Overnight China reported disappointing export data, missing expectations of +5%. The government explained this on the basis that they were losing their competitive edge since the Yuan has strengthened to 20 year highs but perhaps most telling is that fact that, as the FT reports, China became the world’s biggest trader in goods for the first time last year – overtaking the US for all of 2013.


The India Nifty caught between support and resistance.

— The India Nifty declined to Intermediate-term support, then bounced to Short-term resistance at 6176.74 this week.  The decline may continue through mid-February.  This decline may be deflationary to an extreme, since equities have become thoroughly saturated with liquidity from India’s central bank and simply cannot absorb any more.  Indian investors are leveraged to the hilt.  The potential for a panic decline to the weekly Cycle bottom (4756.17) is very high.

The Bank Index  reaches its weekly Cycle Top.

— BKX  has reached its weekly Cycle Top resistance at 71.14 this week.  The 50% Fibonacci retracement of its 2007 to 2009 decline is at 69.46 and it is due for a weekly Cycle turn.  The resumption of the secular bear market may be most spectacular in BKX.

(ZeroHedge)  In a memo to employees today, Bank of America has made some ‘improvements’ to its recommendations for analysts and associates working hours…

  • *BOFA ANNOUNCES IMPROVEMENT IN WORKING CONDITIONS FOR JUNIORS

  • *BOFA SAYS JUNIOR BANKERS SHOULD TAKE 4 WEEKEND DAYS OFF A MONTH

(ZeroHedge)  We are sure there is a joke in here somewhere but it is no laughing matter. Following a request for copies of 8 documents  of correspondence between Ireland’s (former) finance minister and the nations’ largest bank executives, the Irish minstry of finance has been forced to admit that it cannot find two out of the eight. The documents, previously 100% redacted, raises questions as to whether other documents have gone ‘missing’. As RTE reports, the Department of Finance said it had carried out a widespread search for the documents and it was not clear why the original versions could not be located. Those darn leprechauns… We are sure, however, it has nothing to do with the Irish banks “picking bailout numbers out of their arses.”

(NYTimes)  In his second-floor office above a hair salon in north Seattle, Ryan Kunkel is seated on a couch placing $1,000 bricks of cash — dozens of them — in a rumpled brown paper bag. When he finishes, he stashes the money in the trunk of his BMW and sets off on an adrenalized drive downtown, darting through traffic and nervously checking to see if anyone is following him.

Despite the air of criminality, there is nothing illicit in what Mr. Kunkel is doing. He co-owns five medical marijuana dispensaries, and on this day he is heading to the Washington State Department of Revenue to commit the ultimate in law-abiding acts: paying taxes. After about 25 minutes at the agency, Mr. Kunkel emerges with a receipt for $51,321.

Regards,

Tony

Anthony M. Cherniawski

The Practical Investor, LLC

P.O. Box 129, Holt, MI 48842

www.thepracticalinvestor.com

Office: (517) 699.1554

Fax: (517) 699.1558


Disclaimer: Nothing in this email should be construed as a personal recommendation to buy, hold or sell short any security.  The Practical Investor, LLC (TPI) may provide a status report of certain indexes or their proxies using a proprietary model.  At no time shall a reader be justified in inferring that personal investment advice is intended.  Investing carries certain risks of losses and leveraged products and futures may be especially volatile.  Information provided by TPI is expressed in good faith, but is not guaranteed.  A perfect market service does not exist.  Long-term success in the market demands recognition that error and uncertainty are a part of any effort to assess the probable outcome of any given investment.  Please consult your financial advisor to explain all risks before making any investment decision.  It is not possible to invest in any index.


The use of web-linked articles is meant to be informational in nature.  It is not intended as an endorsement of their content and does not necessarily reflect the opinion of Anthony M. Cherniawski or The Practical Investor, LLC.  


P.O. Box 129  Holt, MI  48842  (517) 699-1554  Fax: (517) 699-1558

Email: tpi@thepractical