Gold Slips in Thin Holiday Trade, But Hedge Funds “Wary of Being Short”

London Gold Market Report
from Adrian Ash
BullionVault
Mon 2 Sept 07:55 EST

The PRICE of gold bullion bars slipped Monday morning, recovering early $25 drop in quiet dealing as Asian and European stock markets rose following strong manufacturing data.

 With the US markets closed for the end-of-summer holiday, gold edged down to $1389 per ounce by lunchtime in London, just over 3% below last week’s three-month high.

The price of silver meantime whipped around $24.00 per ounce, almost 5% beneath Wednesday’s spike above $25 – the highest level since mid-April.

 Commodity prices fell, as did major government bonds.

 Official PMI data in China meantime showed its manufacturing sector growing at the best rate in 16 months, while the private Markit consultancy’s gauge showed expansion for the first time since April.

 Markit’s PMI data for Italy and Spain leapt ahead of analyst forecasts.

 “Uncertainty on whether or not military action will be taken against Syria has taken off some of gold’s safe-haven bid,” reckons Joni Teves at Swiss investment and bullion bank UBS in London.

 “The recent move in [futures] positioning clearly indicates further reluctance to be short,” says Teves, “as geopolitical tensions add to looming event risks out of the US” such as the possible tapering of Federal Reserve asset purchases, and then the likely debt-ceiling deadline in mid-October.

 Speculators in gold cut the number of bearish bets on US futures and options they held by 24% in the week-ending last Tuesday – the fastest pace since March 2009 – reducing it to near 7-month lows.

 Net of those bearish bets, the so-called “net long” position held by non-industry players rose 173% from a month earlier, its fastest rise since June 2005.

 “First it was short-covering,” said US consultancy CPM Group’s Jeffrey Christian to BNN late last week – “about half of the shorts liquidated. Now you’re seeing some long building, and you’re seeing trend followers.

 “Soon as the price stalls out, and it will, you’ll see those trend followers back off.”

 But “Bullish potential is beginning to emerge,” reckons a technical gold trading note from London market-maker Barclays in London.

 “Price charts highlight the rare occurrence of a strong bullish month on the heels of corrective extremes, which previously led to a significant move higher.”

 Last week’s rise above $1400 per ounce saw “considerably stronger demand” for gold investment bars, says a note from German refining group Heraeus. But “it resulted in lower premiums for physical metal in Asia…and some market participants cashed in on the higher price level.”

 After a surge in first-half sales of gold coins worldwide, the US Mint reported its weakest month in six years for August.

 Sales of American Eagle and Buffalo gold coins halved last month from July 2012.

 “Market players are likely to be focusing most of their attention this week on the European Central Bank’s meeting on Thursday and the publication of the US labour market report on Friday,” says a note from German bullion dealers Commerzbank.

 Meantime in India – the world’s No.1 gold consumer – the government’s raft of anti-gold-import rules have led to a doubling in gold smuggling since April, the Business Standard says today, citing strong flows from neighboring Pakistan and Bangladesh.

 The Reserve Bank of India today denied press reports of a plan to buy gold from households and temples so it could offering it for sale to reduce the country’s annual imports.

 On the supply side, two thirds of the 120,000 gold mine-workers in South Africa – now the world’s fifth largest producer – will begin a two-day strike over pay tomorrow.

 World No.2 Australia grew its gold output by 4.7% between April and July, according to private consultancy Surbiton Associates, adding 3 tonnes from Q2 2012 to produce 67 tonnes.

Adrian Ash

BullionVault

Gold price chart, no delay | Buy gold online


Adrian Ash is head of research at BullionVault, the secure, low-cost gold and silver market for private investors online, where you can buy gold and silver in Zurich or Singapore for just 0.5% commission.


(c) BullionVault 2013

Please Note: This article is to inform your thinking, not lead it. Only you can decide the best place for your money, and any decision you make will put your money at risk. Information or data included here may have already been overtaken by events – and must be verified elsewhere – should you choose to act on it.


E-mini S&P Can Retrace Back to 1667 Before Downtrend Resumes-Elliott Wave Analysis

S&P has been trading sharply lower last week but now showing some evidences of a low around 1625 area which is fine because we already have five needed sub-waves down in wave (A). We know that after every five wave move correction is expected, so recovery or sideways price action in this week should not be a surprise. We are talking about blue wave (B) that could already be underway and may even reach 1667 area before the Friday’s US NFP. After wave (B) pull-back we will be looking for a strong sell-off in wave (C), into a third leg of decline.
S&P 500 4h Elliott Wave Analysis

The important thing that we need to understand now is a five wave of decline from 1705, which means that bearish reversal on stocks is confirmed and that prices will stay in bearish mode for few more weeks, and that any bounce will be temporary and limited with 1705.
Written by www.ew-forecast.com


Try EW-Forecast.com’s Services Free for 7 Days


Asian Shares Mostly In Green On China PMI Data

By HY Markets Forex Blog

Most major Asian shares started the week higher which was driven by the massive above-forecasted Chinese manufacturing PMI, showing that the global economy recovery will increase its pace. While Japan’s benchmark Nikkei index was assisted by the predictions that Japan is expected to host the Olympics along with the weaker yen.

Asian Shares – Japan

Japan’s benchmark Nikkei 225 began the trading week in gains, climbing 1.4% to 13,576.00 points. The index recovered from its Friday’s losses, while investors predict the Japan’s capital may host 2020 Summer Olympics as it would also boost the contraction and real estate sectors. Tokyo is competing with Madrid and Istanbul to host the 2020 Summer Olympics, the final decision is expected to be announced on September 7.

Tokyo’s leading real-estate developer Mitsui Fudosan gained 2.7%, Sekisui House surged 2.35% while Daiwa House Industry advanced 1.36% were among the firms that advanced.

The Japanese yen weakened against the US dollar and traded 0.48% lower at ¥98.57 at the time of writing, increasing the country’s exporters.

Some of the exporters that were assisted by the weaker yen were the world’s largest automaker Toyota Motors advanced 11%, Sony gained 0.3 and Mitsubuschi Electric rose 3.6%.

Japan’s Ministry of Finance announced that the country’s second-quarter capital spending reached the verge between contraction and expansion territory after posting a first-quarter contraction of 3.9%.

Kajima Corporation was the index that advanced the most, edging up 5.7%, while Tokyo Electric Power Company declined 6%.

Tokyo’s broader Topix index rose 1.12% to 1,118.48 points.

Asian Shares – China’s PMI

The trading session in China was mixed as Hong Kong’s Hang Seng rose 1.81% to 22,125.00 points, while the country’s benchmark Shanghai Composite declined 0.16% to 2,101.67 points.

China’s official data showed that the manufacturing Purchasing Manager’s Index (PMI) expanded, advancing from previous reading of 50.3 in July to 51.0 in August.

According to a survey taken by HSBC, the survey showed that August’s figures remained above the 50-point level.

With the better-than-expected PMI data revealed, the banks are expecting a boost in world’s second largest economy.


Interested in trading shares in Asian Markets?  Visit www.hymarkets.com today and start trading from $50! 


The post Asian Shares Mostly In Green On China PMI Data appeared first on | HY Markets Official blog.

Article provided by HY Markets Forex Blog

European Stocks Climbs On Upbeat Data

By HY Markets Forex Blog

European stock indices started the trading week rising on Monday, boosted by the better-than-expected manufacturing Purchasing Manager’s Index (PMI) from China and Spain.

The Pan-European Euro Stoxx 50 index gained 1.50% to 2,768.00 as of 7:31 am GMT, while the German DAX index added 1.51% to 8,225.20 at the same time. The French CAC 40 index rose 1.59% to 3,996.30 and the UK’s FTSE 100 index edged up 1.32% to 6,497.80 at the same time.

A recent data released showed that the Eurozone economy condition is improving at a faster pace than expected.

Spain’s Purchasing Managers Index (PMI) showed an improvement in the country’s industry sector, according to reports from Markit Economics.

Spain’s PMI index rose above the 50 boundary to 51.1, compared to previous reading of 49.8 in the previous month, while analysts predicted a 50.8 rise.

The US markets are closed for Labour Day holiday today.


European Stocks- China Gains

China’s manufacturing activities expanded in August, according to HSBC’s PMI on Monday. Reading for August was in line with the preliminary data released last week at 50.1, rebounding from the previous reading of 47.7 in the previous month. A reading seen above 50 shows a growth in the sector.

Hongbin Qu, co-head of the Asian economic research at HSBC, said the readings shows that China’s manufacturing sector recovery will increase its pace. “This was mainly driven by the initial filtering through of recent stimulus measures and companies’ restocking activities. We expect some upside surprises to China’s growth in the coming months,” Hongbin said.

On Saturday, the US President Barack Obama said that he will request for approval from the Congress before proceeding with any military action against Syria over its alleged use of chemical weapons against civilians.


To find out more on our product offerings, visit www.hymarkets.com and start trading today with only $50!

The post European Stocks Climbs On Upbeat Data appeared first on | HY Markets Official blog.

Article provided by HY Markets Forex Blog

Bankers Profit at the Expense of the Broader Community

By MoneyMorning.com.au

CBA’s record result delivers Narev $7.8m pay cheque’ said a headline in the Business section of The Australian yesterday. According to the article, the CEO’s salary package rose to $2.1m compared to last year. Nice work.

Narev is not an isolated case; bankers around the world are reaping the benefits of stabilised markets courtesy of central banker intervention. 

Don’t get me wrong; if someone genuinely delivers they should share in the spoils. But what irks me is the banking sector (globally) is a protected species. As we witnessed in the GFC, the financial sector is backstopped by taxpayer money. Success is theirs and failure is ours.

Globally the financial sector has grown like topsy over the past two decades and remuneration has followed suit. But has this growth added any real value to the economy?

Paul Volcker (Chairman of the US Federal Reserve from 1979–1987) had this to say recently about the value add from the financial sector: ‘The only financial innovation useful to the country in the last 20 years is the ATM.’

 Volcker has been a long time critic of the hubris in the US financial sector and was recently appointed by President Obama to assist in reforming the imbalances in the system. The tiger he is trying to tame will not be easy as this is an industry that has billions of dollars at stake and powerful political allies.

There is limited data available on the growth in the Australian financial sector so the following figures are from the US. (I suspect the Australian experience will be fairly similar.) In 1965 the financial sector represented 3% of US GDP. By 2009 it had grown to 7.5% of GDP. 

This disproportionate increase in the share of the economic cake was due to the continual drive by institutions to create more lending and investment products from which they could extract an ever increasing amount of fees. For example, in Australia Macquarie Bank was a master at developing a variety of infrastructure funds and receiving multi-million dollar fees for their efforts.

US GDP in 2009 was $14 trillion, so a 7.5% share of this means the financial sector accounted for over $1 TRILLION of US economic activity. What did the US economy (and by extension the global economy) get for this level of activity? The answer is the biggest financial crisis since The Great Depression. The plethora of products that were created to feed this avarice beast were the eventual undoing of the system.

The irony is the industry that created this mess has been the largest beneficiary of government guarantees and taxpayers’ funds. How perverse is that?

The financial ‘innovations’ of the past 20 years that spawned hedge funds, managed funds, sub-prime lending, credit cards, interest free retail loans, private equity funds, collateralised debt obligations (CDO’s), options, futures etc. has been a financial bonanza for a small minority at the expense of the majority.

The financial sector growth was a global phenomenon. Unfettered pursuit of profit at any cost by the British financial sector is the root cause for the severe economic downturn that country has experienced. It will take decades for the British economy to recover.

Iceland also had delusions of converting itself from a fishing village to a financial hub and we know how disastrous this foray into the money world ended. The banking systems in many European countries are in complete disarray after their ill-fated lending policies to Eastern Europe.

In Australia our banking system was rescued by the Government guarantee (of taxpayer money) and the big four banks certainly did not waste this once in a lifetime profit opportunity.

There has been much press given to the banks not previously passing on in full the Reserve Bank of Australia (RBA) interest rate cuts and then raising home loan rates in excess of the official RBA increases, but very little has been said about the excess interest charges the banks have levied against commercial loans.

Graham Turner, CEO of Flight Centre made these comments when announcing his company’s profit results in 2010:

We only have small borrowings but the banks still made life hard. It was on their terms if you needed to do any borrowing in the past year, and that was for everyone, every business with borrowings. There’s only four banks in Australia, and no one else existed there for a while, but they laid down the rules and chose their own margins and those margins quadrupled almost overnight. Most businesses will have long memories as to who they will deal with again.

The banks were ‘shooting fish in a barrel’ after the GFC and this laid the platform for the ever-increasing record profit results delivered in recent years.

In addition to banking, funds management has also been a beneficiary of the burgeoning financial sector. According to research from Ashley Ormond of Investing 101, the pattern of enriching the minority at the expense of the majority is well and truly alive in the fund management world.

Using data supplied by Morningstar research, there are 620 Australian Equity funds that have been in operation for over 7 years.

According to Ormond: ‘Out of the 620 equity funds, of these only 109 funds (or only 18% of funds that have lasted 7 years) have beaten the index consistently over 7 years (i.e. they beat the index over 1,3,5 and 7 years). So 5 out of 6 funds failed to beat the market consistently over 7 years.’ Ormond calculated the average under-performance was minus 2% per annum.

The expanding financial sector has been a gravy train for many people, but the more difficult economic times we are experiencing will hopefully return some normality to the remuneration structure.

The financial sector (banking, funds management, investment banking, insurances etc.) plays a vital role in a developed economy but it must provide value for money. Excessive fee and rate gouging of clients, that is then converted into bonus payments for the privileged few, is no way to endear your industry to the broader community.

Regards,

Vern Gowdie

Join Money Morning on Google+

A Chart That Reveals a lot About The Market

By MoneyMorning.com.au

Will the market go higher?

Or will it go lower?

What’s your bet?

Go on. If you had to bet a meaningful amount of money on the market – an amount that would cause you a mild amount of distress if you got the bet wrong – which way would you go?

Whatever your answer, you probably don’t realise it, but you already make this bet each and every day.

And if you bet wrong on a consistent basis, it could result in more than just mild distress…

It was a great close for the Australian market on Friday.

During a week that started off with fears of a new Middle East war, the market closed down just 30 points compared to the previous Friday.

That’s just over a 0.5% fall.

It’s another example of the market looking for an excuse to go up, rather than an excuse to fall.

You can see that on the following chart…

A Spring Waiting to Uncoil

We’ve shown you a version of this chart before. You can see the range between the highs and the lows narrowing over time:


Source: Google Finance

When the market behaves this way it’s like a coiled spring. It’s compressing as much as possible, just waiting for a reason to uncoil.

And when it does, the market does what you’d expect from a coiled spring; it unravels in a hurry. If the market does as we expect and it truly is looking for an excuse to go higher then our bet is it will be a quick move when the spring uncoils.

That’s why we’re so keen to ensure you invest in stocks. Because when this market moves it will move fast.

However, by now you should also know that your editor isn’t a cheerleader for the market. We know there are some big risks, and if you don’t know that you’re setting yourself up for a bunch of trouble…

Low Interest Rates Forces Investors to Buy Dividend Stocks

The newest member of the Money Morning team, Vern Gowdie, says it’s an extremely risky time to buy stocks. Why? He rightly points out that the huge expansion of credit is a major reason for the 40-year rally in stocks.

But now the credit boom is over (or nearing its end) the next move for the market should be down as we enter what Vern calls ‘the Great Contraction’.

Vern warns that unprepared investors will suffer greatly. He’s especially worried about those who have bought dividend stocks to earn an extra couple of percent in income.

We take a slightly different view to Vern. We say that investors can’t afford not to invest in dividend stocks due to low interest rates. But it is a risk.

In some cases the upside for dividend stocks may only be the extra 2-3% you can earn from dividends compared to cash. On the flipside, the downside could be 20%, 30% or 50% if the dividend rally ends and stocks fall.

This is what we alluded to at the top of this letter.

But let’s get to our point. If we asked you today to bet $50,000 on the market’s direction, you’d probably tell us to take a hike. You’d probably even say you don’t gamble apart from the Melbourne Cup.

But if you’ve got a $50,000 share portfolio, gambling is exactly what you’re doing.

If you’ve got a $10,000 share portfolio, then you’re making a $10,000 bet on the stock market. If you’ve got a $1 million share portfolio, then you’re making a $1 million bet on the stock market.

Sure, it’s not like betting on the nags or the dogs where you’ll lose your entire stake if you lose the bet. But make no mistake, it’s still a bet.

You Could Make or Save Thousands Every Day

In Money Morning throughout this week we’ll focus on the risks of betting on a market that’s trading around a key level.

We’ll look at ways to minimise your risks from an adverse market move.

The most obvious strategy is to not own stocks at all. Although that strategy itself involves risks. That is, the opportunity cost of not owning stocks.

If the stock market takes off and you’re still holding cash there’s a chance you won’t have grown your wealth enough to allow you to live a comfortable retirement.

Of course, on the other hand if you’ve got too much in stocks and the market falls, then likewise you could find yourself with much less in retirement than you need.

That’s the view Vern Gowdie takes right now. He says the market is just in a short-term bull rally that’s part of a secular bear market…a market that could see stocks fall 90% in the coming years.

There’s no doubt it’s a confronting and bold call. But it’s one that every investor should take note of. As we say, our view is that stocks will soon take off (perhaps this weekend’s election will be the event to uncoil the spring), but it’s also important to make sure you know all the potential risks.

After all, when you’re making a big bet on the stock market every day, like betting on the horses, you’ve got to know the market’s form. It could be the difference between making or saving hundreds, if not thousands, of dollars every day.

Cheers,
Kris+

Join Money Morning on Google+

Special Report: GET OUT & STAY OUT

Australian Small-Cap Investigator:
How to Make Big Money from Small-Cap Stocks

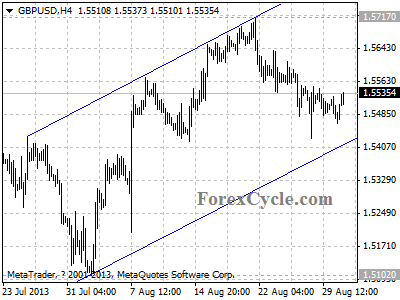
GBPUSD is facing channel support

GBPUSD is facing the support of the lower line of the price channel on 4-hour chart. As long as the channel support holds, the fall from 1.5717 could be treated as consolidation of the uptrend from 1.4813 (Jul 9 low), one more rise towards 1.6000 is still possible after consolidation. Initial resistance is at 1.5560, a break above this level will signal completion of the downward movement from 1.5717, then further rise to test 1.5717 resistance could be seen. On the downside, as long as 1.5560 resistance holds, another fall to test the support of the channel is possible, a clear break below the channel support will suggest that the uptrend from 1.4813 had completed at 1.5717 already, then the following downward movement could bring price to 1.5000 zone.

gbpusd

Provided by ForexCycle.com

Monetary Policy Week in Review – Aug 26-30, 2013: Brazil, Indonesia raise rates, Hungary and Angola cut, 5 on hold

By www.CentralBankNews.info
    Last week two major emerging market central banks, Brazil and Indonesia, raised their policy rates to stem the decline in their currencies and counter growing inflationary pressure while Hungary and Angola cut rates and five other central banks maintained rates.
    Both Brazil and Indonesia raised rates by 50 basis points as international investors continued to shift funds toward advanced economies in anticipation of improving economic growth, illustrated by the U.S. Federal Reserve’s tapering of quantitative easing later this year, possibly already in September.
    India and Turkey, the other two countries that are facing similar issues as Brazil and Indonesia, have so far maintained their policy rates but economists believe it is only a question of time before rates are raised and prospective returns are improved given the unrelenting pressure on their currencies.
    Although Turkey raised its overnight lending rate in July and August by a total of 125 basis points, the main policy response of Turkey and India has been to use a combination of currency intervention, liquidity management and macro prudential measures to limit the slide in their currencies.
    One question hovering over financial markets is whether the effect of the sudden reversal of years of currency inflows to emerging markets will trigger balance of payments’ crises in one of these countries,  reawakening the fears and memories of 30 years of financial crises in emerging markets.
    So far the answer is no.
    First, most of the exchange rates in major emerging markets are no longer fixed, which means the central banks don’t have to exhaust their reserves in a futile defense.
    Second, foreign currency reserves of emerging market central banks are vast in comparison with the late 1990s and cooperation among central banks in Asia is much deeper, illustrated by Indonesia’s currency swap agreement with the Bank of Japan last week.
    Third, government debt in Indonesia, India and Brazil is not that high and mainly denominated in local currency.
   
    Through the first 35 weeks of this year, global policy rates have been raised a total of 17 times, or 5.1 percent of this year’s 331 policy decisions taken by the 90 central banks followed by Central Bank News, up from 4.7 percent the previous week.
    Brazil and Indonesia have raised their policy rates seven times this year by a total of 300 basis points, accounting for all the rate rises by emerging market central banks. The other 10 rate rises this year have taken place in frontier markets and other markets.
    The growing number of rate rises illustrates that global policy rates may have bottomed out this year. Nevertheless, Hungary and Angola’s rate cuts show that the global trend toward lower rates is still intact, with rate cuts accounting for 24.8 percent of this year’s policy decisions at the end of last week, unchanged from the previous week.
    The other five central banks that maintained their rates this week included Colombia, Zambia, Moldova, Fiji and Israel. Noteworthy was Zambia’s reference to a slight increase in copper prices on the back of better Chinese imports in recent weeks.

LAST WEEK’S (WEEK 35) MONETARY POLICY DECISIONS:

COUNTRYMSCI             DATE              RATE       1 YEAR AGO
ISRAELDM1.25%1.25%2.25%
HUNGARYEM3.80%4.00%6.75%
BRAZILEM9.00%8.50%7.50%
INDONESIAEM7.00%6.50%5.75%
MOLDOVA3.50%3.50%4.50%
FIJI0.50%0.50%0.50%
ANGOLA9.75%10.00%10.25%
ZAMBIA 9.75%9.75%9.00%
COLOMBIAEM3.25%3.25%4.75%

    This week (week 36) 11 central banks are scheduled to hold policy meetings, including those from Australia, Morocco, Kenya, Poland, Canada, Japan, Malaysia, the United Kingdom, the Eurosystem, Sweden and Mexico.
    Events this week are also likely to be dominated by the Group of 20 leaders’ summit in St. Petersburg, Russia on Sept. 5 and 6.
    Apart from the controversial issue of international intervention in Syria, leaders of the BRICS group – Brazil, Russia, India, China and South Africa – are reported to be ready to agree on some type of fund that can help its members with any short-term liquidity pressures.
    From press reports, however, it is not clear whether this is the same institution that the five leaders agreed to launch at their March summit in South Africa. At that meeting, the BRIC leaders agreed to launch a New Development Bank with capital of $100 billion to help finance infrastructure.

COUNTRYMSCI             DATE              RATE       1 YEAR AGO
AUSTRALIADM3-Sep2.50%3.50%
MOROCCOEM3-Sep3.00%3.00%
KENYA3-Sep8.50%13.00%
POLANDEM4-Sep2.50%4.75%
CANADADM4-Sep1.00%1.00%
JAPANDM5-Sep                N/A0.10%
MALAYSIAEM5-Sep3.00%3.00%
UNITED KINGDOMDM5-Sep0.50%0.50%
EUROSYSTEMDM5-Sep0.50%0.75%
SWEDENDM5-Sep1.00%1.25%
MEXICOEM6-Sep4.00%4.50%

Stochastic Oscillator Trend and Range Strategy

Article by Investazor.com

The strategy that we propose it can be used for trading on the trend but also in the range. It doesn’t matter on which currency it is applied or time frame, but from our back testing it seems to be working better on the one hour charts.

The strategy uses a Stochastic Oscillator with 14, 3 and 3 periods.  Beside the well-known levels of 80 and 20 that are used with this oscillator, must be added also 90 and 10. First step would be to identify the trend, this it can be used the price action (looking for the higher highs/higher lows or lower highs/lower lows) or a slow moving average.

In the next example we will use a down trend, but the strategy can be used for up trends and range, when the trend is down the trader should take into account only the selling signals. The signal is a crossover of the Stochastic above the (or touches) 90 level. The confirmation comes when the Stochastic falls back under 80.

The entry point for this strategy is on the next candle after the Stochastic dropped under 80. The Stop Loss is to be set above the high, made by the price. The first exit point of this strategy is when the Stochastic touches the 50 level and the second, and mostly use, when the Stochastic touches the 20 level. (On an ascending trend, everything is mirroring.)

forex-trading-strategy-with-stochastic-oscilator-01.09.2013

The post Stochastic Oscillator Trend and Range Strategy appeared first on investazor.com.