Do You Want to Be Right About Investing, or Do You Want to Make Money?

By MoneyMorning.com.au

You’ve got a choice: you can either be right, or you can make money.

Perhaps you’re wondering what the heck we’re talking about.

Of course you want to make money.

You’ll make money because you correctly predict something, right?

Unfortunately, that’s not always how investing works.

And we’ll explain why today. Because if you get this right, you can avoid one of the biggest mistakes most investors make…

Most investors and so-called experts like to predict things.

They like to give you a year-end target for the Aussie index, the Dow Jones or the FTSE 100.

They like to give you a target for the Aussie dollar.

They like to predict where gold, silver or iron ore will be twelve months from now.

And that’s fine. Heck, we enjoy making predictions too. It’s fun. It’s all part of investing. In fact if you don’t make predictions about the future you’ve got no business investing.

Investing without making predictions about the future is like driving with a blindfold…you wouldn’t do that, so why invest without thinking about the future?

The problem is most investors make a prediction about the future and invest accordingly, without really thinking it through. If this all sounds too complicated, let us explain…

The 2004 Bust That Never Happened

Back in your editor’s broking days during the 2003 to 2007 bull market we had a number of clients who were convinced the market was set to collapse.

Bear in mind that March 2003 was the bottom of the market following the dot-com boom that had turned to a crash three years before. The US had just invaded Iraq and investors assumed a quick ‘victory’ would spur another bull market.

It turns out the ‘victory’ wasn’t so quick. But that didn’t stop the market soaring…thanks to near-zero percent interest rates in the US. This helped the market get the credit-fuelled boom it was looking for.

The low interest rates, credit boom and certain technical indicators (Gann and the Elliot Wave as we recall) had these investors convinced the market would crash before another boom could get going.

And credit to these guys. They put their money where their mouth was and punted on a collapse. Most of them were pretty sensible about it. They knew it wouldn’t happen tomorrow or the next day, so they bought long dated put options on the US market.

By long dated we mean one year options. In investing that’s a long time. But in hindsight buying one-year put options in 2003, banking on a collapse in 2004…well, it wasn’t long enough.

You see, in one way these guys were right…they were absolutely right. And they were smart too. They were much smarter than 99% of the Wall Street and Martin Place analysts who didn’t see the crash coming.

These investors believed in sound money. They knew the US Federal Reserve was creating the mother of all asset bubbles. But despite being spot on about what would happen, they were absolutely wrong about how best to make money from it.

It’s all very well predicting an economic and stock market collapse, but what if the market hangs in there much longer than you think? That’s exactly what happened…

Don’t Miss the Opportunity of a Rising Market

To be honest, we had some sympathy with the investors who wanted to bet on a total collapse. In 2003 we just couldn’t see how the market would ever get back to the dot-com highs. It seemed like the era of growth was over.

But when the market started to grind higher, we also saw there was an opportunity to make money…regardless of whether we thought the boom was justified or not. Our biggest bet was on oil.

At the time oil was around USD$40 a barrel. Most people thought the oil price would fall as Iraqi oil came back online. We had a different view. We thought the trend would be higher as OPEC nations got a taste for high oil, and as the US encountered what we expected to be an energy crisis.

(Back then we hadn’t figured on the transformative impact of shale oil and gas.)

As you know, eventually the oil price hit USD$140 as Hurricane Katrina hit Gulf of Mexico oil production. But despite that disastrous event, world stock markets would go higher for another two years.

The point we’re making is this: you can be right about the future but still get the investing angle wrong if you don’t take all the market factors into account.

What the bearish investors didn’t take into account was the impact of low interest rates on the economy and mainstream investors. They didn’t bank on homeowners using their home as an ATM by borrowing to increase their disposable income.

And they didn’t take into account the impact that would have on corporate America…the increase in revenues, the increase in profits. They didn’t factor in the willingness of China to buy US government bonds that would allow America to keep spending and spending.

It was, for a time, a virtuous circle…until it became a death spiral when the market collapsed. But by then, even for those investors who made a profit as the market collapsed, it came nowhere near making up for the opportunity they missed by not buying into a rising market four years earlier…

Bragging Rights Aren’t Worth a Penny

Bottom line: we can’t know for certain, but it’s possible that the Aussie, US and European markets could keep going up for another one, two or three years. On the other hand they could collapse tomorrow.

That means if you’re pessimistic about the future you’ve got a choice.

You can cheer for it and be right when it happens (even if that’s three years from now). Or you can understand the lengths that central banks will go to make sure the collapse doesn’t happen on their watch.

Remember that Alan Greenspan worked his magic for nearly 20 years to avoid complete collapse. And despite the 1987 crash, the Dow Jones Industrial Average gained 367% while he was US Federal Reserve chairman.

It’s great to get a prediction right. You get a lot of bragging rights. Unfortunately, bragging rights aren’t worth much in retirement when you haven’t made a penny from investing.

So our advice is if you want to make money as an investor, put the bragging rights to one side and learn how to use the information available to you to make money from investing.

Cheers,
Kris

Join me on Google+

From the Port Phillip Publishing Library

Just Discovered: The Pangaea Bond

Daily Reckoning: When the Bernanke Bluff is Called

Money Morning: Why Aristotle Still Matters to Traders and Investors

Pursuit of Happiness: Exclusive: Your Eight-Point Wealth Protection To-Do List

Cheers,
Kris

Join me on Google+

What the US Sequester Means for Your Money

By MoneyMorning.com.au

Try as it might, Europe doesn’t have a monopoly on dysfunctional politicians.

Over in the US, squabbling politicians can’t agree on how to run the country’s budget.

Because of the way the US system works, that means we can expect any amount of disruptive brinksmanship in the year ahead, as each of the two parties tries to paint the other as the baddies.

It also means that you’re going to be hearing a lot about the ‘sequester‘ over the next few weeks (maybe months if we’re really unlucky).

So what is it? And more importantly, does it matter for your money?

The Story of the Sequester

In 2011, the Democrats and the Republicans were trying to hammer out a way to bring the US government’s finances back onto a sustainable path.

Like many developed nations, the US is spending more each year than it makes in taxes. Its current deficit – the annual overspend – is over $1 trillion. Its overall national debt is around $16.6 trillion.

As Robert J Samuelson notes in the Washington Post, depending on how you measure it, the debt-to-GDP ratio could be anything from 73% (if you take the most common measure) to more than 200% (if you include various government guarantees to the financial sector).

To put that into some perspective, sovereign debt experts Carmen Reinhart and Kenneth Rogoff suggest that an economy starts to run into real problems when a debt-to-GDP ratio rises above 90%. This is a very rough and ready theory. But the basic point is that the US – like lots of other economies – needs to start living within its means more.

But how do you do it? To cut a long story short, the Democrats would prefer to make ends meet by raising taxes. The Republicans would prefer to cut spending. And within the overall budget, there are lots of areas that are sacrosanct to one side or the other (like defence, or ‘entitlements’ spending).

In the end, they couldn’t reach a deal. So instead they put together a package of automatic cuts – the sequester – that would kick in if they didn’t reach a deal.

The idea was that the cuts would be so indiscriminate and uncomfortable for both sides, that politicians would feel forced to find a better way. This was always a long shot. Perhaps if the sequester had included a clause that would cut their own wages in half, they might have been more motivated. But oddly enough, that sort of measure never made it into the package.

As it is, they still haven’t reached a deal. $85bn is set to be cut from government spending this year. Over the decade, the cuts add up to $1.2 trillion.

So how much does this matter, if at all?

An Arbitrary Deadline that Won’t Be the Last

Markets certainly seem quite relaxed about all this. The Italian election rattled them, but there’s been no obvious panic about ‘sequestration’. There are a few good reasons for that.

Firstly, these cuts don’t happen all at once. This isn’t like the ‘fiscal cliff’. The last minute panic over that was to avert tax rises that would have taken effect immediately. The cuts will take place over several months. So there’s plenty of time for politicians to keep arguing.

Secondly, it’s not entirely clear what the eventual impact of the cuts will be.

Both the Democrats and the Republicans have every incentive to lie about the scale of the disruption, to make the other side look bad. Also, the departments affected by the cuts might change if a new deal is reached.

Thirdly, and more importantly, there’s a bigger deadline looming. On March 27th, the US needs to agree a budget for the year ahead or else the federal government could shut down altogether. The current optimistic hope is that both parties will be able to use this much more obvious deadline to come to some sort of compromise.

So markets probably won’t start to fret until closer to the end of the month. But as the March 27th deadline approaches, and it becomes clear that politicians will be arguing down to the wire, you can expect to see another fit of the jitters.

And then, beyond that, there’s the whole argument over the overall debt ceiling again. Which is what kicked the whole sequester deal off in the first place back in 2011.

What This Means for Your Money

There is unlikely to be a single catastrophic blow-up over the US government’s finances in the near future. And all the fighting just gives Ben Bernanke more of an excuse to keep the quantitative easing taps open.

However, it’s possible that individual sectors might end up running into trouble depending on where the cuts fall. Also, the latest US economic growth figures have been on the disappointing side. With more political gridlock ahead, it’s quite possible that companies and consumers will be feeling less upbeat in the months to come. There might be further growth shocks to come.

This might not be an issue if US stocks were pricing in the potential bad news. But they’re not. While European and Japanese stocks look cheap enough to discount many of the risks facing those regions, US stocks aren’t – indeed, they’re almost at record highs. So as usual, we’d suggest you stick with the cheaper markets.

John Stepek
Contributing Editor, Money Morning

Publisher’s Note: This article first appeared in MoneyWeek

Join Money Morning on Google+

From the Archives…

Gold’s Dark Hour Before Dawn
1-03-2013 – Dr. Alex Cowie

The Primary Colours of Investing
28-02-2013 – Kris Sayce

Revealed: Inside a Share Trader’s Den
27-02-2013 – Murray Dawes

Where to Find Value in this Rising Stock Market
26-02-2013 – Kris Sayce

China Bull Versus China Bear – There Can Only Be One Winner
25-02-2013 – Dr. Alex Cowie

The Global Economy, Ketchup and Gold

By MoneyMorning.com.au

It’s fair to say that the US economy is showing an improved heartbeat, compared with recent quarters and years.

There’s even the proverbial ‘big news’ on Wall Street. Last month, for example, Warren Buffet’s $23 billion take-over play for the H.J Heinz Co., an iconic food brand.

Is the Buffet play for Heinz a harbinger of better days ahead for stock markets generally, versus the future fortunes of the world’s flinty gold buyers? Even more optimistically, will this takeover play kick off the next nirvana for deal-makers?

Well, let’s give Herr Buffet credit for his excellent sense of timing. He’s a great picker of old-line companies with durable names, competitive advantages and predictable earnings. That’s Buffet’s gig, and he’s very good at this game.

Still, let’s take a clear look at what Buffet is buying. H.J Heinz is global, to be sure, but not really ‘international’ in the way that, say Boeing or General Electric arc across the world. That is, Heinz is mostly a trans-national collection of local facilities.

The basic business model for Heinz is to own food-processing factories in dozens of countries. Heinz buys into local and regional brands, across a multitude of nations, ethnicities and cultures.

Heinz then produces products derived from local agriculture, under tight hygienic standards, and emplaced into cans and bottles. In other words – and as the people who work at Heinz will be the first to tell you – it just doesn’t pay to ship tomato-flavoured water, in bottles and cans, all that far.

So Buffet buying Heinz is good news, in many respects, to deal-maker wannabes. Heck, any big deal is a good deal, as long as the bankers and lawyers get their fees.

Yet the Buffet-Heinz hook-up seems limited in scope. It reflects an evolving world economy at, literally, the grass-roots level. More and more people have more and more money to buy higher quality, branded food items from factories that are located not too far away. That’s good, but it’s not necessarily the signal for a new global boom.

How’s that Global Economy?

Aside from the market for beans and ketchup, how’s that global economy doing? I can’t help but ponder some strange bits of information I keep seeing.

For example, last year the German central bank asked the US Federal Reserve to arrange an audit of German gold on deposit in the US. The Fed people declined to permit that. Odd, right?

Then in January, the Germans asked for part of their gold hoard back from the Fed bank in New York. And despite the fact that there are plenty of armoured cars around, and many daily air flights across the Atlantic Ocean, it’ll take seven years for the Fed to make the gold transfer. Like I said, it’s strange. Or, not to put too fine a point on it, where’s the gold?

Here’s something else. Consider Russia’s Vladimir Putin, and his effort to acquire gold for the Russian central bank.

Under Putin, Russia’s central bank has added 570 metric tons of gold to its asset base over the past decade, a quarter more than runner-up China, according to data from the International Monetary Fund (IMF), as compiled by Bloomberg News. (China’s gold holdings are MUCH larger than they admit to, I suspect, which is the subject of a major new trend I’m developing.)

Just last year, in 2012, Putin made news when he stated that the US is ‘endangering the global economy’ by abusing its dollar monopoly. Perhaps it’s bluster, but then Putin is putting money where his mouth is.

Late last year, Putin instructed the Russian central bank not to ‘shy away’ from buying gold, according to a press release from the Kremlin. ‘After all,’ said Putin, ‘they’re called gold and currency reserves for a reason.’

Looking ahead, the Kremlin plans to keep on buying gold. According to Russia’s first deputy Alexei Ulukayev, ‘The pace [of gold buying] will be determined by the market.’ He added, with characteristic Russian secretiveness, ‘Whether to speed that [buying] up or slow it down is a market decision, and I’m not going to discuss it.’

Too Big to Sail

So could things change quickly in the precious metal markets? Could metal prices melt-up from the current levels? Yes, because human psychology can change quickly.

As a rule, people act on what they know. Right now, a lot of people seem to think that the world economic system is working alright. Buffet bought Heinz, right? Sure, the world economy could be better. But generally, the evidence indicates that the world economic system does the job, day to day. At least, goes the thinking, the economy is not falling apart.

Yet consider the passengers on last month’s ill-fated Carnival cruise ship that just pulled into Mobile harbor. Last week, everyone was looking forward to a nice, relaxing Caribbean vacation afloat. What could go wrong?

Then the ship had an engine failure. Within hours – certainly by the second day – people descended to pushing and shoving over stale onion sandwiches.

What do stale onion sandwiches have to do with the price of silver or gold? Well, do you usually eat stale onion sandwiches? Do you expect to eat stale onion sandwiches when you’re on a luxury cruise ship, with storage lockers below-decks, filled with provisions?

When things go awry, however, the previous rules go away. Yes, the cruise ship had food in the hold, but nobody could use it. There was no power to run the kitchen, let alone to cook and serve meals. People descended in a hurry, and gave the media a true spectacle.

What’s the analogy? Well, perhaps some of these new cruise ships are just too big to sail, in the same way that many large banks are too big to fail – until they actually fail. Then we can all fight over the stale onion sandwiches.

Byron King
Contributing Editor, Money Morning

Join Money Morning on Google+

From the Archives…

Gold’s Dark Hour Before Dawn
1-03-2013 – Dr. Alex Cowie

The Primary Colours of Investing
28-02-2013 – Kris Sayce

Revealed: Inside a Share Trader’s Den
27-02-2013 – Murray Dawes

Where to Find Value in this Rising Stock Market
26-02-2013 – Kris Sayce

China Bull Versus China Bear – There Can Only Be One Winner
25-02-2013 – Dr. Alex Cowie

Gold, Oil & the SPX Trends and Setups

By Chris Vermeulen, GoldAndOilGuy.com

Over the past year my long term trends and outlooks have not changed for gold, oil or the SP500. Though there has been a lot of sideways price action to keep everyone one their toes and focused on the short term charts.

As we all know if the market does not shake you out, it will wait you out, and sometimes it will do both. So stepping back to review the bigger picture each weeks is crucial in keeping a level trading/investing strategy in motion.

The key to investing success is to always trade with the long term trend and stick with it until price and volume clearly signals a reversal/down trend. Doing this means you truly never catch the market top nor do you catch market bottoms. But the important thing is that you do catch the low risk trending stage of an investment (stage 2 – Bull Market, Stage 4 Bear Market).

Lets take a look at the charts and see where prices stand in the grand scheme of things…

Gold Weekly Futures Trading Chart:

Last week to talk about about how precious metals are nearing a major tipping point and to be aware of those levels because the next move is likely to be huge and you do not want to miss it.

Overall gold and silver remain in a secular bull market and has gone through many similar pauses to what we are watching unfold over the past year. As mentioned above the gold market looks to be trying to not only shake investors out but to wait them out also with this 18 month volatile sideways trend.

A lot of gold bugs, gold and stock investors of mining stocks are starting to give up which can been seen in the price and selling volume for these investments recently. I am a contrarian in nature so when I see the masses running for the door I start to become interested in what everyone is unloading at bargain prices.

Gold is now entering an oversold panic selling phase which happens to be at major long term support. This bodes well for a strong bounce or start of a new bull market leg higher for this shiny metal. If gold breaks below $1500 – 1530 levels it could trigger a bear market for precious metals but until then I’m bullish at this price.  I think we could see another spike lower in gold to test the $1500- $1530 level this week but after that it could be off to the races to new highs.

GoldWeekly


Crude Oil Weekly Trading Chart:

Oil had a huge bull market from 2009 until 2011 but since then has been trading sideways in a narrowing bullish range. I expect some big moves this year for oil and technical analysis puts the odds on higher prices.  If we do get a breakout and rally then $130 will likely be reached. But if price breaks down then a sharp drop to $50 per barrel looks likely.

OilWeekly


Utility  & Energy Stocks – XLU – XLE – Weekly Investing Chart

The utility sector has done well and continues to look very bullish for 2013. This high dividend paying sector is liked by many and the price action speaks for its self… If the overall financial market starts to peak then these sectors should hold up well because they are services, dividend and a commodity play wrapped in one.

XLURally

XLERally 


SP500 Trend Daily Chart:

The SP500 continues to be in an uptrend which I am trading with until price and volume tell me otherwise. But there are some early warning signs that another correction or a full blown bear market may be just around the corner.

Again, sticking with the uptrend is key, but knowing what to look for and prepare for is important so that when the trend does change your transition from long positions to short positions is a simple measured move in your portfolios.

SPYTrend


Weekend Trend Conclusion:

In short, I remain bullish on stocks and commodity related stocks until I see a trend change in the SP500.

Energy sector is doing well and looks bullish for the next month. As for gold and gold miners, I feel they are entering a low risk entry point to start building a new long position. Risk is low compared to potential reward.

When the price of a commodity or index trade near the apex of a narrowing range or major long term support/resistance level volatility typically increases as fear and greed become heightened which creates larger daily price swings. So be prepared for some turbulence in the coming weeks while the market shakes things up.

If you like my work then be sure to get on my free mailing list to get these each week on various investments for investment ideas at www.GoldAndOilGuy.com

Chris Vermeulen


COT Forex Speculators: US Dollar bets jumped last week to highest level since July

By CountingPips.com

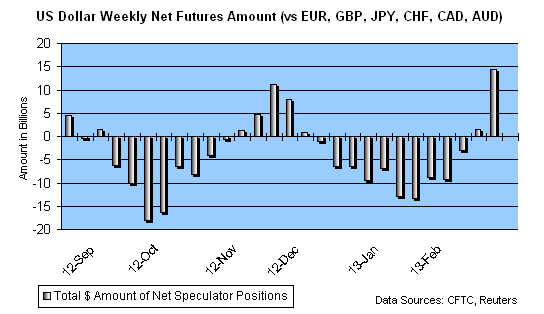
The latest weekly Commitments of Traders (COT) report, released on Friday by the Commodity Futures Trading Commission (CFTC), showed that large futures traders sharply increased their bets in favor of the US dollar last week and brought the American currency’s overall long position to the highest level in seven months.

Non-commercial large futures traders, including hedge funds and large International Monetary Market speculators, registered an overall US dollar long position of $14.39 billion as of Tuesday February 26th. This was a change from a total long position of $1.481 billion that was registered on Tuesday February 19th, according to the CFTC’s COT data and trader position calculations by Reuters, which calculates the dollar positions against the euro, British pound, Japanese yen, Australian dollar, Canadian dollar and the Swiss franc.

The non-commercial large trader position in the dollar has now improved for three straight weeks and is at the highest level since July 24, 2012, according to Reuters.

cot-values-usdollar


Individual Currencies Large Speculators Futures Positions:

The individual currency contracts quoted directly against the US dollar last week saw just a slight improvement for the Japanese yen while the euro, British pound sterling, Swiss franc, Australian dollar, New Zealand dollar, Canadian dollar and the Mexican peso all had a declining number of contracts compared to the previous week.

Individual Currency Charts:

EuroFX:
eur

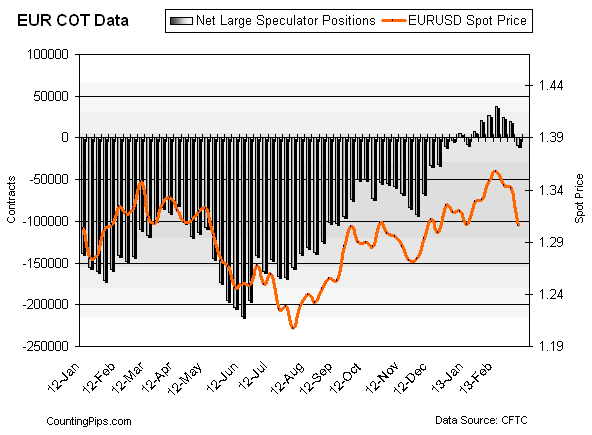
EuroFX: Large trader and speculator sentiment for the euro fell somewhat sharply last week to drop for a third straight week as euro positions crossed back over to a negative bearish position. Euro contracts decreased to a position of -9,394 contracts in the data reported for February 26th following the previous week’s total of +19,103 net long contracts on February 19th.

Euro spec positions are now back on the bearish side after turning bullish on January 15th and reaching a recent high level of +37,952 contracts on February 5th.


Great Britain Pound:
gbp

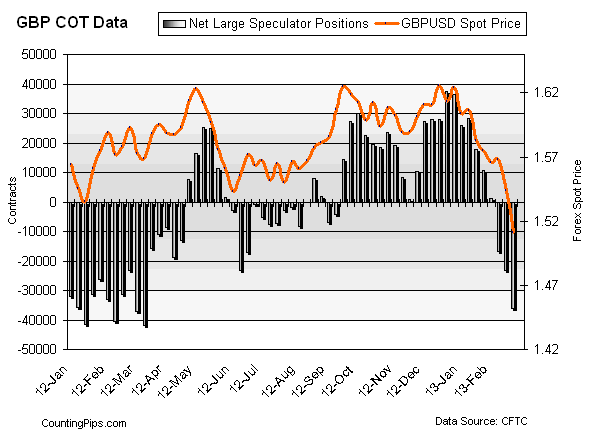
GBP: British pound sterling positions declined sharply again last week to fall for a sixth consecutive week. British pound speculative positions dropped to a total of -36,130 net contracts on February 26th following a total of -23,365 net contracts that were reported on February 19th.

Pound speculator positions have now been in a negative bearish position for three weeks and are at the lowest level since March 12th, 2012 when positions equaled -41,848 contracts.


Japanese Yen:
jpy

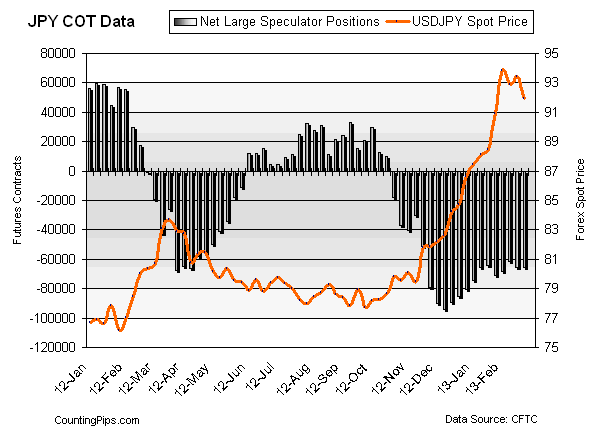
JPY: Japanese yen speculative contracts inched up last week after dipping the previous week. Japanese yen positions advanced slightly to a total of -65,344 net contracts reported on February 26th following a total of -65,891 net short contracts on February 19th.

Yen positions have been on the bearish side since October 2012 with a recent low point reached on December 11th with -94,401 contracts.


Swiss Franc:
chf

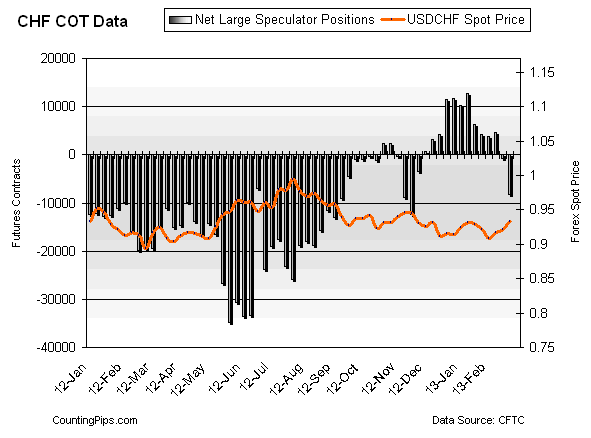
CHF: Swiss franc speculator positions decreased last week to fall for a second week and to the lowest level since November 2012. Net positions for the Swiss currency futures dropped to a total of -8,191 contracts on February 26th following a total of -675 net contracts as of February 19th.

CHF positions are on the short side for a second straight week and are at the lowest level since November 20, 2012.


Canadian Dollar:
cad

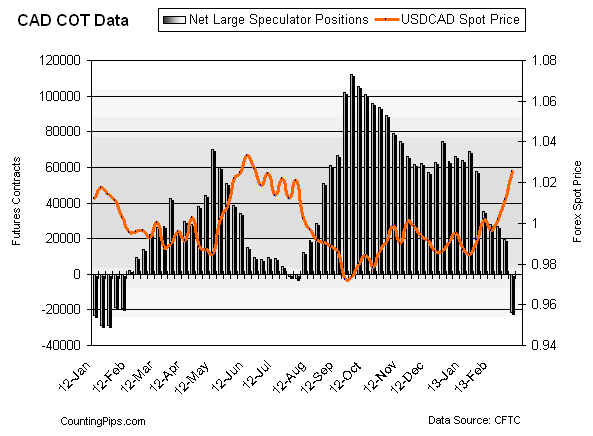
CAD: Canadian dollar positions decreased sharply lower last week to decline for a sixth consecutive week and to the lowest level in over a year. Canadian dollar positions fell to a total of -21,433 contracts as of February 26th following a total of +19,379 net contracts that were reported for February 19th.

Canadian dollar speculator positions are now at their lowest level since January 17th, 2012 when positions totaled -28,730 contracts.


Australian Dollar:

aud

AUD: The Australian dollar continued to decrease last week to fall for a fifth straight week. Aussie speculative futures positions declined to a total net amount of +25,695 contracts on February 26th after totaling +43,981 contracts as of February 19th.

Australian dollar contracts are at their lowest level since July 17, 2012 when long positions equaled just +13,931 contracts.


New Zealand Dollar:

nzd

NZD: New Zealand dollar speculator positions decreased last week after reaching their highest level in over a year the previous week. NZD contracts decreased to a total of +20,297 net long contracts as of February 26th following a total of +24,693 net long contracts on February 19th.

The New Zealand dollar positions two weeks ago just surpassed their 2012 high level (reached on December 11th at +24,600 contracts) and have remained over the +20,000 long contracts threshold for seven consecutive weeks.


Mexican Peso:
mxn

MXN: Mexican peso speculative contracts dropped last week to decline for a sixth straight week. Peso positions decreased to a total of +104,804 net long speculative positions as of February 26th following a total of +116,165 contracts that were reported for February 19th.

Peso speculative positions continue to be at their lowest level since November 27, 2012 when long speculative positions equaled +93,858 contracts.


The Commitment of Traders report is published every Friday by the Commodity Futures Trading Commission (CFTC) and shows futures positions data that was reported as of the previous Tuesday (3 days behind).

Each currency contract is a quote for that currency directly against the U.S. dollar, a net short amount of contracts means that more speculators are betting that currency to fall against the dollar and a net long position expect that currency to rise versus the dollar.

(The graphs overlay the forex spot closing price of each Tuesday when COT trader positions are reported for each corresponding spot currency pair.)


Article by CountingPips.comForex News & Market Analysis


Monetary Policy Week in Review – Mar 2, 2013: Rates still declining but most central banks in wait-and-see mode

By www.CentralBankNews.info

    Last week seven central banks took monetary policy decisions with two banks (Hungary and Jamaica) cutting rates and the remaining five banks (Angola, Israel, Trinidad & Tobago, the Dominican Republic and Zambia) keeping rates on hold.
    The main message from last week’s policy statements was that the global economy continues to slowly improve, risk appetite in financial markets is strengthening and inflationary pressures are contained by weak demand.
    But is the global economy strong enough for central banks to shift from an accommodative stance toward a more neutral stance without killing the recovery?
    The Bank of Israel illustrates the wait-and-see approach that currently characterizes global monetary policy.  Last year’s threat of financial meltdown from Europe’s debt crises has been averted by a combination of monetary easing and astute policy guidance. The main issue for many central banks this year is how to nudge interest rates higher without undermining economic confidence.
    The Israeli central bank, which last year cut its rate by 100 basis points as the economy slowed, noted that recent economic indicators were mixed. While an improvement in activity was possible in January, fourth quarter growth was below previous quarters.
     “It is therefore too early to assess whether this represents a turnaround in economic activity,” the BOI said.
    Through the first nine weeks of the year, 76 percent of the policy decisions taken by the 90 banks followed by Central Bank News have favored unchanged rates, own from last week’s 77 percent.
    But 20 percent of decisions have lead to rate cuts, slightly up from the 19 percent seen after the first eight weeks, showing that the trend in global monetary policy is still toward more easing.
    Emerging market central banks remain the most active rate cutters, with 26 percent of their deliberations so far this year leading to rate cuts compared with 22 percent of central banks in frontier markets.
    No central bank in developed markets has cut rates this year but that is largely because some of the major ones, such as the Federal Reserve, the Bank of Japan and the Bank of England, years ago slashed their rates to effectively zero and then started using their balance sheets to guide rates.
    And though much attention is focused on how the Bank of Japan and the European Central Bank can further stimulate their economies, the Bank of Israel and the Federal Reserve illustrate that the global trend is starting to shift toward a more neutral stance.
    While Federal Reserve Chairman Ben Bernanke last week assured financial markets of his commitment to easy policy, his testimony and the minutes from the previous week were a stark reminder that the days of quantitative easing are likely numbered.
    Another topic in monetary policy last week was the nomination of new central bank governors in Japan and Hungary, with both decisions triggering a heated debate over central banks’ independence along with expectations that the new governors will pursue aggressive pro-growth policies.
    In Tokyo Prime Minister Shinzo Abe nominated Haruhiko Kuroda as successor to BOJ Governor Masaaki Shirakawa and in Budapest Prime Minister Viktor Orban picked Gyorgy Matolcsy to replace Andras Simor.
LAST WEEK’S (WEEK 9) MONETARY POLICY DECISIONS

COUNTRYMSCI    NEW RATE          OLD RATE       1 YEAR AGO
ANGOLA10.00%10.00%10.25%
ISRAELDM1.75%1.75%2.50%
HUNGARYEM5.25%5.50%7.00%
JAMAICA5.75%6.25%6.25%
TRINIDAD & TOBAGO2.75%2.75%3.00%
DOMINICAN REPUBLIC5.00%5.00%6.75%
ZAMBIA9.25%9.25%                 N/A *
* Note: The Bank of Zambia introduced a policy rate in April 2012, replacing money supply targeting. 

NEXT WEEK (week 10) features 13 scheduled central bank meetings, including Mauritius, Australia, Uganda, Poland, Brazil, Canada, Japan, Indonesia, Malaysia, the European Central Bank, the Bank of England, Peru and Mexico.

COUNTRYMSCI         MEETING              RATE       1 YEAR AGO
MAURITIUS4-Mar4.90%4.90%
AUSTRALIADM5-Mar3.00%4.25%
UGANDA5-Mar12.00%21.00%
POLANDEM6-Mar4.00%4.50%
BRAZILEM6-Mar7.25%9.75%
CANADADM6-Mar1.00%1.00%
JAPANDM 7-Mar0.10%0.10%
INDONESIAEM7-Mar5.75%5.75%
MALAYSIAEM7-Mar3.00%3.00%
EURO AREADM 7-Mar0.75%1.00%
UNITED KINGDOMDM7-Mar0.50%0.50%
PERUEM7-Mar4.25%4.25%
MEXICOEM8-Mar4.50%4.50%


Kris Sayce’s Money Weekend Market Digest: 02 March 2013

By MoneyMorning.com.au

Before we go through this week’s digest, an announcement. As you know, we’ve been bullish on this market for months. And despite the recent rally and the continued volatility, we still see a lot of good value on the Aussie market (not just in small-caps either).

Well, you’ll be pleased to know that we’ve put our money where our mouth is. Because we’re so convinced of the value and opportunities on the market that we’ve decided to invest in our business. We’ve done that by hiring an assistant research analyst to help us scour the market for beaten-down stocks and breakthrough innovators.

So, please welcome Samuel Volkering (he prefers Sam). You’ll see Sam’s name in Money Weekend, Money Morning, Australian Small-Cap Investigator, and a new project we’re working on — we’ll have more details on that soon.

Until then, on with today’s digest…

ENERGY: Breakthrough in ‘Battery’ Technology

To be fair this breakthrough really isn’t a battery as we know it. It should be and will be referred to as a power cell.

Think about this. You probably have a phone. And if you do, every night you’ll plug it in to a wall socket. You use electricity from the grid to recharge your phone so that it will last you through the next day. Where does the electricity come from? Typically the power company burns coal to generate the electricity. You get the idea.

Burning coal is the number one way to generate electricity worldwide. But it’s not great for the environment.

This is where the power cell breakthrough enters the scene. This breakthrough was discovered by Dr. Zhong Lin Wang and his team from Georgia Tech University. They’ve harnessed physical movement, or as the boffins refer to it, kinetic energy.

The Kinetic Energy Recovery System (KERS) isn’t new. Formula One has used it since 2008. But KERS is a two-step process. You have to generate the energy and then store it in a battery.

The great thing is with Dr. Wang’s power cells it’s a simple one-step process. Literally. Put the cell in a shoe, go for a walk and you generate and store the power in the cell. The scalability of this breakthrough is even more exciting.

A one cubic metre cell in the sea, charged by the ocean’s movements, could hold 30,000 watts of energy. More than enough to power your home for 38 days.

Multiply that out and you can say ‘bye bye’ to burning coal, build no more wind turbines, and potentially even see the end to solar technology.

According to Dr. Wang this technology will be ready for mainstream commercialisation within the next three to five years. So keep watching this space.

GOLD: What if Gold isn’t What it Used to Be?

Gold continues to trade in the doldrums. After rallying back to USD$1,600, it fell again yesterday, trading around USD$1,585.

So, what’s the problem with gold? Why isn’t it soaring? After all, central banks are printing money like it’s going out of fashion. Isn’t this the perfect environment for gold to boom?

You’d think so. But investor psychology isn’t always rational. Investors don’t always behave as you, as an individual, think they should (just ask Murray Dawes, our chief technical analyst; a big part of his analysis is studying, predicting and balancing the probabilities of how traders and investors will react to a stock).

We don’t mind if the gold price falls. We see gold as an insurance policy against a long term collapse in the global money system. So when the gold price falls it cheers us in two ways: first, it suggests that the collapse won’t happen just yet, and second it gives us the chance to top up our insurance at a cheaper price.

If that isn’t a win-win we don’t know what is.

But gold isn’t just about the theory of money and whether it’s good or bad for central banks to print money. Gold in some ways is now just like any other tradeable assets — in the case of the Aussie market, it’s a four letter code that you can buy and sell through your stockbroker…just like you can buy and sell bank, mining or retail shares.

You can trade gold on the Australian Securities Exchange (ASX) using the ETFS Physical Gold ETF [ASX: GOLD]. It’s a pretty liquid market with more than $2 million traded each day. Of course the big market is in the US where the SPDR Gold Trust [NYSE: GLD] trades more than USD$400 million per day!

That means to a large degree, gold is just like any other tradeable asset right now. As Rick Santelli points out in this video on CNBC:

‘When I was trading gold, the newspapers used to have on the front page of the Tribune, the gold watch, the silver watch. People were taking antique silver sterling that was passed down and melting it. It is not the same now. If you trade paper, the notion of many who trade gold – the ‘Ayn Randers’ – if the financial world comes to an end, they’re going to have gold. If you’re playing in ETF’s, you’re going to have a piece of paper… So it takes away some of what I perceive are the driving forces behind the run-up in the early stages after the [financial] crisis.’

As usual, Rick Santelli is the only one worth listening to on CNBC, and he makes a great point. If gold is now a ‘paper’ asset where people trade it without any intention of ever taking delivery of the gold, can we say it’s a safe haven anymore?

In the old days when people would have gold certificates or when cash was redeemable for gold there was always the understanding that someone someday would want to collect and hold their gold bars.

That’s something you can’t say for the thousands of traders who buy and sell the gold ETF on the New York Stock Exchange every day. Maybe gold has changed. It’s worth thinking about anyway.

And while you’re thinking about it, we’ll go and buy some more…

TECHNOLOGY: Is This the Next Great Leap Forward in Wearable Computing?

Here’s an example of the wild speed in which the technology world moves forward. In 11 months we’ve gone from smartphone, to smartglasses, to smartwatches and now the next frontier, smart armbands.

This ground breaking piece of kit is called MYO (www.getmyo.com). It will allow you to simply use the action of your arm, hand and fingers to get your gadgets to do what you want. Think, ‘Luuuke use the force,’ in an armband.

Source: MYO

So, how is MYO different to current motion controlling devices?

To put it simply the current devices use a camera to see you. By contrast, MYO uses the muscle activity and motion in your forearm to control your linked devices. You can check it out by watching the video here.

Let’s imagine the possibilities… Flick from one TV station to the next with a swipe of your finger. Even better, open that germ ridden public toilet door with a swipe of your hand rather than trying to find the least wet spot to push. Or imagine the ease for a video editor piecing together a whole film with the smoothness of an orchestra conductor.

It’s a mime artist’s dream come true. And if the technology catches on, it’s the end of the computer mouse.

The potential to develop this is huge. We’ll show you what we mean…

Within the year you could have a MYO on your arm and Google Glass on your head. You might look like a squash player from the future, but you’ll be seamlessly connected to the world physically and digitally. And playing some serious online squash.

As you can see this kind of innovation in wearable computing continues to drive the technology revolution. We can’t wait to see what comes next. Note: Flying cars are still not coming.

HEALTH: How to Use Your Smartphone to Save Your Life

It’s likely someone you know has diabetes, or early onset of diabetes. The occurrence is increasing at an alarming rate. The frustrating part is it’s completely preventable. Diet and lifestyle are the key contributing factors to Type 2 diabetes. But did you ever consider that your smartphone can help you prevent this terrible disease?

The noise about the evils of your online and mobile data falling into the wrong hands is growing. And you should be worried. But think about the benefits that your data might actually hold.

Without knowing it, you’re potentially sitting on a treasure chest of your own information.

And it’s because some smart guys at the MIT Human Dynamics Lab have looked at the ‘Big Data’ from a group of smartphone users (obtained with permission we might add) and their behavioural patterns. The man leading this charge is Professor Alex ‘Sandy’ Pentland.

You see Prof. Pentland and his team have collected all the data from the smartphones in their test group. The type of data they collected included; where people went, how active they were, what routes they took day to day, who they called and for how long. They also looked at where and how often people ate or drank at particular restaurants, pubs and bars.

What they found were mini-communities within larger communities. These mini-communities were highly repetitive in their behaviours. We like to call it ‘Sheep Theory’.

This data was analysed and used to accurately predict when people were getting sick and what particular moods they experienced. Notably they could also determine when the users were at risk of early onset of Diabetes. And which mini-communities were at higher risk than others.

We don’t know about you, but we’d like to know if the social groups we spend time with or the groups we’re a part of are vulnerable to early onset of diabetes. We think that armed with this kind of personal data, it’s possible to implement changes to bad behavioural patterns

MINING: It’s Only Bonkers Until it’s Proven to Work

While most people worried about the prospects of a meteor crashing into their house a few weeks back, one group of…well, we suppose they’re entrepreneurs…were thinking of something else.

They were thinking about the chance to make money from asteroids (that’s what a meteor is called before it enters the Earth’s atmosphere).

According to the Christian Science Monitor:

‘The space rock set to give Earth a historically close shave this Friday (Feb. 15) may be worth nearly $200 billion, prospective asteroid miners say.’

That’s right, ‘asteroid miners’. We’re not kidding.

The firm that one day plan to mine passing asteroids is Deep Space Industries. Right now it doesn’t have the space mining capability. That means it had to let the supposedly $200 billion 2012DA-14 pass by without shooting a rocket into space with a payload of drills, trucks and a method to return back to earth.

The Christian Science Monitor report states:

‘Deep Space Industries wants to use asteroid resources to help humanity expand its footprint out into the solar system. The company plans to convert space rock water into rocket fuel, which would be used to top up the tanks of off-Earth satellites and spaceships cheaply and efficiently.

‘Asteroidal metals such as iron and nickel, for their part, would form the basis of a space-based manufacturing industry that could build spaceships, human habitats and other structures off the planet.’

We love this story because it seems so completely bonkers. But that’s the great thing about progress and science, almost everything seems bonkers before it happens — think radio, TV, cars, skyscrapers, mobile phones, prosthetic arms, bionic eyes and ears.

But when people with a vision make something happen and it becomes commercially successful, you hear the common refrain, ‘If only I’d thought of that.’

Who knows, maybe we’ll hear the same things said about asteroid mining twenty years from now.

Kris Sayce and Sam Volkering

Join Money Morning on Google+
From the Archives…

The Biggest Crisis to Hit the Stock Market Since the Last One
22-02-2013 – Kris Sayce

My Wife and Warren Buffett
21-02-2013 – Kris Sayce

How a Share Trader Approaches the Market
20-02-2013 – Murray Dawes

The Poster-Child for the US Shale Gas Revolution
19-02-2013 – Dr. Alex Cowie

The Two-Dimensional Diamond That’s Set to Turn Your World Upside Down
18-02-2013 – Dr. Alex Cowie

Why Aristotle Still Matters to Traders and Investors

By MoneyMorning.com.au

It is the task of Money Weekend this week to transport the philosophers Aristotle and Plato from the Greek agora of centuries past to today’s stock market. If this sounds like a turn off, stick with us, because your trading account might benefit.

But before we get to those two, there’s the small matter of the US Fed and the glitch in the bull run on the ASX.

Greed and Fear Trading

Stocks actually finished up for the month of February. In fact, the ASX / 200 broke through the 5,000 points mark for the first time since early 2010. And despite a few bumps, it’s managing to hold above that figure. But it is slightly down from the high it hit in the third week of February. You can’t have everything.

It could be thanks to the 2.3% drop in the market following the release of the January minutes from the US Federal Reserve. That spooked markets worldwide. The Fed reminded everyone that stocks look a lot riskier if the US central bank stops pumping money into the system.

Of course, it’s since been written off as an empty threat for now. Uncle Ben Bernanke says the Fed’s actions have helped markets and the economy. And stock markets worldwide recovered. But it was a good reminder of the old notion that there are two things that drive investors: greed and fear. And before the feelings of greed and fear turn up in stock prices, they show up as hormones in human beings.

Now, that might sound a bit out of left field. But hormones might play a much more important role in financial markets than you may think, if John Coates is to be believed. Coates is a former trader with a couple of global banks. He is also a trained neuroscientist. That’s not a usual combination, as far as we know. Coates is also the author of the curious book The Hour Between Dog & Wolf: Risk Taking, Gut Feelings and the Biology of Boom and Bust.

His book is a kind of speculative theory about biological reactions to financial triggers and risk taking. The key point is that if you want to understand financial markets, you must understand the psychology of traders and investors in the market. And you can’t understand their psychology, he says, unless you understand their biology.

All the Way Back to Ancient Greece

This where Plato and Aristotle come into it. According to Coates, Aristotle studied human behaviour as a whole. But Plato was different. He believed in a distinct divide between the human mind and body. We know now this isn’t true. But the idea hung on over the centuries.

What’s this got to do with today? Coates argues Plato’s line of thinking still shows up in an unlikely place: the assumption of highly rational ‘economic agents’ in today’s most dominant form of economics: the neo-classical school of thought.

This is the economic model Ben Bernanke takes to work every day. It’s how central banks and governments model stock markets and the financial system. Coates calls it ‘economics from the neck up’.

No wonder they miss everything. For our purposes today, it’s the one economic model you don’t want to use approaching the stock market. Remember, the US Federal Reserve misunderstood the Nasdaq bubble, the US subprime crisis and the US housing bubble. If you follow their model, your investments might end up like those.

But there’s another insight in The Hour Between Dog & Wolf that could be worth a lot more from a trading perspective. It’s that experienced traders can develop an advanced skill for anticipating the market.

Remember, there’s the efficient market theory that says stocks only change when news hits the market and then it’s quickly factored into prices. In other words, it’s pointless to try and beat the market. But Coates’ believes experienced traders can and do beat the market consistently.

The emphasis here is on skill, based on learning. But how?

A Time Worn Skill

Coates makes a convincing case that some traders develop expertise as different (but repeating) patterns are stored in their memory bank over a long period of time. The instant feedback of either winning or losing money acts as a reinforcement.

They also learn to master their emotions and stress levels to the point where they can take advantage of volatility in the market. Coates argues there is such a thing as gut reactions or intuition that can be trusted alongside normal rational analysis. Of course, traders like this are rare.

The amateur can’t trade intuitively, or at least shouldn’t. Most amateurs lack trading expertise, for starters. And if the market triggers their stress levels, they’ll be panicked out of positions and will be reluctant to initiate new ones because of the anxiety it creates.

What’s unusual about all this is there are plenty of tales of traders and speculators acting on hunches in the financial markets. Until now, though, there haven’t been many scientists backing them up.

It wouldn’t surprise Slipstream Trader Murray Dawes. He has his own theory of price action that he uses to trade. He’s been doing it for twenty years. That’s a lot of patterns and a lot time studying charts. But it’s also combined with fundamental analysis.

Here’s how he put in just this week on Wednesday:

‘The volatility of stock prices is so intense that a purely fundamental approach will often get you into trouble. That’s because the volatility will either shake you out of the stock at the wrong time or you’ll need to risk a large portion of the stock’s price since you have no idea of when you’re proven wrong. On the other hand, being purely technical means that you could end up playing with fire by buying a stock that is fundamentally unsound.

‘Here’s a weekly chart of the stock in question going back nearly ten years:

A Weekly Price Chart Over Ten Years

Source: Slipstream Trader

‘I’ve included some horizontal lines on the chart to show you how I analyse the stock’s price technically. The key levels are the solid blue lines based on the range created all the way back in 2006 between $1.00 and $1.64. The dotted line in between is called the ‘point of control’ and is what I see as the gravitational point around which all of the subsequent price action oscillates. Using this method I have a point of reference for analysing the past ten year’s price action.’

Murray thinks amateur traders do try to read the market, but they read it in the wrong way. He’s going to shed some more light on his theory with a report shortly.

Callum Newman
Editor, Money Weekend

PS. Don’t forget if you want to keep track of the latest things we’re reading and brief commentary on events that happen through the day, check out our Google+ page here or Kris Sayce’s here.

From the Port Phillip Publishing Library

Special Report: The Gold Mirror of Kaieteur Falls

Daily Reckoning: In Bernanke We Trust

Money Morning: The Primary Colours of Investing

Pursuit of Happiness: Exclusive: Your Eight-Point Wealth Protection To-Do List

Viva Sequester!

America missed an asteroid. It dodged a depression. It sidestepped
the Mayan’s End-of-the-World curse. But the “sequester” strikes Planet
America today.

Thursday morning, the Dow was headed for an all-time high based on two rationales.

First, housing seems to be in a real recovery. Here in Delray a business partner told us:

It’s unbelievable. Prices are almost
back up to where they were before the crisis. I used to buy houses and
apartment buildings for 5 times rental income. That was a good deal. But
now, I can’t get those deals. Too many buyers in the market.

But Delray is special. It’s a very strong market.

The second rationale for a stock market boom was announced by Ben Bernanke. He’ll keep printing money, he told the Senate, come Hell or High Water, whichever comes first.

The End Is Near

With the Fed behind it, stock market bulls felt sure the Dow would
hit a new record yesterday. But it didn’t. Instead, it backed away from
Wednesday’s gains. Yesterday, the Dow went down 20 points in
anticipation. Gold dropped too… adding to the confusion.

Why?

When Congress passed the Budget Control Act of 2011, it kicked the
can down the road… to the first of March 2013. That’s when the dreaded
“sequester” was supposed to happen. Automatic U.S. government budget
cuts are meant to be triggered… cutting off “demand” for certain
public and private services.

To hear some in the press and the government describe it, this
sequester will be the end of life as we have known it. The feds will
lack money for the basic services that maintain civilized life. After
tomorrow, the borders will be opened… terrorists will launch an
assault on Washington… old people will drop dead in hospitals…
cancer cures will be abandoned… troops won’t be fed…

… and worst of all… the Zombie Apocalypse will begin… with
millions of zombies marching on Washington in search of money they never
earned.

Well, you know that this is nonsense. But you may not realize how
preposterous it is. Even with the sequester, spending still goes up. The
difference between the sequestered budget and the non-sequestered
budget is trivial.

For Krugman, Bernanke, Stiglitz et al. the worst thing that can
happen to an economy is a fall in “demand.” And they see it coming
today!

The sequester
reduces “demand” from the federal government. But that is a good thing.
When the depression of 1920-21 struck, Presidents Warren Harding and
Calvin Coolidge had no Nobel Prize-winning neo-Keynesian economists to
help them. So they had to use common sense. They simply cut the burden
of government – reducing taxes and cutting (sequestering) government
spending.

Result? The depression was over within two years. Full employment was restored. GDP roared ahead.

But today’s leading economists are convinced that they know better.
They believe “sequester” means less demand. And less demand is bad.

Mushy Thinking

Meanwhile, on the front page of The Wall Street Journal, more mushy thinking. Describing Japan’s economic problem:

… the country’s economy is stagnating because prices are stuck at 1980s levels.

Come again?

Prices are “stuck.” Is that any different from saying prices are
stable? No, it isn’t. In Japan, consumer prices are about the same today
as they were 30 years ago. According to the sages at the WSJ, that too is a bad thing; it causes economic stagnation. Why? Because it cuts demand!

Oh dear, dear reader… only a person who has studied economics could
believe such a silly thing. In America especially, the economics
profession has led itself into mush. It believes that what really
matters is “demand” and that rising prices encourage it. It also
believes that the role of policymakers is essentially demand management.

When prices go up, people don’t want to save… and don’t want to
wait. They know they’ll get their best deal now. So, they spend. Demand
increases.

Rising prices also mislead investors and households on the other side
of the ledger. They see their investments going up. They see their
income rising. They figure they can spend more. Demand increases.

Anyone who thinks about it seriously knows that there is more to a
good economy than just demand. Spending isn’t what makes a healthy
economy. It’s saving. Building capital. And using the capital to earn
profits and pay wages.

Demand is what you get as a result of saving and investment… not
the other way around. There is no real demand, in other words, until you
have wealth. Wealth allows you to spend. Real demand goes up.

But if you try to push up demand without adding real wealth you are
just wasting your time. Or worse, you’re tricking everyone in the
economy and causing them to make mistakes.

Which brings us back to prices that are “stuck.” Stable prices are a
good thing. They make it easy to tell where you are and where you’re
going. If, for example, your income is “stuck” and your wealth is
“stuck”… then you should be stuck too. Spending more money you don’t
have is not the way to unstick yourself.

Sequester? Bring it on!

Regards,

Bill Bonner

Bill

http://www.billbonnersdiary.com/