The Talisman of Fear: Why Gold Remains the Foundation of Wealth

By MoneyMorning.com.au

gold is the foundation of wealth and your best wealth insurance policy

‘The other and by far the major defect is that it is the talisman of fear. Fear, Mr Bond, takes gold out of circulation and hoards it against the evil day. In a period of history when every tomorrow may be the evil day, it is fair enough to say that a fat proportion of the gold that is dug out of one corner of the earth is at once buried again in another corner.’ – Auric Goldfinger to James Bond in Ian Fleming’s Goldfinger


We can honestly say we’ve never been a fan of James Bond films. There is a zero percent chance of your editor watching Skyfall…ever.

We’re not sure why. We think it’s because we associate the James Bond series with dull and sleepy Christmas Day and Boxing Day afternoons as a youngster.

But when late last year we got hold of the entire back catalogue of the James Bond books on our Kindle, we started reading them (at the beginning with Casino Royale)…and they had us hooked.

As it happens, on New Year’s Day we finished the seventh book in the series, Goldfinger. It’s where we grabbed the quote you see at the top of this letter.

If you’re not familiar with the book, in short, Auric Goldfinger is a gold smuggler for the Soviets. His ultimate plan is to rob Fort Knox of its gold. Needless to say, James Bond foils the plan. But we won’t give away the full storyline.

As Mr Goldfinger says, gold ‘is the talisman of fear.’ That was true a thousand years ago. It was true in 1959 when Ian Fleming first published Goldfinger. And it is true today…

We’ve got two messages for you. First, ditch the James Bond movies and grab the books instead. We guarantee you’ll never watch another Bond movie again.

Second, yesterday the Dow Jones Industrial Average added 308 points. The day before the blue-chip Aussie index gained 52 points, and yesterday it added 34 points.

But look at what the talisman of fear tells you today?

Despite the surging stock markets and the avoidance of the so-called (yawn) Fiscal Cliff, the talisman of fear is at USD$1,679.

That’s just 12% below the record peak reached in 2011, when the gold price went on a tear leading up to the US debt ceiling crisis and the expected US credit rating cut.

So we ask a simple question: if everything is so great, and if the US is so close to solving its debt and budget problems, why is the talisman of fear barely 12% below its all-time high?

It doesn’t make sense. That’s why, as we wrote yesterday, we love it that the stock market has soared. We’ll take those gains…we’ll take them straight to the bank.

As we’ve always said about gold, we consider it an insurance policy. Just because we didn’t have a car accident yesterday, doesn’t mean we’ll cancel our car insurance policy today.

But there’s another reason why the gold price has held up, and why it will soon hotfoot it higher again. The reason is in Exter’s Prophecy…

Gold is the Foundation of Wealth

Our old pal Dan Denning has told his readers about Exter’s Prophecy in the Daily Reckoning and in his monthly investment advisory, the Denning Report.

The secret to Exter’s Prophecy is in an inverse pyramid. Much like the one below:

Exeter's Pyramid

The text is difficult to read on this diagram, so we’ll let Dan explain the meaning of the inverse pyramid:


‘The pyramid is made up of all the assets in the financial system. At the bottom is gold, an asset that cannot default.

‘Gold is the foundation of the pyramid. It’s real money and bedrock wealth. As you work your way up, the assets slowly change. You go from real money (gold), to paper money (cash), to government bonds.

‘In Exter’s time, the top of the pyramid was risky debt. For example, loans made by the big banks to Latin American countries occupied the top of the pyramid. Today we call it “emerging market debt”. But the point is, anything at the top of the pyramid is actually someone else’s promise to pay you. It’s usually debt, not real, tangible wealth.’

Who was Exter? We’ll leave Dan to explain that in this report. Plus he includes why it’s important for you to understand the significance of Exter’s pyramid.

But put simply, gold is still where it is because everything that’s above gold in Exter’s pyramid still exists.

Will You Live Long Enough to Retire?

There is still paper money in use in every economy on earth.

There is still trillions of dollars-worth of government debt on issue around the world. Even a so-called safe country like Australia has $261.8 billion (more than a quarter of a trillion) in outstanding debt.

And there is still corporate debt, securitised debt, private businesses, real estate…and at the top of the pile, derivatives and unfunded government liabilities.

None of those things – not one – are going away anytime soon.

And as long as they exist, and the more they grow (as they inevitably will), gold becomes more valuable.

Auric Goldfinger says that a ‘fat proportion’ of the world’s mined gold will end up buried in a corner somewhere. Darn right it will. Because there’s another important message in Exter’s pyramid. It’s this…

The pyramid shows more than just the order of safe to risky assets. The pyramid shows the order, or the progression, of the economic collapse. First the derivatives, then the unfunded government liabilities…

(Make no mistake, you won’t get from the government what they’ve promised you, they just haven’t admitted it yet…wait for the government to raise the retirement age to 80 and then 85 within the next five to ten years.)

And so on, until the only asset standing is gold. When will that happen, and how long will it take? The ‘when’ is now. It’s been going on since 2007…if not before.

The ‘how long’ is unknown. It could be this year, the next, or in 10 or 20 years. No one knows. That’s why we recommend holding gold as an insurance policy. But there’s more to it than that. And that’s why we also suggest you take a few minutes to read Dan’s recent report into the secrets of Exter’s Prophecy.

Cheers,
Kris.

From the Port Phillip Publishing Library

Special Report: The Fuse is Lit

Daily Reckoning:
The Great Monetary Devolution Away from the Gold Standard

Money Morning:
Australian Stocks: Still the Best Wealth Builder in Town

Pursuit of Happiness:
Gun Control: Did Obama Shed Tears for These Kids?

Diggers and Drillers:
Five Reasons Why Gold Stocks Are Set to Rebound

Why Inflation is the Economy’s Hidden Iceberg in 2013

By MoneyMorning.com.au

inflation the hidden iceberg

Even though Ben Bernanke’s Fed has kept interest rates close to zero, inflation hasn’t been a big problem since the 2008 financial crisis.

Despite what many observers have expected inflation has remained quite tame.

However in 2013, that may be about to change. One factor that might cause a surge in inflation is the fiscal cliff.

That’s because Bernanke is already buying $1 trillion of Treasury and housing agency bonds each year ($85 billion per month) against a budget deficit that is about the same level.

That means the inflow of funds to the economy from the Fed and the outflow of money to fund the government’s spending are about balanced.

However, if we go over the fiscal cliff the Federal deficit immediately falls to about $300 billion per annum. At that point, Bernanke would be injecting an extra $700 billion a year into the US economy – which would have a corresponding inflationary effect.

The Case for Higher Inflation

But that’s only part of the inflationary story.

Central banks around the world are also expanding their money supply. China has become more expansive, the European Central Bank is buying bonds of the continent’s dodgier governments and Britain like the United States is monetizing nearly all the debt it creates to fund its budget deficit.

The big change in 2013 is now in Japan, where the new Abe government has told the Bank of Japan it wants much more buying of government bonds, to push the inflation rate up to 2%.

And just as Bernanke’s money creation increases inflation internationally, Japan’s new monetary push creation will likely increase inflation here in the United States.

In this case, the excess money creation will get transmitted to inflation mostly through commodity prices.

The Thomson Reuters/Jeffries CRB Continuous Commodity Index closed recently at just over 300, about double its value ten years ago. And after a period of weakness in 2011-12, the index has recently showed renewed strength.

Now I admit, doubling in ten years may not sound very impressive, but that’s a rate of increase of 7% per annum. It only follows that if the basic elements of everything we consume are increasing in price at 7% per annum, then it’s impossible to believe prices overall will rise by only 2% in the future.

In one respect, we’ve been lucky when it comes to natural gas prices. Thanks to new ‘fracking’ techniques the US natural gas prices have been cut in half over in the last four years.

This has given both consumers and producers a boost, and kept inflation down. But the bad news is that natural gas prices appear to have bottomed out around April 2012, and are now well above their low. Going into 2013, higher natural gas prices may well be inflationary as well on the commodities side.

Why You Can’t Trust the Inflation Figures

An additional factor tending to increase inflation is the tendency of official statistics to under-report it. This has not gone as far as in Argentina, where real inflation runs around 30% while official figures report inflation of 10%. Still, the official U.S. price indexes have since 1996 been distorted by ‘hedonic’ prices, which adjusts prices downwards for the supposed ‘hedonic’ advantage of chip capacity and speed enhancements in the tech sector. The effect of this appears to be about 1% a year, and it can be adjusted for.

However, a second fudge is about to be introduced. It’s the ‘chain weighted’ price indexes that both political sides have agreed to use to calculate social security and other payments.

The problem with chain weighting is that it assumes that consumers change their consumption patterns optimally according to price movements. In practice, actual human consumers cannot do this because they do not know in advance what relative price movements are coming. If they did it would be the equivalent of a ballplayer batting 1.000.

Here’s why…

Consider an economy with two substitutable products – call them widgets and grommets. Initially both have the same price, but everyone buys widgets, which are slightly superior.

Then let’s assume the price of widgets doubles in year 1. Everyone may switch to grommets, but these have not increased in price, and so the chain-weighted price index remains static.

Then in year 2, let’s say the price of grommets doubles while that of widgets remains at the new higher level – so everyone switches back to widgets. But since these have not risen in price in year 2, the chain-weighted price index again remains constant.

So after 2 years, the prices of widgets and grommets have both doubled, but the price index hasn’t moved at all. As I said, chain-weighting is a nothing more than a government fiddle.

The bottom line is that there’s a substantial chance of a sudden upsurge in inflation in 2013, though the government statistics may reflect it only very grudgingly.

That will increase the costs of everything we buy, whatever the official statistics say.

Martin Hutchinson
Contributing Editor, Money Morning

Publisher’s Note: This is an edited version of an article that originally appeared in Money Morning (USA)

From the Archives…

Why Small-Cap Stocks Could Be Your Best Investment in 2013
14-12-2012 – Kris Sayce

How the Global Oil Grab Affects You…
13-12-2012 – Byron King

The Price of Risk in the Stock Market
12-12-2012 – Murray Dawes

Why Silver Could Be the Best Investment in 2013
11-12-2012 – Dr. Alex Cowie

The Long, Drawn Out Retreat in Australian House Prices
10-12-2012 – Dr. Alex Cowie

Read more articles about inflation.

Forex Trading: Why You Need to Look Past “Fiscal Cliffs”

The “fiscal cliff” agreement did not set the course for EUR/USD — here is why.

By Elliott Wave International

First, a word on how we all are conditioned to think that, “momentum will remain constant unless acted on by an outside force.” Read this excerpt from Robert Prechter’s May 2004 Elliott Wave Theorist:

“…’Momentum will remain constant unless acted on by an outside force.’ This mode of thought is deeply embedded in our minds because it has tremendous evolutionary advantages. When Og threw a rock at Ugg back in the cave days, Ugg ducked. He ducked not necessarily because his mind had inherited and/or learned the consequences of the Law of Conservation of Momentum.

“The rock would not veer off course because there was nothing between the two men to act upon it, and rocks do not have minds of their own.

“Earlier animals that incorporated responses to the laws of physics lived; those that didn’t died, and their genes were weeded out of the gene pool. The Law of Conservation of Momentum makes possible our modern technological world. People rely on it every day.

“Despite its use in so many areas, however, it is inapplicable to predicting [the financial markets]…”

Why did Prechter postulate that following this fundamental law of physics does not help you trade better? Here’s a fresh example; see for yourself.

Hours before the December 31 deadline, U.S. lawmakers reached an agreement to avoid the “fiscal cliff.” When trading resumed on January 2, most markets around the world opened higher. EUR/USD, the world’s biggest forex market, also rose. Said one January 2 headline:

“Yen, Dollar Weaken as US Budget Accord Damps Demand for Refuge”

In other words, the “rock” was thrown: The “fiscal cliff” deal was reached, which “increased the demand for riskier assets,” such as the euro, and dampened the demand for “safe assets” like the U.S. dollar. Now, unless some “outside force” were to act on the momentum of this important event, EUR/USD should have kept moving higher. But it didn’t.

After jumping as high as 1.3295 in overnight trading on January 1, by mid-day on January 2 EUR/USD erased all of the gains. Take a look:

What happened? What “outside force” veered the “rock” off its course?

Well, none, really. Sure, pundits can rationalize now, after the fact, what details in the “fiscal cliff” deal may have changed the minds of forex traders. But the fact remains that, as EUR/USD was rising, nothing was suggesting that the “rock” would soon stop its ascent — and fall.

Here’s where Elliott wave analysis gives you an edge. With Elliott, you don’t rely on the news stories (“outside forces”) that almost everyone else uses to forecast the markets (“the rocks”).

Instead, you study Elliott wave patterns in market charts. Every rally and decline reflects the decisions — and emotions — of the traders. Study that instead, and you’ll soon realize that, more often than not, the markets tip their hands before the news is ever announced.

For example, our Currency Specialty Service analysts did not know that the “fiscal cliff” would be averted. And they didn’t need to, because Elliott wave patterns in EUR/USD were already bullish:

EURUSD (Intraday)
Posted On: Dec 31 2012
11:13PM ET / Jan 1 2013 4:13AM GMT
Last Price: 1.3200
[Consolidating before higher] Prints above 1.3286, the ‘b’ wave high, would begin to favor a thrust from a fourth wave triangle going forward.

Now, that’s a real, tangible advantage.

As you can tell from this example, EWI’s Currency Specialty Service delivers true forward-looking analysis.  Get our forecast for the U.S. dollar plus 5 hidden market opportunities for 2013 in a brand-new FREE report >>


Free Report: 5 Hidden Market Opportunities for 2013

In this special 21-minute video report, EWI Senior Currency Strategist Jim Martens looks past the obvious — the “fiscal cliff,” the Fed, etc. — to give you a U.S. dollar forecast for 2013 that would astonish the mainstream experts. Jim then walks you through 5 precise Elliott wave “roadmaps” for 5 key FX market opportunities in the year ahead.

BONUS: You also get Jim’s new 5-minute video update featuring 2 major currency pairs.

All you need to access this video report is a FREE Club EWI profile.

Complete your free Club EWI profile now and get instant access to these special videos >>

Club EWI is the world’s largest Elliott wave community with more than 325,000 members. Membership is 100% free and includes free reports, tutorials, videos, special events, promotional offers and access to the valuable EWI Q&A Message Board.

This article was syndicated by Elliott Wave International and was originally published under the headline Forex Trading: Why You Need to Look Past “Fiscal Cliffs”. EWI is the world’s largest market forecasting firm. Its staff of full-time analysts led by Chartered Market Technician Robert Prechter provides 24-hour-a-day market analysis to institutional and private investors around the world.


Uganda holds rate, inflation in check, growth improving

By www.CentralBankNews.info     Uganda’s central bank kept its Central Bank Rate (CBR) steady at 12.0 percent, saying inflationary pressures were under control and economic growth was starting to pick up with a stronger recovery expected later this year as the impact of earlier rate cuts feed through to private expenditure.
    The Bank of Uganda (BOU), which cut rates by 11 percentage points in 2012, said a rise in inflation in December was due to seasonal factors, but “looking ahead, inflation will remain moderate for most of 2013 and stabilise around the BOU medium-term policy target of 5.0 percent.”
    Uganda’s inflation rate rose to 5.5 percent in December from November’s 4.9 percent but the bank said the core rate of 4.6 percent was still within the bank’s 5.0 percent target.
    Economic activity in Uganda was starting to improve, the BOU said, with Gross Domestic Product expanding by a quarterly 2.0 percent in the first quarter of fiscal 2012/13 and monetary aggregates were also picking up though private sector credit growth was still subdued, partly on account of the high lending rates on shilling-denominated loans.

    “Given the lag in the monetary policy transmission mechanism, I expect a further reduction in lending rates,” the bank quoted the governor, Prof. E. Tumusiime-Mutebile, as saying in a statement.
    The BOU said it considers its current policy stance to be accommodative and supportive of growth as well as anchoring inflation expectations around the bank’s target.
    Looking ahead, the BOU was more optimistic than last month when it said that growth prospects had weakened and the negative output gap should persist through the 2012/13 year that ends June 30.
    “A stronger economic growth recovery should start in the later part of 2013 as the accommodative monetary policy stance pursued in 2012 and improvement in credit extensions feed through to private domestic expenditure,” the BOU said today, adding:
    “Furthermore, the improving global economic outlook may strengthen domestic economic activity in the near term.”

    www.CentralBankNews.info

Riskier Assets Extend Upward Trend

Source: ForexYard

With the exception of the euro, which was negatively affected by EU manufacturing data, most higher-yielding currencies, commodities and precious metals saw upward movement yesterday. Analysts attributed the bullish movement to investor risk taking, after US lawmakers agreed to a last minute deal to avoid the so called “fiscal cliff” of tax increases and spending cuts that threatened to bring another recession. Today, the main piece of economic news is likely to be the US ADP Non-Farm Employment Change at 13:15 GMT, which is widely considered an accurate predictor of Friday’s all-important Non-Farm Payrolls report.

Economic News

USD – ADP Data, FOMC Minutes Likely to Impact Dollar Today

The US dollar saw downward movement against its higher-yielding currency rivals throughout the day yesterday, after a last minute budget deal by US lawmakers encouraged investors to shift their funds to riskier assets. The AUD/USD advanced more than 40 pips during European trading, to eventually reach as high as 1.0516. Against the Canadian dollar, the greenback fell around 35 pips over the course of the day to trade as low as 0.9836.

Today, dollar traders will want to pay attention to several potentially significant US indicators. Specifically, the ADP Non-Farm Employment Change and FOMC Meeting Minutes, respectively scheduled for 13:15 and 19:00 GMT, are expected to create the most market volatility. With the ADP figure forecasted to come in at 134K, significantly higher than last month’s result, risk taking by investors may weaken the greenback further. Additionally, if the FOMC minutes indicate positive growth prospects for the US, riskier currencies could continue gaining on the dollar.

EUR – EU Manufacturing Data Leads to Losses for the Euro

The euro took moderate losses against both the Japanese yen and US dollar during European trading yesterday, following the release of EU manufacturing data which indicated that the region was still deep in recession. The EUR/JPY fell some 50 pips during the morning session, eventually trading as low as 115.16, before an upward correction brought the pair to 115.55. The EUR/USD lost more than 40 pips during the first part of the day to reach as low as 1.3231, before bouncing back to 1.3255 by the beginning of the evening session.

The main piece of euro-zone news today is likely to be the German Unemployment Change, scheduled to be released at 08:55 GMT. As the EU’s biggest economy, German indicators tend to have a strong impact on the euro. Today’s figure is forecasted to come in at 11K, which if true, would signal that the German labor sector is weakening and may lead to additional losses for the euro. That being said, if any of today’s US news comes in above expectations, investor risk taking may help the euro recoup some of its losses.

Gold – Gold Benefits from Weakened US Dollar

The price of gold shot up to a two-week high yesterday, following positive US news which weakened the dollar and made gold cheaper for international buyers. The precious metal advanced more than $13 an ounce during European trading, eventually trading as high as $1694.79.

Today, gold traders will want to monitor news out of both the euro-zone and US. If any of the news leads to additional risk taking in the marketplace, the safe-haven US dollar could take further losses, which may help gold extend its recent bullish run.

Crude Oil – Risk Taking Leads to Major Gains for Crude Oil

The price of crude oil hit its highest level in almost three-months yesterday, after US lawmakers announced that they had reached a budget agreement and investors shifted their funds to riskier assets. The commodity, which traded as high as $93.78 during the afternoon session, gained more than $1 a barrel during European trading.

Today, the ADP Non-Farm Employment Change is likely to have the biggest impact on oil prices. If the indicator comes in at or above the expected 134K, it would signal additional improvements in the US labor sector and could lead to further gains for higher yielding commodities like crude oil.

Technical News

EUR/USD

The Bollinger Bands on the weekly chart are narrowing, indicating that a price shift could occur in the near future. Furthermore, the Williams Percent Range on the same chart has crossed over into overbought territory, signaling that the price shift could be downward. Opening short positions may be the wise choice for traders today.

GBP/USD

While the Williams Percent Range on the weekly chart is in overbought territory, most other long-term technical indicators are currently in neutral territory, making a definitive trend difficult to predict at this time. Taking a wait and see approach may be the best choice for traders, as a clearer picture is likely to present itself in the near future.

USD/JPY

The Relative Strength Index on the weekly chart has crossed into overbought territory, indicating that a downward correction could occur in the near future. This theory is supported by the daily chart’s Williams Percent Range, which is currently at -10. Opening short positions may be the wise choice for this pair.

USD/CHF

A bullish cross on the weekly chart’s Slow Stochastic is signaling that this pair could see an upward correction in the coming days. Additionally, the Williams Percent Range on the same chart has dropped into oversold territory. Traders may want to open long positions today, ahead of possible upward movement.

The Wild Card

CAD/CHF

The daily chart’s Bollinger Bands are narrowing, indicating a price shift could occur in the near future. Furthermore, the MACD/OsMA on the same chart has formed a bullish cross, indicating that the price shift could be upward. This may be a good time for forex traders to open long positions, ahead of a possible bullish correction.

Forex Market Analysis provided by ForexYard.

© 2006 by FxYard Ltd

Disclaimer: Trading Foreign Exchange carries a high level of risk and may not be suitable for all investors. There is a possibility that you could sustain a loss of all of your investment and therefore you should not invest money that you cannot afford to lose. You should be aware of all the risks associated with Foreign Exchange trading.


U.S. Dollar managed to regain part of lost positions

U.S. Dollar managed to regain part of lost positions

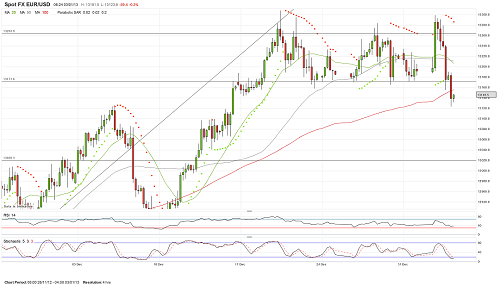
EURUSD

Despite the festive mood with which EUR/USD pair made ​​an attempt to rise to 33rd figure, but the pair failed after all. After testing 1.3299 level, the pair turned and was gradually decreasing, it fell to support near 1.3170 level. Today during the Asian session this level has been overcome, and rate of the pair fell to 1.3124, it found itself below 100-day moving average on the 4-hour chart. Thus, the pair formed out of the emerged diapason, but in a downward direction. Nevertheless passing of supports does not mean a reversal of the current trend, because the correction down to 1.3020 is quite normal and does not cause feelings of acute anxiety among bulls on the single currency. But loosing of this level will make nervous a lot of traders and then the pair may fall to 1.2876 level, which can be seen as the last bastion of the bulls on euro. 1.3170 level will now act as a resistance and, in theory, should attempt to limit the growth of euro/dollar pair.

eurusd03.01.2013

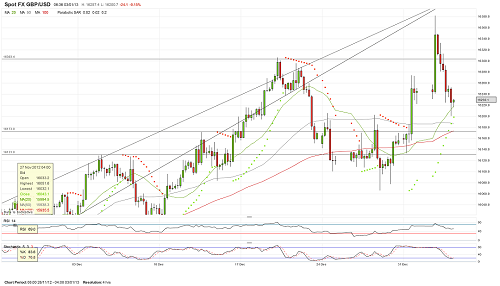
GBPUSD

In the first trading night after New Year’s GBP/USD has jumped to 1.6382, breaking, thus, an important resistance at 1.6303. This was to be a contributing factor for further growth, if, of course, the pair could hold above 63rd figure. But this never happened, because pound lost all positions it gained at night, it crossed in the opposite direction 63rd figure and fell to 1.6201. As long as the GBP/USD is trading above 1.6120-1.6080, this downward movement should be viewed as corrective. The nearest support is around 1.6200-1.6170. For resumption of upward trend the pair needs to overcome resistance at 1.6303 again.

gbpusd03.01.2013

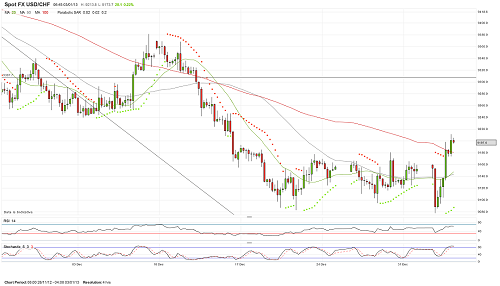
USDCHF

U.S. dollar decided to show its nature in pair with Swiss franc too. Falling to 0.9078 attracted buyers, as a result the pair bounced back from an important support and increased to 0.9211. Thus, the dollar could rise and is now holding above the 100-day moving average through the 0.9182 level. Now, pair bulls need to keep a positive attitude and not let the dollar to fall below this level. In this case, an American will develop upward trend towards 0.9240-0.9300. While any strengthening of it should be viewed as corrective, so approaching to the 93rd figure one may consider opening of short positions on the dollar.

usdchf03.01.2013

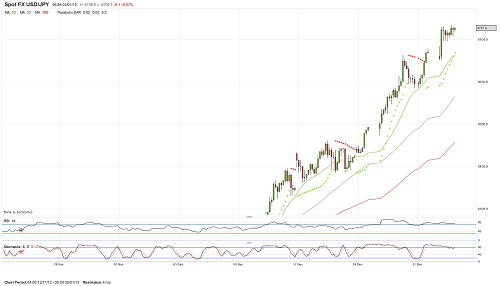
USDJPY

After rising to another maximum at 87.35 the next move in dollar/yen pair was stopped for now and all yesterday the pair was trading within the limits of this level and support at 86.96. The mood is still positive, as evidenced by the lack of any substantial rebounds, and the pair seem to be capable of continuing growth until the 88th figure. But consolidation at current levels did not lead to getting out of overbought zone and it was not supposed to, so risks of a downward correction are preserved. However, in terms of the clear negativity against the Japanese currency, to open short positions on the pair one should not be groping the top, but wait for signs of its formation.

usdjpy03.01.2013

Provided by IAFT


Gold, Silver Tick Lower as “Euphoria” of Fiscal Cliff Deal Fades, India Proposes Policies to Reduce Gold Imports

London Gold Market Report
from Ben Traynor
BullionVault
Thursday 3 January 2013, 07:15 EST

WHOLESALE gold bullion prices drifted lower to $1680 an ounce by the end of Thursday morning in London, having rallied to a two-week high yesterday following news of the deal to avert the so-called fiscal cliff in the US.

“Precious metals, including gold, [were] able to profit from the euphoria among market players in the wake of the compromise reached in the US budgetary dispute,” says today’s commodities note from Commerzbank.

Silver also ticked lower this morning, dropping back below $31 an ounce, while other commodities also dipped and the US Dollar gained.

India’s central bank meantime has announced a series of policy proposals aimed at curbing Indian gold imports.

After yesterday’s rally in stocks, European indexes eased lower Thursday morning.

US president Barack Obama yesterday signed into law the bill to avoid the so-called fiscal cliff of spending cuts and tax cut expiries, after it was approved by the House of Representatives on New Year’s Day.

“We see yesterday’s jump in risk assets as a one-off response to the US budget vote and expect consolidation today,” said a note from Credit Agricole this morning.

The fiscal cliff deal postponed planned spending cuts for two months, meaning these will still need to be debated, as will the issue of raising the government’s $16.4 trillion debt ceiling.

“The fact that Congress has left so many key items up in the air will likely provide a measure of support for gold,” reckons Ed Meir, metals analyst at brokerage INTL FCStone.

“It reinforces the general notion – now evident practically the world over – that politicians are losing control of their monetary base. This only makes the case for owning gold as an alternative ‘shadow’ currency all the more stronger.”

“Central bankers everywhere continue to debase their currencies and the financial markets prove treacherous,” adds Byron Wien, chairman of Blackstone Group, writing in his annual ’10 Surprises’ list, which predicts gold will reach $1900 an ounce.

Over in India, traditionally the world’s biggest gold buyer, the central bank has published a draft report from its Working Group on gold, set up to examine the impact of gold imports on India’s economy.

“Large gold imports are adversely impacting the current account deficit,” says the report from the Reserve Bank of India’s Working Group.

“There is a need to moderate the demand for gold imports.”

Among the Working Group’s suggestions is raising the loan-to-value limit for gold loan companies from 60%, which the RBI brought in last year, to 75%. Shares in gold loan companies Muthoot and Manappuram rallied earlier today following the report’s publications.

Other policies suggested by the report include encouraging people to invest in gold-backed financial instruments rather than buy gold itself, as well as “fiscal measures” to reduce gold imports.

On Wednesday, India’s finance minister said the government is considering raising the import duty on gold bullion.

“Fiscal initiatives may be appropriate, but they have to be implemented very carefully,” said C Rangarajan, economic advisor to India’s prime minister, in an interview with Indian television Thursday.

“We need to calibrate it in such a way that it does not result in an increase in the smuggling of gold… part of the reason for the high level of imports is the high level of inflation…if inflation rates start coming down, I expect gold imports to also come down.”

Indian gold dealers and jewelers meantime expect gold demand to rise by up to 15% in the first quarter of 2013 compared to the final three months of last year, the Economic Times reports.

“Farmers are expecting better [harvest] returns this year,” says Bachhraj Bamalwa, chairman of the All-India Gem & Jewellery Trade Federation.

“Moreover, the wedding season will be in full swing from January. This will give a fillip to rural demand.”

Ben Traynor
BullionVault

Gold value calculator   |   Buy gold online at live prices

Editor of Gold News, the analysis and investment research site from world-leading gold ownership service BullionVault, Ben Traynor was formerly editor of the Fleet Street Letter, the UK’s longest-running investment letter. A Cambridge economics graduate, he is a professional writer and editor with a specialist interest in monetary economics. Ben writes and presents BullionVault’s weekly gold market summary on YouTube and can be found on Google+

(c) BullionVault 2012

Please Note: This article is to inform your thinking, not lead it. Only you can decide the best place for your money, and any decision you make will put your money at risk. Information or data included here may have already been overtaken by events – and must be verified elsewhere – should you choose to act on it.


AUD/USD: Risk Confidence from World’s Largest Economies Waning the Greenback

Risk confidence continues to factor in further losses for the US dollar against its Australian currency counterpart. The resolution signed into a bill by President Barack Obama took out the uncertainty in the markets as to whether the world’s largest economy would fall over the fiscal cliff and cause an economic disaster. Hopes of a steady economic revival in China are also pushing in gains for the Aussie today.

The agreement boosts taxes on the wealthiest Americans, while preserving tax cuts for most American households. While effectively averting a looming fiscal cliff that had threatened to plunge the nation back into recession, the bill also extends expiring jobless benefits, prevents cuts in Medicare reimbursements to doctors and delays for two months billions of dollars in across-the-board spending cuts in defense and domestic programs.

Further adding to the market’s risk sentiment are the US labor market data scheduled for release today. After a lackluster 118,000 release for the month of November, December ADP Non-Farm Employment Change is estimated to reach 134,000. Also, the labor department is anticipated to post a fourth straight week of Jobless Claims with less than 365,000 filings. Analysts key in a 356,000 figure for the last week of 2012, which could bring the December average to less than 353,000.

Also, after a gauge of China’s manufacturing showed a third month of expansion, data from China earlier today showed that the services sectors likewise expanded in December. This further adds evidence that the recovery in the world’s second-biggest economy will extend into the new year, positively affecting the currency of its trade partner from the Land Down Under.

A long position is recommended for the AUDUSD in light of the market optimism. Still, be on the watch for likely technical price corrections as the currency pair is already trading near the overbought territory.

For more news, analysis, technical charts and candlestick analysis, visit AlgosysFx Forex Trading Solutions.

Market Trends 03.01.2013

Source: ForexYard

printprofile

Hey Everyone,

Below are some market trends for today.

Good luck!

-Dan

Gold- May see upward movement today
Support- 1670.54
Resistance- 1696.83

Silver- May see upward movement today
Support- 30.33
Resistance- 31.41

Crude Oil- May see downward movement today
Support- 91.65
Resistance-93.56

Dax 30- May see downward movement today
Support- 7621.76
Resistance- 7850.00

EUR/USD May see upward movement today
Support- 1.3077
Resistance- 1.3216

Read more forex news on our forex blog

Forex Market Analysis provided by ForexYard.

© 2006 by FxYard Ltd

Disclaimer: Trading Foreign Exchange carries a high level of risk and may not be suitable for all investors. There is a possibility that you could sustain a loss of all of your investment and therefore you should not invest money that you cannot afford to lose. You should be aware of all the risks associated with Foreign Exchange trading.

Market Review 03.01.2013

Source: ForexYard

printprofile

The euro, weighed down by weak EU manufacturing data from yesterday, lost more than 60 pips against the US dollar in overnight trading, eventually reaching as low as 1.3126, before bouncing back to its current level of 1.3150.

Gold prices saw a minor downward correction during the Asian session, but remained within reach of yesterday’s two-week high. The precious metal is currently trading at $1683.49 an ounce.

After hitting a three-month high yesterday at $93.83, crude oil saw slight bearish movement during overnight trading, and is currently trading at $92.72 a barrel.

Main News for Today

US ADP Non-Farm Employment Change- 13:15 GMT
• The ADP figure is considered an accurate predictor of tomorrow’s all-important Non-Farm Payrolls data
• Analysts are forecasting today’s news to come in moderately higher than last month’s, which if true, could lead to risk taking in the marketplace and boost riskier assets

US Unemployment Claims- 15:30 GMT
• Predictions are calling for today’s figure to come in at 356K, slightly higher than last week’s
• If today’s news comes in higher than expected, risk aversion could boost safe-haven currencies like the USD and JPY

Read more forex news on our forex blog

Forex Market Analysis provided by ForexYard.

© 2006 by FxYard Ltd

Disclaimer: Trading Foreign Exchange carries a high level of risk and may not be suitable for all investors. There is a possibility that you could sustain a loss of all of your investment and therefore you should not invest money that you cannot afford to lose. You should be aware of all the risks associated with Foreign Exchange trading.