US stock market ended at a new record on Tuesday. The S&P 500 advanced 0.3% to 2973.02. Dow Jones industrial gained 0.3% to 26786.75. The Nasdaq added 0.2% to 8109.09. The dollar weakening resumed as Cleveland Fed President Loretta Mester said while she saw “some chance” that the economy could stumble this year, she would need to see more hard evidence of a significant slowdown to advocate for interest rate cuts.: the live dollar index data show the ICE US Dollar index, a measure of the dollar’s strength against a basket of six rival currencies, slipped 0.01% to 96.74 and is lower currently. Futures on US stock indices point to higher openings today.
FTSE 100 leads European indexes gains
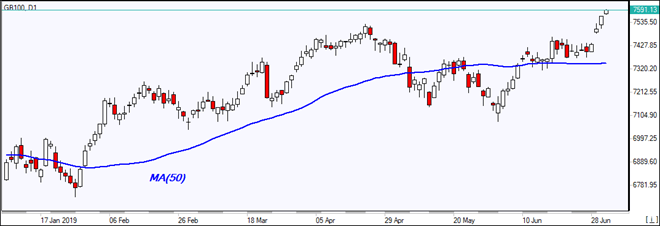
European stocks advanced fifth consecutive session on Tuesday despite US threat to impose additional tariffs on EU goods worth $4 billion amid a prolonged dispute with EU over aircraft subsidies. The EUR/USD edged higher while GBP/USD continued sliding with both pairs lower currently. The Stoxx Europe 600 ended 0.4% higher led by utility shares. The German DAX 30 inched up 0.04% to 12526.72 despite 0.6% decline over month in German retail sales for May. France’s CAC 40 added 0.2%. UK’s FTSE 100 rose 0.8% to 7559.19 despite data showing that UK construction activity suffered its sharpest downturn in over a decade in June.
Australia’s All Ordinaries Index gains while other Asian indexes fall
Asian stock indices are mostly lower today. Nikkei fell 0.5% to 21638.16 as yen continued its slide against the dollar. Chinese stocks are retreating after report growth of activity in China’s service sector continued to slow in June: the Shanghai Composite Index is down 1% while Hong Kong’s Hang Seng index is 0.3% lower. Australia’s All Ordinaries Index however extended gains 0.5% with Australian dollar little changed against the greenback as Australia’s trade surplus hit record high in May.
Brent futures prices are edging lower today. The American Petroleum Institute late Tuesday report indicated US crude inventories fell by 5 million barrels last week. Prices slumped yesterday: September Brent dropped 4.1% to $62.40 a barrel on Tuesday. Today at 16:30 CET the Energy Information Administration will release US Crude Oil Inventories.
Note: This overview has an informative and tutorial character and is published for free. All the data, included in the overview, are received from public sources, recognized as more or less reliable. Moreover, there is no guarantee that the indicated information is full and precise. Overviews are not updated. The whole information in each overview, including opinion, indicators, charts and anything else, is provided only for familiarization purposes and is not financial advice or а recommendation. The whole text and its any part, as well as the charts cannot be considered as an offer to make a deal with any asset. IFC Markets and its employees under any circumstances are not liable for any action taken by someone else during or after reading the overview.
Technical analyst Clive Maund discusses why he believes silver is amazingly cheap and a sure sign that a major precious metals sector bull market is starting.
We have already been over the reasons why a major precious metals (PM) sector bull market is starting, and remarked on how undervalued silver is compared to gold, and how this is typical at the start of a major sector bull market. But it is worth “thumping the table” over this, because silver and silver investments may well be the best place of all to put your money at this time.
Many silver investors are manic-depressive and fanatical, which is a reality that we can turn to our advantage, for if we can figure when they are just starting to emerge from the depths of despair, it is the time to move into the sector in a big way.
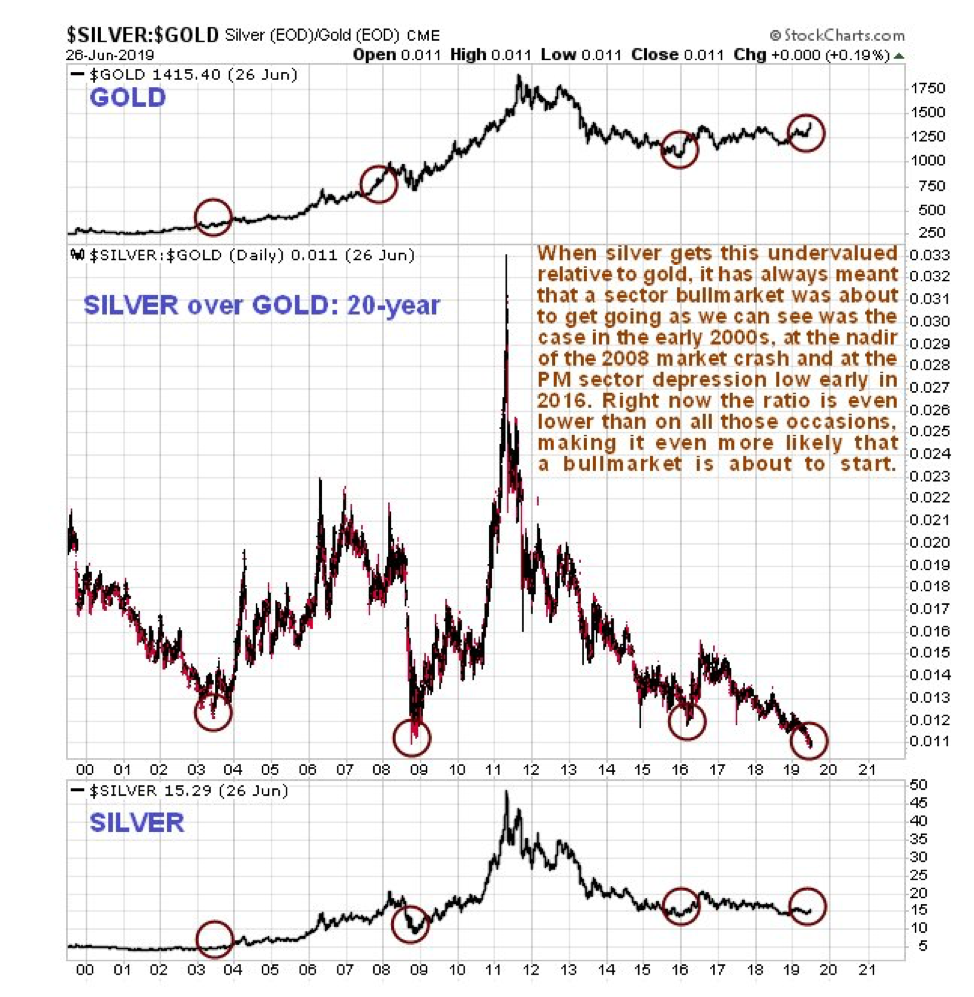
They are just starting to emerge from the depths of despair right now as it happens, which is shown graphically by the silver-to-gold ratio, the basis of which is that when investors in the sector are at their most risk-averse, they tend to favor gold over silver. This is hardly surprising, as gold conjures up images of solidity and security to a much greater extent than silver, which is also known as “poor man’s gold.”
It is thus most illuminating to observe a long-term 20-year chart of the silver-to-gold ratio. Here we see that the rare occasions where it has dropped to the extremely low levels it is now at have always preceded a major sector bull market, except early in 2016, which preceded a big rally. What is remarkable right now is that this ratio has even exceeded its earlier record lows, which makes a new sector bull market even more likely. This indicator, just by itself, is a strong sign that this is what’s brewing.
Now to examine silver’s latest charts to see how it is shaping up.
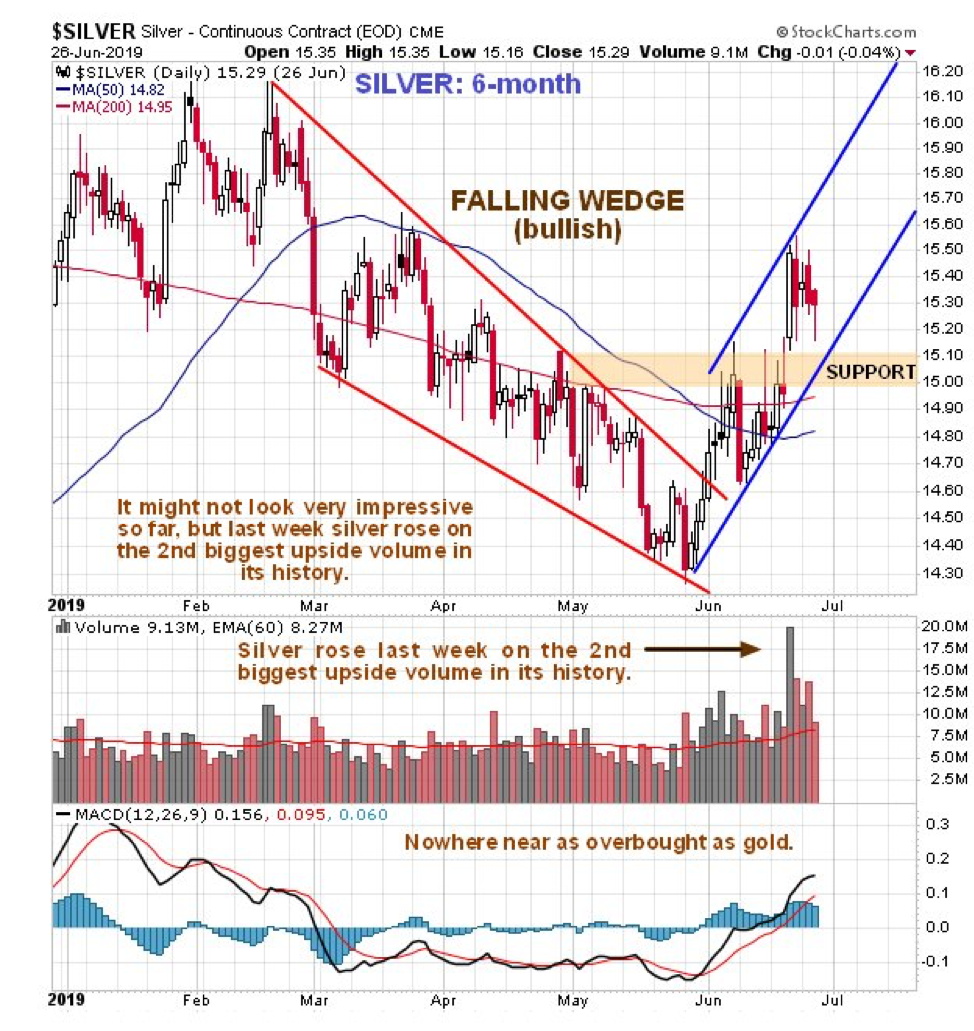
On the six-month chart we can see that although silver has reversed, breaking out of its preceding downtrend into a new uptrend, it has still only risen by a meager $1 from its late May lowsbig deal!! Rather than being upset by this, we should be thankful that it hasn’t risen more, because otherwise silver investments would have gone through the roof. Silver’s restrained performance so far is giving us more time to buy investments across the sector before it really gets moving. An important point to note before leaving this chart is the strong volume on a big up-day last week, which was the second biggest up-day volume in history, which is a very bullish sign.
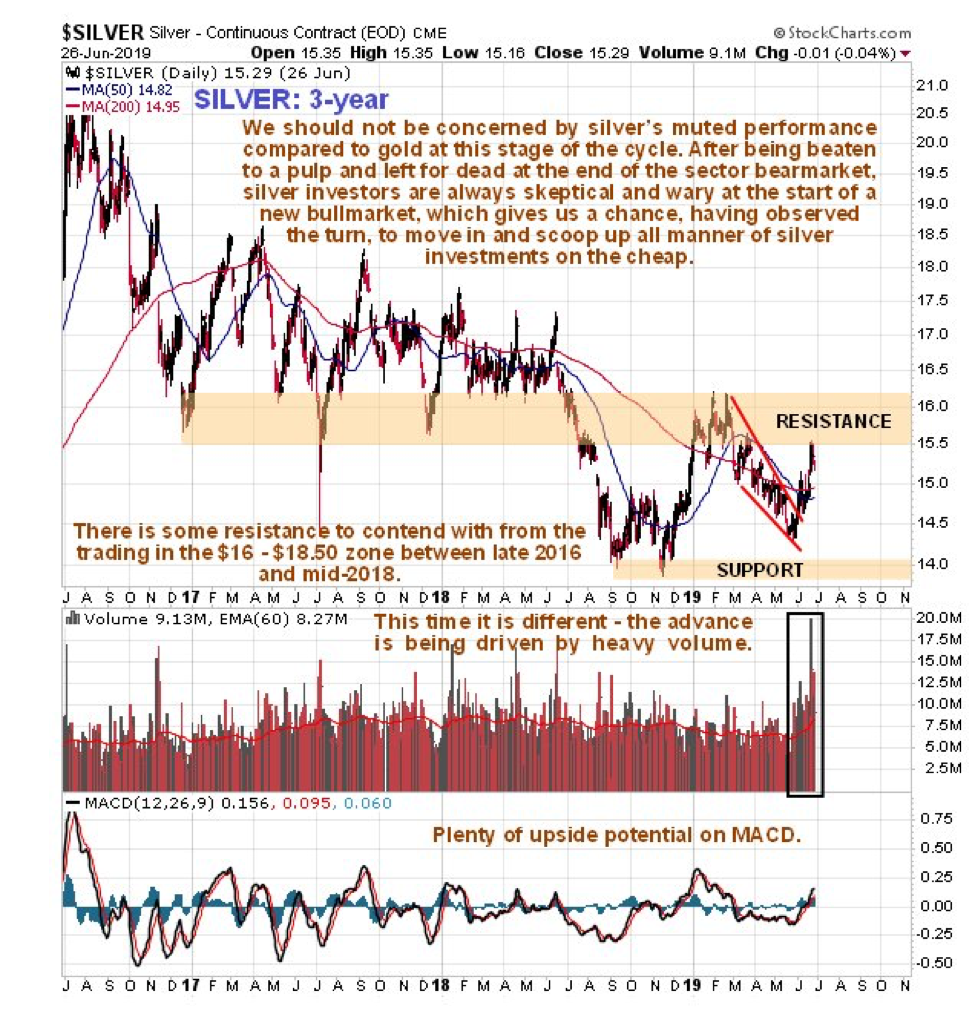
The three-year chart shows that silver has been an especially dull market during this period. But what is interesting is to compare this chart to the three-year chart for gold in the article Gold’s Epochal Breakout, which looks way different and shows a massive divergence that is going to be made good by silver catching up big time at some point. Although silver’s three-year chart still doesn’t look very inspiring, with weak price performance and an overhang of resistance between about $16 and $18.50, the volume buildup of recent weeks, coupled with gold’s strong performance, suggests this resistance could be overcome a lot more quickly and easily than many would believe possible.
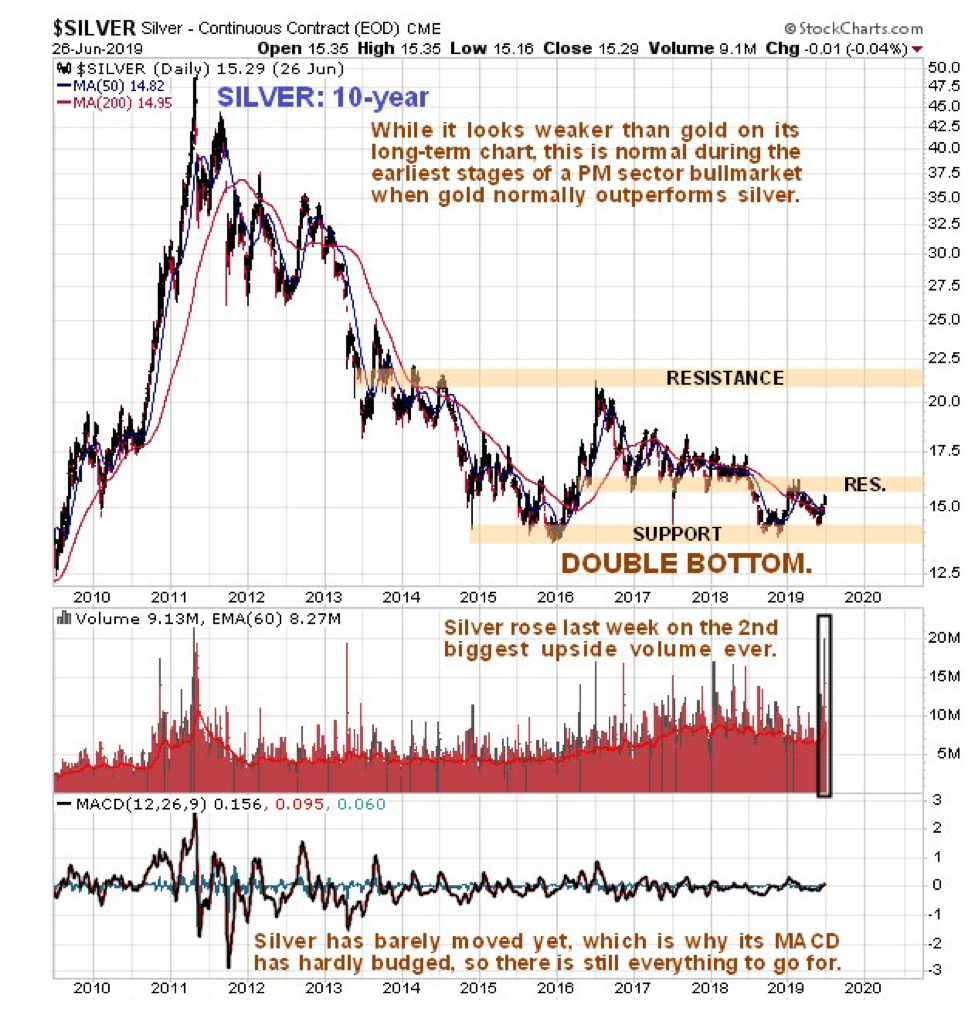
Finally, the long-term 10-year chart shows that despite gold breaking out from its giant six-year long base pattern over the past week or so, silver is still scraping along not very far off its lows. However, this is not a situation that is expected to persist for much longer. If gold goes up it’s going to take silver with it, and the volume buildup in silver as it has risen off recent lows suggests that this rally has legs. What is believed to be happening is that silver is just starting to rise off the second low of a double bottom, whose first low occurred late in 2015/early in 2016. If this interpretation is correct, then we are at an excellent entry point here for all silver-related investments.
Originally posted on CliveMaund.com at 2.05 pm EDT on 27th June 2019.
Clive Maund has been president of www.clivemaund.com, a successful resource sector website, since its inception in 2003. He has 30 years’ experience in technical analysis and has worked for banks, commodity brokers and stockbrokers in the City of London. He holds a Diploma in Technical Analysis from the UK Society of Technical Analysts.
Disclosure: 1) Statements and opinions expressed are the opinions of Clive Maund and not of Streetwise Reports or its officers. Clive Maund is wholly responsible for the validity of the statements. Streetwise Reports was not involved in the content preparation. Clive Maund was not paid by Streetwise Reports LLC for this article. Streetwise Reports was not paid by the author to publish or syndicate this article. 2) This article does not constitute investment advice. Each reader is encouraged to consult with his or her individual financial professional and any action a reader takes as a result of information presented here is his or her own responsibility. By opening this page, each reader accepts and agrees to Streetwise Reports’ terms of use and full legal disclaimer. This article is not a solicitation for investment. Streetwise Reports does not render general or specific investment advice and the information on Streetwise Reports should not be considered a recommendation to buy or sell any security. Streetwise Reports does not endorse or recommend the business, products, services or securities of any company mentioned on Streetwise Reports. 3) From time to time, Streetwise Reports LLC and its directors, officers, employees or members of their families, as well as persons interviewed for articles and interviews on the site, may have a long or short position in securities mentioned. Directors, officers, employees or members of their immediate families are prohibited from making purchases and/or sales of those securities in the open market or otherwise from the time of the interview or the decision to write an article until three business days after the publication of the interview or article. The foregoing prohibition does not apply to articles that in substance only restate previously published company releases.
Charts provided by the author.
CliveMaund.com Disclosure: The above represents the opinion and analysis of Mr Maund, based on data available to him, at the time of writing. Mr. Maund’s opinions are his own, and are not a recommendation or an offer to buy or sell securities. Mr. Maund is an independent analyst who receives no compensation of any kind from any groups, individuals or corporations mentioned in his reports. As trading and investing in any financial markets may involve serious risk of loss, Mr. Maund recommends that you consult with a qualified investment advisor, one licensed by appropriate regulatory agencies in your legal jurisdiction and do your own due diligence and research when making any kind of a transaction with financial ramifications. Although a qualified and experienced stock market analyst, Clive Maund is not a Registered Securities Advisor. Therefore Mr. Maund’s opinions on the market and stocks can only be construed as a solicitation to buy and sell securities when they are subject to the prior approval and endorsement of a Registered Securities Advisor operating in accordance with the appropriate regulations in your area of jurisdiction.
An H.C. Wainwright & Co. report presented the investment bank’s reasons for its bullish view on this California-based biotech.
In a June 26 research note, analyst Andrew Fein reported that H.C. Wainwright & Co. initiated coverage on Denali Therapeutics Inc. (DNLI:NASDAQ) with a Buy rating and a $28 per share target price. The life sciences firm is currently trading at around $20.81 per share.
Among H.C. Wainwright’s investment thesis on Denali is the belief that the biotech’s pipeline offers short- and long-term value that the Street may not fully appreciate at this time, Fein highlighted.
Denali’s lead candidate DNL201, a leucine-rich repeat kinase 2 (LRRK2) inhibitor is a case in point, he wrote. Biomarker data are expected in Q4/19, representing a potential inflection point for the stock. Also, Fein purported that while the potential for DNL201 in Parkinson’s patients with LRRK2 mutations, which accounts for only 12% of all people with the disease, has been factored into the share price, the “upside of the opportunity in the sporadic Parkinson’s disease population” has not been.
Another significant point regarding DNL201, Fein indicated, is that Denali is the only company with an LRRK2 in the clinic. GlaxoSmithKline and Biogen each announced their intention to move their LRRK2 candidate into the clinic, but Denali’s therapeutic already showed safety and tolerability in Phase 1. “Denali has a substantial leg up in the race and can potentially advance quickly into pivotal trials,” the analyst added.
Also underappreciated is Denali’s DNL747, a receptor-interacting serine/threonine kinase 1 (RIPK1). Fein noted the company’s RIPK1 program has potential for application across central nervous system and peripheral indications, and that is its “most compelling value proposition.”Further, Denali’s partnership with Sanofi on DLN747 should eliminate development and commercial risks. “The RIPK1 program is a high-risk, high-reward play,” wrote Fein.
A third Denali therapeutic, DNL301, enabled by the company’s enzyme transport vehicle technology, for the treatment of Hunter syndrome, could “drive considerable near-term upside due to its validation for Denali’s blood brain barrier platform broadly,” Fein pointed out. Initial patient data are expected on DNL301 in mid-2020.
The investment rationale for Denali, Fein wrote, also includes the company’s approaches to problem solving and drug development, both of which mitigate risks along the way and result in better targets, better drug development and better delivery. “Founded by ex-Genentechers, we believe Denali has assembled a world-class team for this mission” and is “building a network of partnerships to expand its research and development and manufacturing capabilities,” the analyst added.
Disclosure: 1) Doresa Banning compiled this article for Streetwise Reports LLC and provides services to Streetwise Reports as an independent contractor. She or members of her household own securities of the following companies mentioned in the article: None. She or members of her household are paid by the following companies mentioned in this article: None. 2) The following companies mentioned in this article are billboard sponsors of Streetwise Reports: None. Click here for important disclosures about sponsor fees. 3) Comments and opinions expressed are those of the specific experts and not of Streetwise Reports or its officers. The information provided above is for informational purposes only and is not a recommendation to buy or sell any security. 4) The article does not constitute investment advice. Each reader is encouraged to consult with his or her individual financial professional and any action a reader takes as a result of information presented here is his or her own responsibility. By opening this page, each reader accepts and agrees to Streetwise Reports’ terms of use and full legal disclaimer. This article is not a solicitation for investment. Streetwise Reports does not render general or specific investment advice and the information on Streetwise Reports should not be considered a recommendation to buy or sell any security. Streetwise Reports does not endorse or recommend the business, products, services or securities of any company mentioned on Streetwise Reports. 5) From time to time, Streetwise Reports LLC and its directors, officers, employees or members of their families, as well as persons interviewed for articles and interviews on the site, may have a long or short position in securities mentioned. Directors, officers, employees or members of their immediate families are prohibited from making purchases and/or sales of those securities in the open market or otherwise from the time of the interview or the decision to write an article until three business days after the publication of the interview or article. The foregoing prohibition does not apply to articles that in substance only restate previously published company releases.
Disclosures from H.C. Wainwright & Co., Denali Therapeutics Inc., First Take, June 26, 2019
Investment Banking Services include, but are not limited to, acting as a manager/co-manager in the underwriting or placement of securities, acting as financial advisor, and/or providing corporate finance or capital markets-related services to a company or one of its affiliates or subsidiaries within the past 12 months.
I, Andrew S. Fein, Li Wang Watsek, Alicia Yin, Ph.D. and Matthew Caufield, certify that 1) all of the views expressed in this report accurately reflect my personal views about any and all subject securities or issuers discussed; and 2) no part of my compensation was, is, or will be directly or indirectly related to the specific recommendation or views expressed in this research report; and 3) neither myself nor any members of my household is an officer, director or advisory board member of these companies.
None of the research analysts or the research analyst’s household has a financial interest in the securities of Denali Therapeutics, Inc., AC Immune SA and Biogen, Inc. (including, without limitation, any option, right, warrant, future, long or short position).
As of May 31, 2019 neither the Firm nor its affiliates beneficially own 1% or more of any class of common equity securities of Denali Therapeutics, Inc., AC Immune SA and Biogen, Inc.
Neither the research analyst nor the Firm has any material conflict of interest in of which the research analyst knows or has reason to know at the time of publication of this research report.
The research analyst principally responsible for preparation of the report does not receive compensation that is based upon any specific investment banking services or transaction but is compensated based on factors including total revenue and profitability of the Firm, a substantial portion of which is derived from investment banking services.
The Firm or its affiliates did not receive compensation from Denali Therapeutics, Inc. and Biogen, Inc. for investment banking services within twelve months before, but will seek compensation from the companies mentioned in this report for investment banking services within three months following publication of the research report.
The Firm or its affiliates did receive compensation from AC Immune SA for investment banking services within twelve months before, and will seek compensation from the companies mentioned in this report for investment banking services within three months following publication of the research report.
H.C. Wainwright & Co., LLC managed or co-managed a public offering of securities for AC Immune SA during the past 12 months.</;p>
The Firm does not make a market in Denali Therapeutics, Inc., AC Immune SA and Biogen, Inc as of the date of this research report.
H.C. Wainwright & Co., LLC and its affiliates, officers, directors, and employees, excluding its analysts, will from time to time have long or short positions in, act as principal in, and buy or sell, the securities or derivatives (including options and warrants) thereof of covered companies referred to in this research report.
The terms of the financial transaction and the potential reasons for it are discussed in a BTIG report.
In a June 26 research note, BTIG analyst Thomas Shrader reported that Esperion Therapeutics Inc. (ESPR:NASDAQ) agreed to an “up to $200 capped, tiered and revenue-based funding arrangement with a New York-based investment firm.”
This deal comes before Esperion’s maiden commercial launch, of its lipid lowering agent bempedoic acid, and would boost the company’s pro forma Q1/19 cash position to $355 million.
BTIG views the capital arrangement as “an insurance policy” for Esperion that “reflects a competitive landscape for bempedoic acid undergoing some flux,” Shrader noted. He indicated potential headwinds to the commercial uptake of bempedeoic acid and the bempedeoic acid-ezetimibe combination tablet include “Amarin’s Vascepa and recent price reductions of PCSK9s.”
Per the financial agreement, Esperion will receive an upfront payment of $125 million, another $25 million upon U.S. Food and Drug Administration approval of bempedoic acid and another potential $50 million, by option, in the first two years after product launch when the company achieves certain, undisclosed revenue objectives.
The initial royalty rate is set at 7.5% on U.S. net revenue below $250 million from sales of bempedoic acid and bempedoic acid-ezetimibe. The rate will decrease to 2.5% in 2021 when Esperion hits those same revenue objectives. It will drop again to 0.4% in 2024 if the company, by then, has repaid all of the capital it received via the arrangement.
Shrader relayed that Esperion management remains confident it will commercially debut its product in the U.S. It guided to having up to 45% of commercial and 20% of Medicare Part D lives covered at the launch, up to 60% commercial and 40% Part D lives covered by six months and up to 75% commercial and 60% Part D lives covered by 12 months post launch.
Shrader pointed out that “Chief Commercial Officer Mark Glickman previously was vice president of sales and marketing at Kos Pharmaceuticals, arguably the only other company of comparable size to successfully compete in the lipid management space.”
BTIG has a Buy rating and an $82 per share price target on Esperion, whose current share price is about $46.02.
Disclosure: 1) Doresa Banning compiled this article for Streetwise Reports LLC and provides services to Streetwise Reports as an independent contractor. She or members of her household own securities of the following companies mentioned in the article: None. She or members of her household are paid by the following companies mentioned in this article: None. 2) The following companies mentioned in this article are billboard sponsors of Streetwise Reports: None. Click here for important disclosures about sponsor fees. 3) Comments and opinions expressed are those of the specific experts and not of Streetwise Reports or its officers. The information provided above is for informational purposes only and is not a recommendation to buy or sell any security. 4) The article does not constitute investment advice. Each reader is encouraged to consult with his or her individual financial professional and any action a reader takes as a result of information presented here is his or her own responsibility. By opening this page, each reader accepts and agrees to Streetwise Reports’ terms of use and full legal disclaimer. This article is not a solicitation for investment. Streetwise Reports does not render general or specific investment advice and the information on Streetwise Reports should not be considered a recommendation to buy or sell any security. Streetwise Reports does not endorse or recommend the business, products, services or securities of any company mentioned on Streetwise Reports. 5) From time to time, Streetwise Reports LLC and its directors, officers, employees or members of their families, as well as persons interviewed for articles and interviews on the site, may have a long or short position in securities mentioned. Directors, officers, employees or members of their immediate families are prohibited from making purchases and/or sales of those securities in the open market or otherwise from the time of the interview or the decision to write an article until three business days after the publication of the interview or article. The foregoing prohibition does not apply to articles that in substance only restate previously published company releases.
Disclosures from BTIG, Esperion Therapeutics Inc., June 26, 2019
Analyst Certification I, Thomas Shrader, PhD, CFA, hereby certify that the views about the companies and securities discussed in this report are accurately expressed and that I have not received and will not receive direct or indirect compensation in exchange for expressing specific recommendations or views in this report. I, Julian Harrison, hereby certify that the views about the companies and securities discussed in this report are accurately expressed and that I have not received and will not receive direct or indirect compensation in exchange for expressing specific recommendations or views in this report.
The research analyst(s) responsible for the preparation of this report receives compensation based upon a variety of factors, including the quality and accuracy of research, internal/client feedback, and overall Firm revenues.
During the G20 summit, China and US agreed to re-start the trade talks. As the US trade war is slowing China’s growth, the collateral damage is now spreading in the US economy, while undermining global prospects.
Despite the White House’s efforts to lobby other countries against Huawei, President Trump also said that US companies can supply the technology giant, which the US, Department of Commerce blacklisted last month.
After Osaka, the negotiators face challenging obstacles, despite still another temporary timeout. Deep bilateral disagreements prevail about major structural issues.
But what’s the current economic impact of the new trade truce?
Limited short-term impact on China
In China, the most recent US tariff hikes on $200 billion of Chinese US exports is expected to penalize about 0.1% of China’s GDP growth in the coming year. That is enough to create significant concern, but not sufficient to cause substantial damage – yet.
Even if the US would impose 25% tariffs on all goods from China, the largest Chinese companies would likely adjust, thanks to their domestic focus.
As the US-based Standard & Poor’s has stressed, half of the rated Chinese companies are state-owned-enterprises (SOEs), which operate in sectors with limited US exposure.
Moreover, the vital property sector is also reliant on domestic demand.
Nevertheless, the secondary effects of a protracted and broader trade war could prove more challenging over time. In China, such a scenario could mean greater shifts in supply chains, currency volatility, eroding market confidence.
Despite Trump’s bravado, the US economy is far from immune to trade-war damage, however. In fact, the trade wars’ adverse impact is only beginning to bite in the US.
Broader impact on US industries
In the US, the tariff increase from 10% to 25% on $200 billion of Chinese imports could directly penalize some 0.3% from growth in the coming year.
Typically, US companies that garner a significant share of their revenues from China will take the most severe hits. That’s why Trump wants China to buy “tremendous” amounts of farm goods. US farm sector has suffered the most of retaliatory measures, while the White House’s $12 billion bailout package for farmers has failed to soften the blow.
In fact, the Trump administration has worked itself into a double-bind. If it piles up another bailout of $15 to $20 billion, it might prove too little too late in the farm sector, while other industries could demand similar packages.
The damage is spreading to advanced industries, which include semiconductor giants, such as Micron Tech and Texas Instruments (40% to 60% of revenues from China), and other technology conglomerates, including Apple and TTM Technologies (about 20%), and consumer and auto companies, such as NIKE and Cooper-Standard (10% to 20%).
The White House is pressuring US firms to move their supply chains away from China. Reportedly, Apple is considering diversifying15% to 30% of its capacity away from China. Yet such proposed moves would come with a huge cost.
None of the new country destinations can offer a high-level technology and logistics infrastructure that would be comparable to that in China. So the costs of these firms will climb, which will penalize their global competitiveness. Worse, today China is the world’s largest and most rapidly-growing marketplace. If US companies reduce their presence in China, they are taking a cut in their most vital future source of income.
That’s why Trump said in Osaka that US companies can – for “time being” – supply Huawei. These giants, particularly Intel and Alphabet (Google) have lobbied intensively for Huawei, which is their major client and a substantial source of revenues. Moreover, Qualcomm and Broadcom and US semiconductor and technology sector would be hit by the loss of Huawei orders.
Collateral damage in US economy
With continued trade tensions, the damage is spreading in the U.S. economy. As the fiscal stimulus impact is fading, private investment is softening and uncertainty increasing. US economic growth is likely to remain below 2.5% in 2019 and decelerate to 1.8% in 2020.
As the impact of the Trump tax cuts and other one-time benefits will diminish, US economy will be more vulnerable to a recession risk, even a major market correction.
Worse, if the talks fail and the White House will choose to expand tariffs against all Chinese trade, it will be harder for US firms to pass on costs to consumers, which will penalize these companies’ competitiveness.
If US would raise tariffs against all Chinese imports, US growth could plunge below 1 percent in 2020 – at the eve of the midterm election.
Global economic prospects
Global economic integration is typically measured by trade, investment and migration. After a decade of slow recovery, each indicated progress. But since 2018, the Trump administration’s tariff wars have effectively undermined the expected global recovery.
World investment remains sub-optimal. World trade has suffered extraordinary decline. World migration has plunged and the number of globally displaced now exceeds 70 million people – far more than after World War II.
Of course, there is still a chance to salvage the US-China trade talks. That, however, would require a substantial reassessment of the US stance and objectives. China will not sign a trade deal that is predicated on unilateral geopolitical objectives rather than economic realities.
The final outcome cannot be based on coercion. It must rely on a mutual effort at a sustained reconciliation that will reflect both countries’ sovereign interests and the compelling long-term economic realities of the global economy.
About the Author:
Dr. Dan Steinbock is an internationally recognized strategist of the multipolar world and the founder of Difference Group. He has served at India, China and America Institute (US), Shanghai Institutes for International Studies (China) and the EU Center (Singapore). For more, see https://www.differencegroup.net/
The original, shorter commentary was released by China Daily on July 1, 2019
Technical analyst Clive Maund charts the reasons why the recent gold breakout is genuine.
It has been a truly glorious month for gold, and the purpose of this update is to point out firstly that the gold breakout of the past week was genuine and secondly that any short-term reaction back as far as $1,380 or even $1,370 will not negate the breakoutinstead it should be seized upon as an opportunity to build positions across the sector, especially in trampled down undervalued silver stocks. Silver broke higher last week on its strongest upside volume since its frothy top in 2011 and on its second highest upside volume ever.
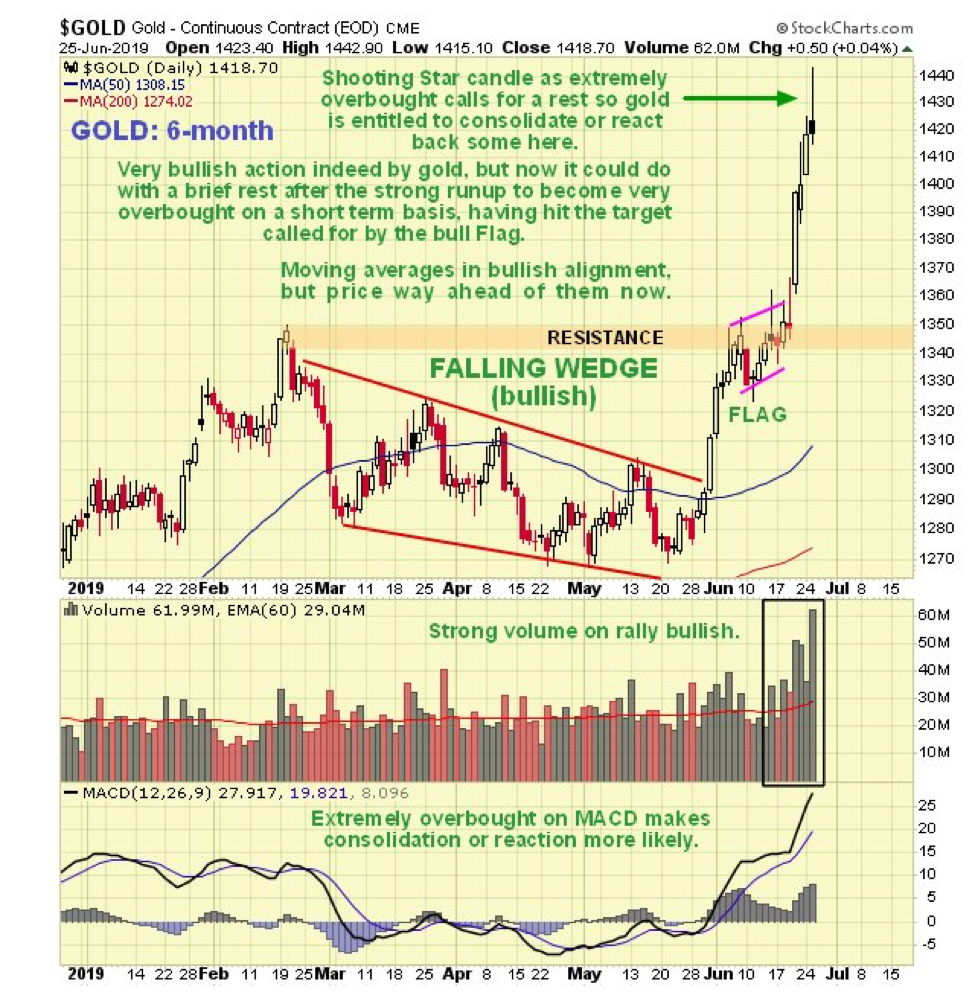
On the six-month gold chart we can see the impressive breakout run-up of recent days, which has taken gold to a flag target that it has reached in an extremely overbought state. This means it is entitled to take a rest here, and that is what it is doing.
Two other factors calling for immediate consolidation/reaction are the appearance of a short-term, bearish, shooting-star candlestick on the chart yesterday, and the fact that it has run way ahead of its moving averages, which are now in strongly bullish alignment. We should not be surprised, therefore, to see it react back in the near term, to perhaps $1,380 or even $1,370, which will have folks doubting that the gold breakout is genuine. But it is genuine, as made clear by the strong volume on the breakout, so we will use any such reaction as a buying opportunity.
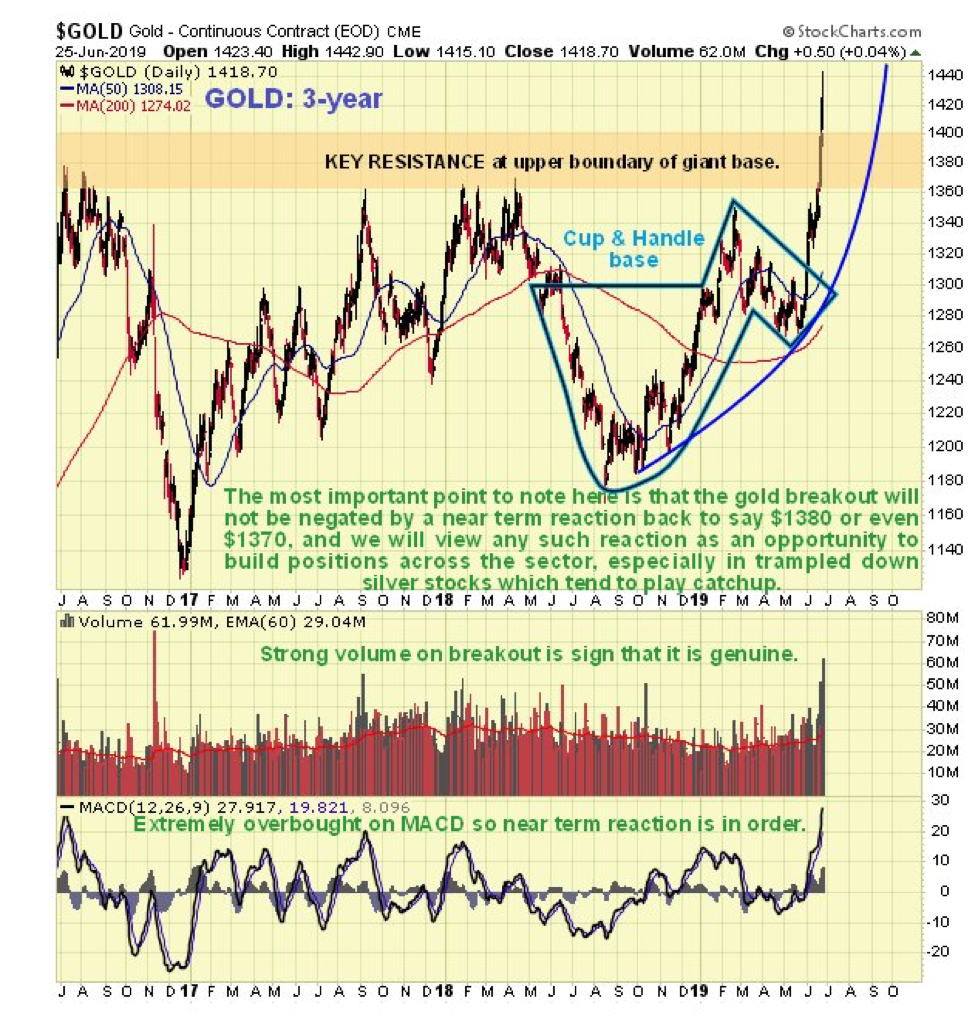
The three-year chart gives us useful perspective on the breakout, enabling us to see that it occurred from a fine cup-and-handle base that we had delineated quite a while back. This chart also makes clear how steep the recent rise has been and shows that it has become extremely overbought on its MACD (moving average convergence/divergence), which means that it could do with a rest now.
However, that said, a major and probably epochal breakout is occurring here, so gold is perfectly entitled to accelerate away to the upside, and is thus not expected to tarry for long. So any near-term weakness may be bought aggressively.
Fundamentally, gold has everything going for it here. Central banks are buying it hand-over-fist, major powers that have been bullied and threatened by the U.S., like China and Russia, are buying it hand-over-fist, in readiness for burying the dollar. The Fed and other central banks have painted themselves into a corner, where the only thing they can think of doing is printing money like crazy to try to stop the system from imploding. The world faces the grim prospect of massive unprecedented quantitative easing (state counterfeiting), negative interest rates, and the outright plunder of bank accounts, called bail-ins (theft), and they may even resort to thieving from retirement funds. Perhaps we can preempt them a bit here by thinking up a euphemism for it. What about PERG (Pensioners Expedite Rescue of Government)? It is a perfect storm that could cause gold to skyrocket.
Finally, let us wheel out our 10-year chart for gold yet again (nice, easy, cut-and-paste job) to remind ourselves of the enormous significance of this gold breakout. As we see, gold is breaking out of a giant six-year-long head-and-shoulders bottom/saucer base pattern, which actually may be considered to be a lengthy reaction within a much larger bull market going to the early 2000s. This giant base pattern is capable of supporting a massive bull market that looks set to go way beyond the earlier highs in 2011.
Originally posted on CliveMaund.com at 9.30 am EDT on 26th June 2019.
Clive Maund has been president of www.clivemaund.com, a successful resource sector website, since its inception in 2003. He has 30 years’ experience in technical analysis and has worked for banks, commodity brokers and stockbrokers in the City of London. He holds a Diploma in Technical Analysis from the UK Society of Technical Analysts.
Disclosure: 1) Statements and opinions expressed are the opinions of Clive Maund and not of Streetwise Reports or its officers. Clive Maund is wholly responsible for the validity of the statements. Streetwise Reports was not involved in the content preparation. Clive Maund was not paid by Streetwise Reports LLC for this article. Streetwise Reports was not paid by the author to publish or syndicate this article. 2) This article does not constitute investment advice. Each reader is encouraged to consult with his or her individual financial professional and any action a reader takes as a result of information presented here is his or her own responsibility. By opening this page, each reader accepts and agrees to Streetwise Reports’ terms of use and full legal disclaimer. This article is not a solicitation for investment. Streetwise Reports does not render general or specific investment advice and the information on Streetwise Reports should not be considered a recommendation to buy or sell any security. Streetwise Reports does not endorse or recommend the business, products, services or securities of any company mentioned on Streetwise Reports. 3) From time to time, Streetwise Reports LLC and its directors, officers, employees or members of their families, as well as persons interviewed for articles and interviews on the site, may have a long or short position in securities mentioned. Directors, officers, employees or members of their immediate families are prohibited from making purchases and/or sales of those securities in the open market or otherwise from the time of the interview or the decision to write an article until three business days after the publication of the interview or article. The foregoing prohibition does not apply to articles that in substance only restate previously published company releases.
Charts provided by the author.
CliveMaund.com Disclosure: The above represents the opinion and analysis of Mr Maund, based on data available to him, at the time of writing. Mr. Maund’s opinions are his own, and are not a recommendation or an offer to buy or sell securities. Mr. Maund is an independent analyst who receives no compensation of any kind from any groups, individuals or corporations mentioned in his reports. As trading and investing in any financial markets may involve serious risk of loss, Mr. Maund recommends that you consult with a qualified investment advisor, one licensed by appropriate regulatory agencies in your legal jurisdiction and do your own due diligence and research when making any kind of a transaction with financial ramifications. Although a qualified and experienced stock market analyst, Clive Maund is not a Registered Securities Advisor. Therefore Mr. Maund’s opinions on the market and stocks can only be construed as a solicitation to buy and sell securities when they are subject to the prior approval and endorsement of a Registered Securities Advisor operating in accordance with the appropriate regulations in your area of jurisdiction.
Any weakness in the Transportation Index near current levels would indicate investors and traders believe the global economy may continue to contract going forward and may be an ominous sign for the global stock markets.
The Transportation Index is a measure of the current expectations related to shipping, trucking, trains and all measure of forward expectations for goods, products and raw materials to be moved across nations, seas, states, and locations. When the economy is gaining strength, we typically expect to see the Transportation Index moving higher. When the economy is weakening, we typically expect to see the Transportation Index moving lower.
Since the peak in September 2018, the Transportation Index has moved much lower to establish a base near $8625 in December 2018. After that base formed, a series of price rotations pushed the Transportation Index up to $11,148, where it peaked, then began to trail a bit lower since May 2019. Our concern is that the Support/Resistance level, highlighted by the GREEN rectangle on this Weekly chart, represents a critical historical price that must be breached before any renewed strength in the global markets will be seen.
After the G20 meeting, last weekend, and the rally in the US stock market on Monday, we were a bit surprised that the Transportation Index failed to move dramatically higher following the global markets. This leads us to believe investors were taking advantage of a pricing issue related to the G20 and US/China trade war news that was not rooted in strength seen in the global economy. In other words, buy the rumor, sell the news. It would appear the rumor hit the markets Sunday in Tokyo and the news hit the US markets on Monday.
Skilled technical traders already know we must be cautious near these current all-time highs. Volatility can increase dramatically on news or other earnings data which may drive prices higher or lower over the next few weeks. As we start July (Q3) 2019, we should be preparing for earnings data to be released over the next 30+ days as well as continued news related to global trade issues. Additionally, the items which will be sold for Christmas and the holidays are already being shipped across the globe and being distributed to warehouses over the next few months prior to the start of the holiday season.
Historically, July through September are somewhat weak for the Transportation Index. Overall, the Transportation Index loses approximately 500 to 600 points over this 90-day span with a range (potentially) of over $3000 points in volatility. Bullish trending strength returns in October and November where the Transportation Index typically rallies approximately $5000 pts with a volatility range of about $7000 points. These historical trends suggest we could see quite a bit of volatility over the next 90 days with a decent chance at seeing a downward price move targeting recent December 2018 lows.
CONCLUDING THOUGHTS:
In previous articles, we’ve suggested a simple trade setup technique we use to identify entry and exit points – the 100% Fibonacci Extension Move. If this move holds true for the Transportation Index, then a move to levels near $8250 is about to unfold based on the move from Sept 2019 to Dec 2019. It would make sense that this move would likely happen between now and September 2019 – followed by a solid rally into the end of 2019 as our historical data suggests.
Now is the time to stay on top of these moves and to target the opportunity these bigger price rotations provide for technical traders. Simply put, we have just described a downside price move of about $2000 points in the Transportation Index followed by an upside price move of over $4000 to $5000 points. You don’t want to miss this one, folks.
I can tell you that huge moves are about to start unfolding not only in real estate, but metals, stocks, and currencies. Some of these super cycles are going to last years. Brad Matheny goes into great detail with his simple to understand charts and guide about this. His financial market research is one of a kind and a real eye-opener. PDF guide: 2020 Cycles – The Greatest Opportunity Of Your Lifetime
As a technical analysis and trader since 1997, I have been through a few bull/bear market cycles. I believe I have a good pulse on the market and timing key turning points for both short-term swing trading and long-term investment capital. The opportunities are massive/life-changing if handled properly.
I urge you to visit my Wealth Building Newsletter and if you like what I offer, join me with the 1 or 2-year subscription to lock in the lowest rate possible, get a FREE BAR OF GOLD and ride my coattails as I navigate these financial markets and build wealth while others lose nearly everything they own during the next set of crisis’.
Australia’s central bank lowered its benchmark cash rate for the second month in a row amid sluggish economic growth and inflation and said it was ready to lower rates further. The Reserve Bank of Australia (RBA) cut its cash rate by 25 basis points to a new historic low of 1.0 percent and has now cut it by 50 percent this year following a cut in June as interest rates continue their steady but consistent decline since November 2011. “This easing of monetary policy will support employment growth and provide greater confidence that inflation will be consistent with the medium-term target,” RBA said, adding lower interest rates will also help reduce the economy’s spare capacity. Looking ahead, RBA’s board said it would continue to monitor the labour market “and adjust monetary policy if needed to support sustainable growth in the economy and the achievement of the inflation target over time.” In a speech in at a community dinner in the city of Darwin shortly after RBA’s decision, Governor Philip Lowe added the two back-to-back rate cuts will put the economy on a better path toward winding back spare capacity and RBA was “prepared to adjust rates again if needed to get us closer to full employment and achieve the inflation target…” RBA’s rate cut today was widely expected following Lowe’s comments on June 20 that it would be unrealistic to expect the first rate cut on June 4 to materially shift the economy’s current path and “it is not unrealistic to expect a further reduction in the cash rate.” RBA repeated its view from last month that the outlook for the global economy remains “reasonable” but the risks are still tilted to the downside and the uncertainty generated by trade and technology disputes were affecting investment, boosting expectations of easier monetary policy by major central banks and lowering borrowing costs to historically low levels. As an example, Lowe in Darwin noted the Australian government can now borrow money for 10 years at around 1.3 percent, the lowest rate since 1901 when the former six British colonies became a federation. A softer economy and RBA’s easing has also helped lower the exchange rate of the Australian dollar since January 2018, with the Aussie today trading at 1.43 to the U.S. dollar, down 0.7 percent since the start of this year and down 10.5 percent since the start of 2018. Australia’s economy has slowed in the last 3 quarters, with annual growth in the first quarter of 1.8 percent, down from 2.3 percent in the previous quarter, and below RBA’s forecast from May for growth this year of 2.75 percent. RBA said its outlook for economic growth “remains reasonable,” but added consumption was subdued and weighed down by a long period of low income and declining house prices. But higher investment in infrastructure and the resource sector is helping offset some of this drag. Although employment growth has been strong and labor force participation at record levels, Lowe noted the jobless rate has risen in the last two months to 5.2 percent in May, and growth in wages remains low, making little inroads into the economy’s spare capacity. Inflation is also subdued – it fell to 1.3 percent in the first quarter from 1.8 percent in the previous quarter – but RBA said it would be boosted in the second quarter by higher petrol prices and the central scenario remains for underlying inflation to be around 2.0 percent in 2020.
The Reserve Bank of Australia issued the following statement:
“At its meeting today, the Board decided to lower the cash rate by 25 basis points to 1.00 per cent. This follows a similar reduction at the Board’s June meeting. This easing of monetary policy will support employment growth and provide greater confidence that inflation will be consistent with the medium-term target.
The outlook for the global economy remains reasonable. However, the uncertainty generated by the trade and technology disputes is affecting investment and means that the risks to the global economy are tilted to the downside. In most advanced economies, inflation remains subdued, unemployment rates are low and wages growth has picked up. The slowdown in global trade has contributed to slower growth in Asia. In China, the authorities have taken steps to support the economy, while continuing to address risks in the financial system.
Global financial conditions remain accommodative. The persistent downside risks to the global economy combined with subdued inflation have led to expectations of easing of monetary policy by the major central banks. Long-term government bond yields have declined further and are at record lows in a number of countries, including Australia. Bank funding costs in Australia have also declined, with money-market spreads having fully reversed the increases that took place last year. Borrowing rates for both businesses and households are at historically low levels. The Australian dollar is at the low end of its narrow range of recent times.
Over the year to the March quarter, the Australian economy grew at a below-trend 1.8 per cent. Consumption growth has been subdued, weighed down by a protracted period of low income growth and declining housing prices. Increased investment in infrastructure is providing an offset and a pick-up in activity in the resources sector is expected, partly in response to an increase in the prices of Australia’s exports. The central scenario for the Australian economy remains reasonable, with growth around trend expected. The main domestic uncertainty continues to be the outlook for consumption, although a pick-up in growth in household disposable income is expected to support spending.
Employment growth has continued to be strong. Labour force participation is at a record level, the vacancy rate remains high and there are reports of skills shortages in some areas. There has, however, been little inroad into the spare capacity in the labour market recently, with the unemployment rate having risen slightly to 5.2 per cent. The strong employment growth over the past year or so has led to a pick-up in wages growth in the private sector, although overall wages growth remains low. A further gradual lift in wages growth is still expected and this would be a welcome development. Taken together, these labour market outcomes suggest that the Australian economy can sustain lower rates of unemployment and underemployment.
Inflation pressures remain subdued across much of the economy. Inflation is still, however, anticipated to pick up, and will be boosted in the June quarter by increases in petrol prices. The central scenario remains for underlying inflation to be around 2 per cent in 2020 and a little higher after that.
Conditions in most housing markets remain soft, although there are some tentative signs that prices are now stabilising in Sydney and Melbourne. Growth in housing credit has also stabilised recently. Demand for credit by investors continues to be subdued and credit conditions, especially for small and medium-sized businesses, remain tight. Mortgage rates are at record lows and there is strong competition for borrowers of high credit quality.
Today’s decision to lower the cash rate will help make further inroads into the spare capacity in the economy. It will assist with faster progress in reducing unemployment and achieve more assured progress towards the inflation target. The Board will continue to monitor developments in the labour market closely and adjust monetary policy if needed to support sustainable growth in the economy and the achievement of the inflation target over time.”
Australia is having a pretty busy week. The RBA cut rates earlier this morning, and attention now turns to two major data points: trade balance and retail sales.
These releases have a habit of changing the course of the AUDUSD. It might be a bit too early to see the full effect of the first rate cut in the data, but these will be important reference points going forward to plot the course of the currency.
What We Are Looking for Tonight
The first bit of major data to come across our radar will be the trade balance.Consensus expectations are for a balance of AUD5.25B. This would be up from the AUD4.87M of last month, and the highest on record.
The trade balance has been slipping over the last couple of months, as export growth slowed and imports picked up. Consumer demand has picked up lately, leading to the growth in imports of food, beverages and clothing. This was before the RBA cut rates, so many analysts expect a further increase in this item.
Sales Remain Good
Exports continue to expand, showing little sign of a lack of headroom. Growth in this item has been primarily led by iron ore prices, as the rest of the commodities have suffered due to the general lackluster growth in the world economy.
Commodity prices increased by 2.1%, after growing just 0.3% in May. During June, the spot price of iron ore went from $93.97 to reach as high as $112.90 by the end of the month. This is coming up on a doubling of the price since the cycle began in November.
The question now is at what point does the increased cost of iron ore cause a drop in sales? There is no consensus on where the price ceiling is since the largest customer is the notoriously opaque market of China.
The Future
There are two factors to consider to consider in projecting the price of iron ore, and thus the trade balance over the next few months. The first is how fast Brazil can bring its ore production back online. The second is the potential for increased demand if the trade dispute between the US and China is resolved soon.
Another factor that is often forgotten is Chinese investment in commodities as a hedge against inflation. With official figures showing a spike in inflation over the last quarter, it would be expected that Chinese savers will be increasing their investment in iron and copper.
All these factors influence the relative strength of the AUD and might help reverse the strong drop in capital flows that we saw in Q1.
Looking at the Domestic Market
Retail sales for June are projected to have increased by 0.2%. Although this would be positive. it is still barely an improvement from -0.1% in May. While this figure tends to bounce around a bit, we still need to see some substantial improvement if we are going to expect inflation to pick up in the future and stave off further action by the RBA.
Leaders of the United States and China have agreed to resume trade negotiations
At the G20 meeting last weekend, Chinese Chairman Xi Jinping and US president Donald Trump agreed to resume trade negotiations between the countries. Will the Cotton quotations increase?
The American president expressed the hope that China will acquire more agricultural products from the United States. China acquires about a quarter of global cotton imports and is the largest importer. The United States ranks 1st in the world in the export of cotton with a share of about 38%. After the announcement of the successful conclusion of negotiations between the leaders of the United States and China, the cotton quotations soared by 3% and updated a maximum of a month. An additional positive factor could be a reduction in the forecast for cotton crop area in the US in the agricultural season 2019/20 from U.S. Department of Agriculture (USDA). In the June forecast of the US Department of Agriculture, an area of 13.72 million acres is indicated, which is less than its March estimate of 13.78 million acres. The India Meteorological Department reported that June this year turned out to be the driest in the last 5 years and the amount of precipitation decreased by about a third compared with the average level. Drought can reduce cotton production in India.
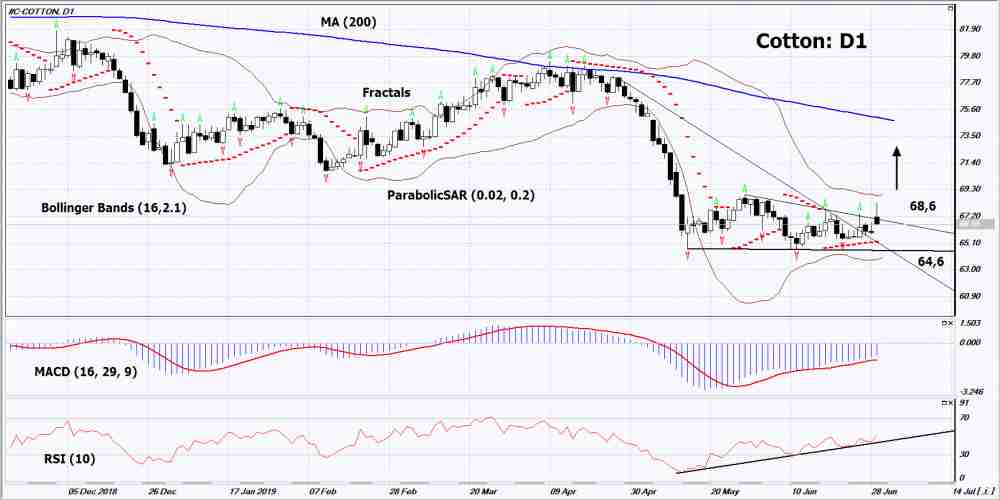
On the daily timeframe Cotton: D1 is trying to exit the downtrend and from the triangle to the top. Various technical analysis indicators have generated an uptrend signals. Further growth of quotations is possible in case of an increase in global demand and deterioration of the weather in India.
The Parabolic indicator shows a signal to increase.
The Bolinger bandsnarrowed, indicating a volatility decrease. Both lines of Bollinger have a slope up.
The RSI indicator is above the 50 mark. It has formed a divergence to the increase.
The billish momentum may develop if the Cotton exceeds its last maximum: 68.6. This level can be used as an entry point. The initial stop lose may be placed below the last three lower fractals, the Parabolic signal and a 3-year low: 64.6. After placing the pending order, the stop loss shall be moved following the signals of Bollinger and Parabolic to the next fractal minimum.Thus, we are changing the potential profit/loss to the breakeven point. More risk-averse traders may switch to the 4-hour chart after the trade and place a stop loss moving it in the direction of the trade. If the price meets the stop level (64,6)) without reaching the order (68,6), we recommend to cancel the order: the market sustains internal changes that were not taken into account.