CVS Declares Quarterly Dividend and Gets a Boost from Relaxed Rebate Policy

By The Life Science Report

Source: Streetwise Reports   07/11/2019

CVS Healthcare announced a $0.50/share quarterly dividend yesterday and got an added boost today as news spreads regarding easing of federal restrictions on pharmacy rebate plans.

CVS Health Corp. (CVS:NYSE) along with many other pharmacy benefits managers (PBMs) and healthcare providers got a huge shot in the arm on news out of Washington today that the Trump administration will ease back on plans to limit drug rebate programs.

CVS also announced yesterday that it will continue its quarterly dividend of $0.50/share payable to shareholders of record as of July 25, 2019, on August 2, 2019. The company’s $2/share annual dividend equates to an annual yield of 3.45% based upon today’s share price of around $58/share.

Reuters reported earlier today that the Trump administration just scrapped one of its most ambitious proposals for lowering prescription medicine prices, backing down from a policy that would have required health insurers to pass on billions of dollars in rebates they receive from pharmaceutical companies to Medicare patients. The Reuters report concluded that firms like CVS and Cigna Corp. (CI:NYSE) that negotiate rebates with pharmaceutical manufacturers on behalf of the government’s Medicare program will continue to benefit from those discounts.

The report also raises questions about whether the administration’s other efforts to lower prices will affect the major pharmaceutical manufacturers more directly.

Shares of many of the large health insurers, PBMs, and retail pharmacies are up sharply today on the news. Cigna, which partners closely with CVS on walk-in clinic and pharmacy programs, is seeing a greater than 10% increase in its share price today.

CVS is a leading pharmacy benefits manager with 94 million plan members and operates more than 9,900 retail locations and 1,100 walk-in medical clinics. The firm also serves an estimated 38 million people through traditional consumer-directed health insurance products including Medicare Advantage offerings.

Cigna is a global health service company offering products and services that include an integrated suite of health services, such as medical, dental, behavioral health, pharmacy, vision, supplemental benefits, and related products including group life, accident and disability insurance to 165 million customers in 30 countries.

CVS shares are trading up today greater than 5% above the prior day’s close of $55.38 on significantly higher than average volume. Shares have traded between $58.08-60.13/share. Cigna shares are also trading much higher between $177.38-185.77 over Wednesday closing price of $160.51.

Sign up for our FREE newsletter at: www.streetwisereports.com/get-news

Disclosure:
1) Stephen Hytha compiled this article for Streetwise Reports LLC and provides services to Streetwise Reports as an independent contractor. He or members of his household own securities of the following companies mentioned in the article: None. He or members of his household are paid by the following companies mentioned in this article: None.
2) The following companies mentioned in this article are billboard sponsors of Streetwise Reports: None. Click here for important disclosures about sponsor fees.
3) Comments and opinions expressed are those of the specific experts and not of Streetwise Reports or its officers. The information provided above is for informational purposes only and is not a recommendation to buy or sell any security.
4) The article does not constitute investment advice. Each reader is encouraged to consult with his or her individual financial professional and any action a reader takes as a result of information presented here is his or her own responsibility. By opening this page, each reader accepts and agrees to Streetwise Reports’ terms of use and full legal disclaimer. This article is not a solicitation for investment. Streetwise Reports does not render general or specific investment advice and the information on Streetwise Reports should not be considered a recommendation to buy or sell any security. Streetwise Reports does not endorse or recommend the business, products, services or securities of any company mentioned on Streetwise Reports.
5) From time to time, Streetwise Reports LLC and its directors, officers, employees or members of their families, as well as persons interviewed for articles and interviews on the site, may have a long or short position in securities mentioned. Directors, officers, employees or members of their immediate families are prohibited from making purchases and/or sales of those securities in the open market or otherwise from the time of the interview or the decision to write an article until three business days after the publication of the interview or article. The foregoing prohibition does not apply to articles that in substance only restate previously published company releases.

( Companies Mentioned: CI:NYSE ,
CVS:NYSE,
)

Could Gold Launch Into A Parabolic Upside Rally?

By TheTechnicalTraders.com

We believe Gold is setting up for an incredible upside breakout move after reaching our predicted target near $1450. For those of you that have been following our research and Gold calls, we’ve nailed this move and our October 2018 predictive modeling call has continued to mirror (almost exactly) the price movement in Gold over the past  10+ months.  See the chart below.

Our Adaptive Dynamic Learning (ADL) predictive modeling system suggested that Gold would rally from the $1200 level to above $1300, then stall.  It suggested that in April or May of 2019, Gold would settle back below $1300 and set up a “momentum base” before attempting an upside breakout move after forming the base.  Our research team identified April 21~24 as the likely “price low” for the “momentum base” using our advanced price cycle and other research tools.

You can see from the chart, above, that our upside price targets from our original research are above $1550~1600.  What if we told you we now believe the upside price targets could actually be above $1700 and more like $1750 to $1800 on a parabolic upside price rally initiating after price breaks critical resistance levels?

Take a look at this simple Gold/Silver/USDollar index chart.  The purpose of this chart is to relate the price of Gold to the price of Silver in US Dollar price levels.  It highlights that Silver is still very undervalued in comparison to Gold and that any attempt to restore a price balance between Silver and Gold would likely result in either two outcomes : A. the price of Gold falls, or B. the price of Silver rallies faster than Gold rallies whereas this ratio will attempt to balance out (as we see back in 2013/2014).

Our Price Amplitude Arcs are a means of measuring price cycles, price waves and allow us to seek out critical price inflection points.  As you can see, where multiple arcs align and are breached by price, we typically see some type of increased price volatility and trending.  Currently, two separate arcs are setting up to be breached and we believe this is important because of how it aligns with our October 2018 research post.

What would cause Gold to rally above $1600 at this time?  Why would this become a period where renewed interest in precious metals could drive such a big move?  We believe a number of global economic factors will become more evident over the next 30 to 60+ days and that these critical Price Amplitude Arcs are suggesting price is set up to rally from these levels.  We believe the move higher will include both Gold and Silver and that Silver may rally stronger than Gold which would cause this Gold/Silver ratio chart price level to move higher – towards our objective line (MAGENTA).

We believe a key date for all traders/investors to be aware of is August 19, 2019 (+/- 5 days).  We believe this will be the date range that the market will break out of existing ranges and when fear and greed will likely solidify in the precious metals markets.  We have about 35 days to go before this date and we believe Gold will continue to trade below the “Breakout Resistance” until renewed fear and greed become more evident in the global markets.

Our Current Market Top Analysis and Charts – Click Here

This means the US Dollar will likely continue to rally, or at least stay above $96, for the next 25+ days and that upside US Dollar price activity will partially mute the upside price potential in precious metals.  Overall, the upside price momentum in metals will push metals prices higher while the US Dollar continues to strengthen moderately.  Once the US Dollar breaks lower, metals will skyrocket higher (breaking past the Breakout Resistance level) and begin the upside parabolic move.

Any opportunity you find where Gold is trading below $1400 is an excellent opportunity to prepare for this move.  Silver continues to trade below $15.50 and continues to be an incredible opportunity for traders who understand the ratio levels of precious metals.  Don’t miss this move.  It is just a matter of time (30+ days) now.

Be prepared for these incredible price swings before they happen and learn how you can identify and trade these fantastic trading opportunities in 2019, 2020, and beyond with our  Wealth Building & Global Financial Reset Newsletter.  You won’t want to miss this big move, folks.  As you can see from our research, everything has been setting up for this move for many months – most traders/investors have simply not been looking for it.

Join me with a 1 or 2-year subscription to lock in the lowest rate possible and ride my coattails as I navigate these financial market and build wealth while others lose nearly everything they own during the next financial crisis. Join Now and Get a 1oz Silver Round or Gold Bar Shipped To You Free.

I can tell you that huge moves are about to start unfolding not only in currencies, metals, or stocks but globally and some of these supercycles are going to last years. A gentleman by the name of Brad Matheny goes into great detail with his simple to understand charts and guide about this. His financial market research is one of a kind and a real eye-opener. 2020 Cycles – The Greatest Opportunity Of Your Lifetime

As a technical analysis and trader since 1997, I have been through a few bull/bear market cycles. I believe I have a good pulse on the market and timing key turning points for both short-term swing trading and long-term investment capital. The opportunities are massive/life-changing if handled properly.

BILLION GIVEAWAY – REAL GOLD OR SILVER WITH MEMBERSHIPS

So kill two birds with one stone and subscribe for two years to get your
FREE GOLD BAR and enough trades to profit through the next metals
bull market and financial crisis!

SUBSCRIBE -> FREE GOLD BAR -> GET WINNING TRADES

Chris Vermeulen – TheTechnicalTraders.com


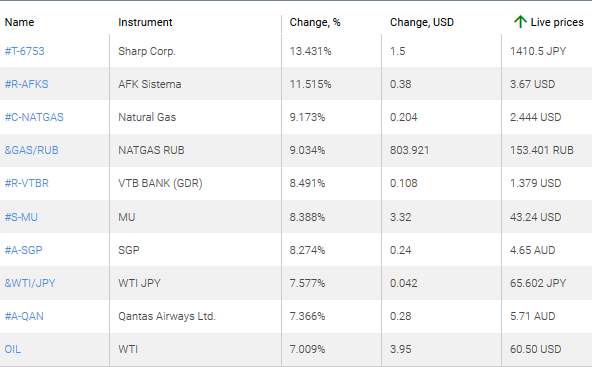
Sharp Corp., AFK Sistema, LI & FUNG lead the Weekly Top Gainers/Losers

By IFCMarkets

1. Sharp Corporation – Japanese electronics manufacturer.

2. SISTEMA JSFC GDR – Russian diversified holding.

market sentiment ratio long short positions

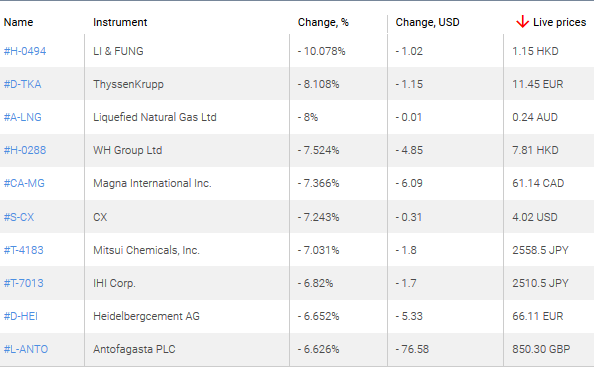
 Top Losers – The World Market

1. LI & FUNG – Hong Kong logistics and trading company.

2. ThyssenKrupp AG – German steel company.

market sentiment ratio long short positions

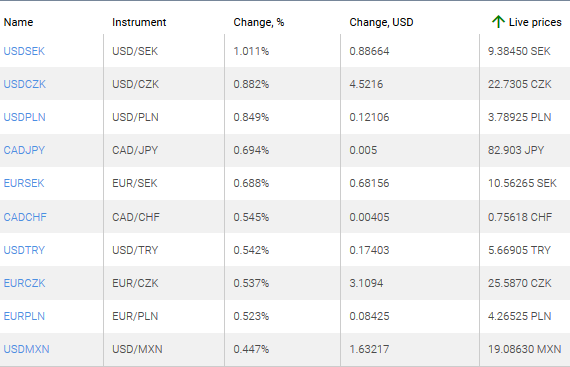
 Top Gainers – Foreign Exchange Market (Forex)

1. USDSEK, EURSEK – an increase in this chart indicates the strengthening of the US dollar and the euro against the Swedish krona.

2. USDCZK, USDPLN -an increase in this chart shows the strengthening of the US dollar against the Czech crown and the Polish zloty.

market sentiment ratio long short positions

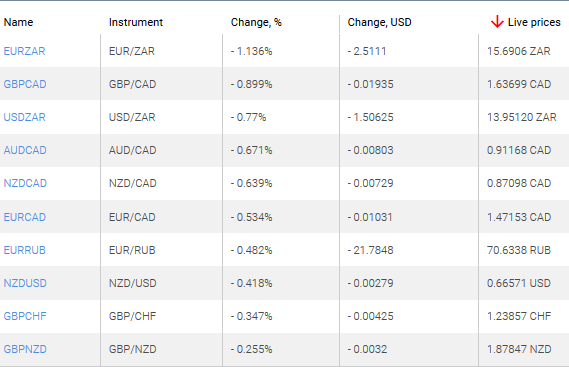
 Top Losers – Foreign Exchange Market (Forex)

1. EURZAR, USDZAR – the decrease in this charts shows strengthening the South African rand against the euro and the us dollar.

2. GBPCAD, AUDCAD – the decrease in this charts means strengthening the Canadian dollar against the British pound and the Australian dollar.

market sentiment ratio long short positions

Market Analysis provided by IFCMarkets

Note:
This overview has an informative and tutorial character and is published for free. All the data, included in the overview, are received from public sources, recognized as more or less reliable. Moreover, there is no guarantee that the indicated information is full and precise. Overviews are not updated. The whole information in each overview, including opinion, indicators, charts and anything else, is provided only for familiarization purposes and is not financial advice or а recommendation. The whole text and its any part, as well as the charts cannot be considered as an offer to make a deal with any asset. IFC Markets and its employees under any circumstances are not liable for any action taken by someone else during or after reading the overview.

WHEAT Analysis: Lower world wheat ending stock estimate bullish for wheat

By IFCMarkets

Lower world wheat ending stock estimate bullish for wheat

Wheat ending stock estimate was lowered in WASDE July report. Will the wheat prices continue rebounding?

Wheat prices are under pressure as harvest gets closer for spring wheat. The US Department of Agriculture revised downward world wheat ending stocks for 2019/20 from previous estimate of 292.43 million metric tons (MMT) to 286.46 MMT in this month’s World Agricultural Supply and Demand Estimates (WASDE) report. Lower wheat ending stock estimate is bullish for wheat. However, USDA upgraded its US all-wheat production estimates from 1.903 billion bushels in June to 1.921 billion bushels due to an increase in winter wheat attributed to better yields. Higher US wheat production is a downside risk for wheat.

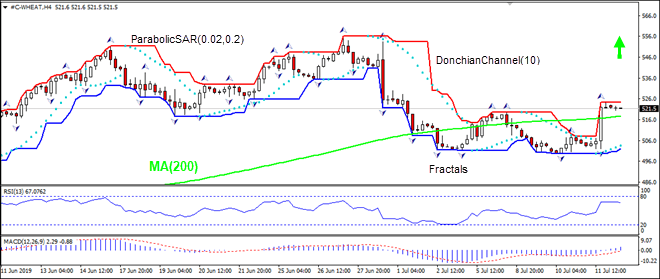
WHEAT is rising above MA(200) 07/12/2019 Technical Analysis IFC Markets chart

On the 4-hour timeframe the WEHAT: H4 has risen above the 200-period moving average MA(200), this is bullish.

  • The Parabolic indicator gives a buy signal.
  • The Donchian channel indicates uptrend: it is narrowing up.
  • The MACD indicator gives a bullish signal: it is above the signal line and the gap is widening.
  • The RSI oscillator has levelled off and has not reached the oversbought zone yet.

We believe the bullish momentum will continue after the price breaches above the upper boundary of Donchian channel at 524.3. This level can be used as an entry point for placing a pending order to buy. The stop loss can be placed below the last fractal low at 502.0. After placing the order, the stop loss is to be moved every day to the next fractal low, following Parabolic signals. Thus, we are changing the expected profit/loss ratio to the breakeven point. If the price meets the stop loss level (502.0) without reaching the order (524.3), we recommend cancelling the order: the market has undergone internal changes which were not taken into account.

Technical Analysis Summary

OrderBuy
Buy stopAbove 524.3
Stop lossBelow 502.0

Market Analysis provided by IFCMarkets

Why Trade Oil & Gold Together

By Orbex

Depending on who you ask, gold and oil are the two most traded commodities in the markets. The debate isn’t over how important they are, but rather about whether gold is a currency or a commodity.

Either way, both are very popular trading vehicles. And both have unique characteristics that make them not only profitable on their own, but in combination.

Not for nothing, oil is sometimes colloquially known as “black gold”. And interestingly, that’s not all that bad of a metaphor to describe the unique relationship between these two special assets.

The Basics

Gold’s primary trait is its use as a store of value. It’s been used this way for thousands of years. There are several properties that make it such a good store of value, like the fact that it doesn’t require a lot of space and it doesn’t corrode over time.

Petroleum, on the other hand, needs to be used up. Depending on the type of petroleum, it degrades over time and costs quite a lot to store. For this reason, most produced petroleum is consumed quickly as it has a poor store of value, contrary to gold.

The Market Relationship

The basic traits inform the attitudes of traders, even when doing sophisticated operations. Even when making a speculative trade in gold, for example, a trader should take into account its properties as a safe haven. In times of economic uncertainty, generally, investors are going to look for safe investments like gold.

Demand for crude tends to increase in line with growing economies, as it’s a vital source of the energy needed to produce and transport goods. Using petroleum as a store of value is a common practice, but any strategy involving oil should take into account it’s basic traits.

The Inverse Correlation

Gold can be used for speculation but is preferred as a safe haven.

Crude, on the other hand, can be used as a store of value but is preferred as a speculative play.

This combination makes these two assets work great together as mutual hedges. Gold helps offset the risk of higher uncertainty, while oil can take advantage of market moves.

Broadly speaking, you could say that gold and petroleum are inversely correlated. There are a couple of major caveats to add to that notion. The first is that more nuance allows for more sophisticated trading.

The second is that there is more to oil prices than just the market.

Optimizing Hedging

After getting to know both assets better, you can take advantage of these hedging opportunities to get more out of your trading. Gold and oil don’t trade exactly in opposition to each other. And that separation allows you to gain extra profitability as well.

One of the factors is that gold prices tend to lead moves in market sentiment, while oil price tends to follow economic growth. This is because, for example, investors will sell their gold in anticipation of the markets performing better. But, when the economy grows, demand for oil increases, meaning the price hike comes after the economy is already growing.

Risk On and Off

In a shorter time frame, generally, oil prices will suffer when markets are looking to shy away from risk, and support gold. When markets are looking to take on risk, we have the opposite effect. Therefore, gold and oil make quite good trading complements.

By Orbex


Trump is wrong on Bitcoin and is placing himself on the wrong side of history

By George Prior

U.S. President Trump is wrong and is placing himself on the wrong side of history on Bitcoin – but cryptocurrencies should be regulated, says the boss of one of the world’s largest independent financial advisory organizations.

Nigel Green, the founder and CEO of deVere Group, is speaking out after Donald Trump took to Twitter to say: “I am not a fan of Bitcoin and other cryptocurrencies, which are not money, and whose value is highly volatile and based on thin air.

“If Facebook and other companies want to become a bank, they must seek a new Banking Charter and become subject to all Banking Regulations, just like other Banks, both National and International,” he added.

The President’s tweets follow last month’s announcement by Facebook that it is to launch its own new digital currency to be called Libra. It is designed to be a low-volatility currency that will let its users buy things or send money to people with very low fees.

It will be backed by reserves managed by an independent organisation, called the Libra Association, made up of several leading tech firms and non-profits that give the token real-world value.

Nigel Green affirms: “President Trump is wrong and is placing himself on the wrong side of history on Bitcoin and other cryptocurrencies.

“The blistering pace of the digitalisation of economies and our lives underscores that there will be a growing demand for digital, global, borderless money.

“Indeed, it is now almost universally regarded as the future of money.

“This is why most major financial institutions globally already have or are preparing to establish crypto desks. It is why more and more retail and institutional investors are piling into the market. And it is why tech giants, like Facebook, are getting involved. And you can bet that where Facebook follows, other tech companies will do the same.

“When everything from voting to music to books is already digital, dismissing digital currencies in a digital era is, frankly, bizarre and looks depressingly archaic.

“Does the President seriously think that traditional, fiat currencies are the way forward?”

Mr Green continues: “However, I agree with Mr Trump that Facebook’s new Libra project should be scrutinised.

“But, being the social media monolith that it is, it is surely expecting this level of scrutiny.  I would suggest that it is prepared for it, has the resources for it, and will welcome it, as it will make its cryptocurrency stronger.”

He goes on to add: “The wider point here is regulation. Cryptocurrencies are already becoming mainstream. As such they should adhere to the same standards as the rest of the financial system.

“Regulation is necessary as it will provide further protection for the growing number of people using cryptocurrencies, the less likely it will be that criminals will use these digital payment methods, the less potential risk there will be for the disruption of global financial stability, and the more potential opportunities there will be for higher economic growth and activity in those countries which introduce it.

“And it is surely on its way, judging by the activities of regulators around the world.”

The deVere Group CEO concludes: “Standing on the sidelines, or worse looking backwards, on the issue of cryptocurrencies – which are redefining and reshaping the financial system – is a baffling approach for the leader of the world’s largest economy to take.”

About:

deVere Group is one of the world’s largest independent advisors of specialist global financial solutions to international, local mass affluent, and high-net-worth clients.  It has a network of more than 70 offices across the world, over 80,000 clients and $12bn under advisement.

USD Down Again Despite Stronger CPI

By Orbex

USD Retreats Despite Positive CPI Surprise

The US dollar continues trades lower once again today as the sell-off from the FOMC minutes on Wednesday resumes. The details in the minutes have bolstered expectations of a Fed rate cut at the upcoming meeting in July. Yesterday, USD reversed losses in response to the June CPI which came in higher than expected at 2.1% on the core reading. USD index trades 96.57 last, still well below the 97.10 resistance level.

Euro Still Under Pressure

EURUSD has seen higher levels against USD again today, benefiting from the current weakness in the greenback. A lack of tier one domestic data has seen quiet trading for the single currency this week which has mainly been driven by USD flows. EURUSD trades 1.1264 last, capped against resistance at the level formed by prior swing highs in May.

GBP Rally Remains Intact

GBPUSD is continuing its recovery battle against USD today as bulls fight to keep price above the 1.2439 level support. Positive data earlier in the week has kept sentiment skewed to the upside, despite the ongoing Brexit uncertainty which poses risks to the outlook. For now, focus remains on further downside, with the recover likely to prove shallow.

SPX500 Hits Fresh All-time Highs (Again!)

Risk assets have enjoyed further upside this week as the dovish FOMC meeting minutes have once again lit a fire under equities. The prospect of a Fed rate cut has seen the SPX500 breaking out to all-time highs yet again this week with the index trading 3007.58 last. Along with renewed optimism over US-China trade negotiations, the outlook is firmly positive for equities.

Safe Havens Down As Equities Soar

Safe havens have had a difficult day today given the strong risk-on tone. Despite USD weakness, JPY has fallen against the dollar as higher equities prices have capped safe-haven inflows. Gold has fallen back too, retracing almost all of its initial gains against USD so far today. XAUUSD trades 1405.96 last, down from earlier highs of 1412.43. USDJPY trades 108.45 last, as the recovery off the 107.90 level continues.

Crude Continues Higher

Oil prices remain supported today as the market continues to grind higher in the wake of yet another bullish report from the EIA which showed that US crude stores were down for a fourth consecutive week last week. Ongoing tensions in the Middle East between the UK/US and Iran are also keeping oil well bid as traders anticipate supply disruptions. Crude trades 60.73 last, with price remaining above the recently broken 60.07 level.

CAD Rises, AUD Drops

USDCAD has moved sharply lower today, breaking below the 1.3037 level earlier to trade its lowest level since October last year. A combination of a weaker USD, optimistic BOC, and higher oil prices, is keeping CAD well supported, a theme which is likely to continue in the near term.

AUDUSD has turned a little lower this morning as the .70 level once again finds sellers stepping in. This has a been a major pivot for AUDUSD over the year and despite several attempts recently, price has yet to hold above the level longer than a few days. With USD trading lower and risk sentiment improving, we could see a topside break over the coming sessions, though the fundamental backdrop for AUD is not currently supportive.

By Orbex


Forex Technical Analysis & Forecast 12.07.2019 (EURUSD, GBPUSD, USDCHF, USDJPY, AUDUSD, USDRUB, GOLD, BRENT)

Article By RoboForex.com

EURUSD, “Euro vs US Dollar”

After reaching the short-term upside target, EURUSD has completed the correction at 1.1248; right now, it is forming the fifth wave towards 1.1300. Possibly, the pair may reach this level and then return to 1.1248. After that, the instrument may break it and then continue trading inside the downtrend with the target at 1.1180.

EURUSD_Технический анализ
Risk Warning: the result of previous trading operations do not guarantee the same results in the future

GBPUSD, “Great Britain Pound vs US Dollar”

After reaching the short-term upside target, GBPUSD has finished the correction at 1.2507; right now, it is forming the fifth ascending wave towards 1.2575. Later, the market may form a new descending structure to break 1.2500 and then continue trading inside the downtrend with the target at 1.2400.

GBPUSD_Технический анализ
Risk Warning: the result of previous trading operations do not guarantee the same results in the future

USDCHF, “US Dollar vs Swiss Franc”

After reaching the downside target, USDCHF has completed the correction at 0.9898. Possibly, today the pair may consolidate. If later the price breaks this range to the upside, the instrument may continue trading upwards with the first target at 0.9999.

USDCHF_Технический анализ
Risk Warning: the result of previous trading operations do not guarantee the same results in the future

USDJPY, “US Dollar vs Japanese Yen”

USDJPY has finished the correction at 108.50; right now, it is consolidating. According to the main scenario, the price is expected to fall and break 108.00. After that, the instrument may continue trading downwards with the target at 107.20.

USDJPY_Технический анализ
Risk Warning: the result of previous trading operations do not guarantee the same results in the future

AUDUSD, “Australian Dollar vs US Dollar”

AUDUSD is moving upwards. Possibly, the pair may reach 0.6997 and then form a new descending structure to break 0.6940. Later, the market may form another consolidation range. If the price breaks this range to the upside, the instrument may form one more ascending structure towards 0.7000; if to the downside – continue trading inside the downtrend with the target at 0.6830.

AUDUSD_Технический анализ
Risk Warning: the result of previous trading operations do not guarantee the same results in the future

USDRUB, “US Dollar vs Russian Ruble”

USDRUB is consolidating around 63.09. If later the price breaks this range to the downside, the instrument may start another decline to reach 62.22; if to the upside – form one more ascending structure with the target at 64.22.

USDRUB
Risk Warning: the result of previous trading operations do not guarantee the same results in the future

XAUUSD, “Gold vs US Dollar”

Gold is consolidating around 1407.95. Possibly, today the pair may grow towards 1431.00 and then start another decline to return to 1407.95. After that, the instrument may break this level and then continue trading downwards with the target at 1382.00.

GOLD_Технический анализ
Risk Warning: the result of previous trading operations do not guarantee the same results in the future

BRENT

Brent is consolidating at the top of the structure. Today, the pair may fall to break 66.66 and then reach the target at 63.75. This movement may be considered as a descending correction. Later, the market may continue trading inside the uptrend with the short-term target at 70.00.

BRENT_Технический анализ
Risk Warning: the result of previous trading operations do not guarantee the same results in the future

Article By RoboForex.com

Attention!
Forecasts presented in this section only reflect the author’s private opinion and should not be considered as guidance for trading. RoboForex LP bears no responsibility for trading results based on trading recommendations described in these analytical reviews.

Gold Posts Longest Winning Streak Since 2006

By Orbex

Gold

It’s been another frustrating week for gold bulls. Price battled to move higher, but once again stayed capped by recent highs to end the week back inside last week’s range.

While momentum has contracted somewhat, gold has posted its eighth consecutive winning week, a streak not seen since 2006.

Gold Boosted By Fed Easing Expectations

The main driver for upside in gold this week was the release of the June FOMC meeting minutes.

In the June meeting, the Fed outlined the likely need for monetary easing in the near future. Since then, the market has increased bets on a July rate cut. Consequently, the minutes took on extra importance as traders sought further clarity on the likelihood of a rate cut this month.

FOMC Minutes Support Rate Cut

The minutes did, indeed, confirm the Fed’s bias towards easing. The minutes stated:

“Many judged additional monetary policy accommodation would be warranted in the near term should these recent developments prove to be sustained and continue to weigh on the economic outlook.”

Indeed, “Several” policymakers noted their preference for a rate cut in the coming months. They judged that it “could help cushion the effects of possible future adverse shocks to the economy.”

However, the minutes didn’t show unanimous support for a rate cut. 

“Some participants suggested that although they now judged that the appropriate path of the federal funds rate would follow a flatter trajectory than they had previously assumed, there was not yet a strong case for a rate cut.”

Market Looking For July Fed Rate Cut

While the latter phrase adds some doubt, the market is still fully behind a July rate cut. ]

The CME group’s Fed Watch tool is showing a near 80% chance of a .25% rate cut. This should keep gold further supported.

Technical Perspective

gold

The current price action in gold reflects the indecision in the market and the contraction in volatility and momentum. Price continues to oscillate between the 1435.26 resistance level and the 1392.57 support level. Any break of the downside level will bring deeper support, around 136.94, into play. While above this level, focus remains on further upside in the near term. A break of the topside resistance will put focus on a run-up to 1478.83 next.

xauusd

Panning out to the weekly chart for a moment, it is worth noting that we have a large tweezer top in play with two large bearish pin bar candles. This highlights the risk of potential downside in the coming weeks and months.

Silver

Silver prices have been higher this week too, taking advantage of a weakened USD amidst increased easing expectations. While metals have been receiving upside support from dovish Fed expectations, optimism around a potential US/China trade deal is keeping upside capped.

While we have yet to receive any further details in the wake of the Trump/Xi meeting, the market is remaining hopeful, reflected in higher equities prices, which are also constraining the current moves in metals.

Technical Perspective

xagusd

The recent bounce off the 14.9161 level support in Silver has stalled around the 15.1740 level, roughly midway to the next key resistance level around the 15.6351 region where we also have the long term bearish trend line. This will be a key test for silver and a break above that level could pave the way for a much longer term reversal in the market.

By Orbex


Fibonacci Retracements Analysis 12.07.2019 (BITCOIN, ETHEREUM)

Article By RoboForex.com

BTCUSD, “Bitcoin vs US Dollar”

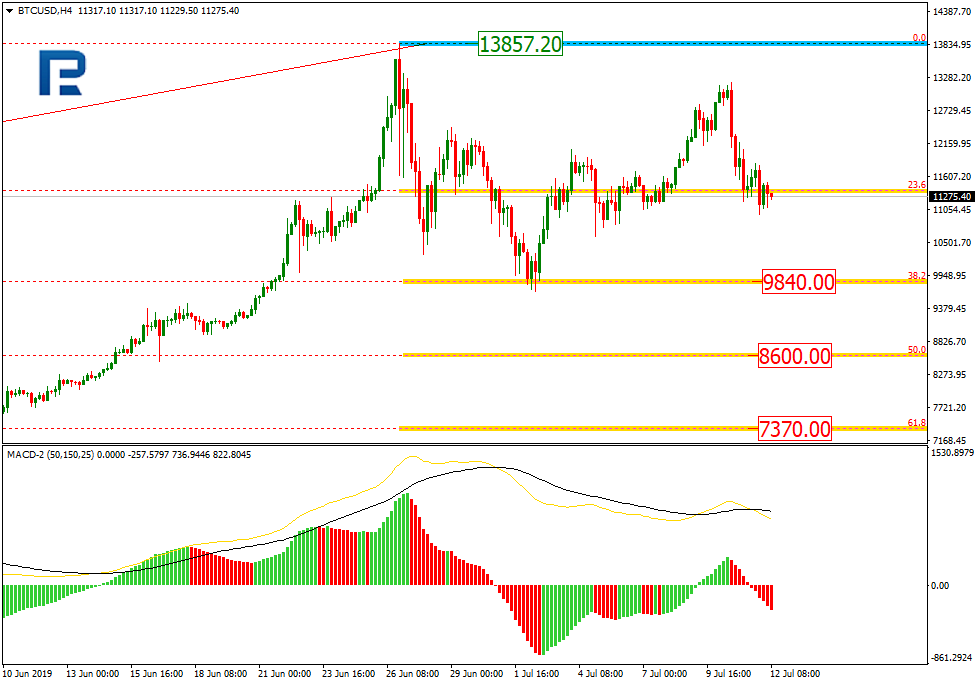
As we can see in the H4 chart, after attempting to reach the high at 13857.20, BTCUSD is forming a new descending wave, which may test 38.2% fibo at 9840.00 again, thus continuing the correction. The next downside targets may be 50.0% and 61.8% fibo at 860.00 and 7370.00 respectively.

Bitcoin
Risk Warning: the result of previous trading operations do not guarantee the same results in the future

The H1 chart shows more detailed structure of the current descending wave after the divergence. By now, it has already reached 61.8% and, after a slight pullback, may continue moving towards 76.0% fibo at 10520.00. The key downside target is the low at 9666.00.

BTCUSD
Risk Warning: the result of previous trading operations do not guarantee the same results in the future

As we can see in the daily chart, ETHUSD is still being corrected to the downside and has already reached 38.2% fibo. The next downside targets may be 50.0% and 61.8% fibo at 231.50 and 200.80. The resistance is the high at 363.18

Эфириум (Ethereum) на дневном таймфрейме демонстрирует достижение очередным импульсом спада уровня 38,2%, продолжая развивать коррекционную фазу. Далее котировки могут снизиться к уровням 50,0% (231,50) и 61,8% (200,80) по Фибоначчи. Сопротивлением служит максимум – 363,18.

Ethereum
Risk Warning: the result of previous trading operations do not guarantee the same results in the future

The H1 chart shows more detailed structure of the current descending channel. Right now, the pair continues testing 38.2% fibo.

ETHUSD

Article By RoboForex.com

Attention!
Forecasts presented in this section only reflect the author’s private opinion and should not be considered as guidance for trading. RoboForex LP bears no responsibility for trading results based on trading recommendations described in these analytical reviews.