EURGBP Extends Record Winning Streak

By Orbex

Pound Pummelled By Latest Debate

GBP has been knocked lower in response to comments made during last night’s debate between the two Conservative party leadership candidates; Boris Johnson and Jeremy Hunt. Commenting on the issue of the Irish backstop, the aspect of the UK’s withdrawal deal with the EU which has drawn so much fierce opposition, both candidates essentially scrapped the idea of the backstop.

While the initial proposition for the backstop had been fiercely rejected by parliament on three separate occasions, there had been speculation that amendments to the clause, such as time limits or unilateral exit terms, could provide a solution.

Johnson & Hunt Dismiss Backstop

However, when asked whether he thought that such amendments would work to make the backstop acceptable to parliament, Johnson said:

“I’m not attracted to time limits or unilateral escape hatches or all these elaborate devices, glosses, codicils and so on that you could apply to the backstop.”

Indeed, Hunt also said that in his view,

“the backstop, as it is, is dead … I don’t think tweaking it with a time limit will do the trick, we’ve got to find a new way.”

“No Deal” Brexit Chances Increasing

These comments from the two candidates, one of whom will go on to become the next Prime Minister, have been taken as increasing the chances of the UK leaving the EU without a deal. Both politicians have said that they would leave the EU without a deal as a last resort. Although, while Johnson has promised to do so by the current Halloween deadline, Hunt has said that it would likely take more time.

Brexit Outlook Plaguing the BOE

These latest comments and the warning they give for the Brexit outlook will be frustrating for the Bank of England. The BOE has continued to highlight its desire to pursue further monetary policy tightening. However, due to the uncertainty of Brexit, have had to sit on its hands for now. Indeed, recently the BOE has been stressing the point that in the event of a no-deal Brexit, it could just as likely be forced to cut rates to stop the country from entering a recession.

Recent Data Showing Strength

Recent economic data has continued to surprise to the upside, however. Furthermore, the latest earnings and employment data for the UK, released today, showed that the unemployment rate remained unchanged at 3.8% in the three months to May, it’s lowest level since the 1970s.

Furthermore, wages jumped over the same period with total wages (including bonuses) rising to 3.4% from 3.2% prior and well above the expected 3.1%. Wages excluding bonuses rose even higher jumping to 3.6% from 3.4% prior and again, higher than the 3.5% forecasted. This increase marks the fastest growth in wages since 2008.

Technical Perspective

EURGBP

EURGBP is currently printing a record 11th consecutive winning week against GBP, highlighting the negative toll that Brexit uncertainty is having on GBP. EURGBP is currently testing the upper limit of the bearish channel from 2017 highs. Above here, the key level to watch is .9097, which has been key resistance over the last two years. A break of this level would then bring the 2017 highs into focus. To the downside, any retracement lower should find support back towards .8840s.

By Orbex
 

GBP Falls Despite Strong Wages

By Orbex

USD Rises Again

The US dollar has been moving higher again over the European morning on Tuesday, extending gains seen overnight. The current strengthening comes despite increased expectations that the Fed will cut rates by .25% when it meets later this month, in line with dovish signaling seen in last week’s FOMC meeting minutes. The index trades 96.74 last as price turns back up toward the 97.10 level. Later today we have US retail sales which could prove market moving along with Fed Chairman Powell speaking later in the US session.

Euro Heads Lower

EURUSD has turned sharply lower this morning given the current spate of USD buying. Data has also added to EUR downside pressure today with both German and Eurozone ZEW surveys coming in lower than expected. Expectations that the ECB will also ease in the coming months are keeping EUR pressured with EURUSD trading 1.1238 last, turning back down towards the 1.1217 level.

Pound Down Despite Strong Data

GBPUSD has come under heavy selling pressure today also despite a positive set of earnings and employment data released today. The unemployment rate was seen holding at 40-year lows of 3.8% in the 3 months to May while wage growth rose at its fastest pace since 2008 to hit 3.6% on the ex-bonus figure. However, traders are instead focusing on comments during last night’s conservative leadership party debate which saw both candidates dismissing the Northern Irish Backstop clause of the UK’s exit deal, essentially increasing the likelihood of the UK leaving without a deal. GBPUSD trades 1.2453 last, sitting just above 1.2437.

SPX500 Backs Off Highs

Risk assets have had a subdued start to the day given the resurgence in USD strength. The SPX500 is just down off recent highs, trading 3012.53 last, though remains above the recent 3000.39 level for now. The potential US rate cut due later this month is keeping equities supported at current levels with further upside likely in the near term.

Gold & JPY Both Higher

Safe havens have had a better morning so far, despite the current USD strength, with both gold and JPY rising against USD. XAUUSD trades 1415.72 last, with price remaining around the middle of the recent 1391.61–1433.45 range. USDJPY has fallen back down to test the 107.90 level support which is holding, for now, though looks vulnerable to a break lower.

Oil Traders Waiting on API Report

Oil prices have traded in the green over the session so far today, despite USD strength. While initial gains have been partially retracted, buyers remain active. Looking ahead, traders will be waiting for the weekly API crude inventories report later, ahead of tomorrow’s main EIA report, to see whether crude stores have fallen for a fifth straight week. Crude trades 59.80 last, still just below the 60.32 level.

Commodity Currencies Under Pressure

USDCAD has seen some strengthening today with the pair fighting to get back above the 1.3037 level which was broken last week. A stronger US dollar, as well as some retracement in crude, is keeping CAD down for now though any miss on US data later in the session could fuel a reversal.

AUDUSD has softened today also with price sitting at .7030 last, having retraced from just under the .7048 level. Above here and focus will be on a test of the bearish trend line from 2019 highs which have yet to be broken.

By Orbex


Facebook’s Congress hearings show U.S. lawmakers know cryptocurrencies are the future

By George Prior

The U.S. governmental hearings on Facebook’s new cryptocurrency will boost the crypto sector and underscores that digital currencies are now mainstream.

This is the bullish assessment of the CEO and founder of one of the world’s largest independent financial advisory organizations, deVere Group.

Nigel Green’s comments come as the social media giant prepares to defend its cryptocurrency project, Libra, on the Hill.

The Senate hearing will take place today (Tuesday), with the House panel holding its hearing on Wednesday.

Mr Green affirms: “The high-profile scrutiny of this new cryptocurrency must be championed as cryptocurrencies are already part of the global financial system.

“They are here to stay. And their influence is set to grow exponentially.  As such, they should face the same scrutiny and meet the same standards and requirements as the rest of the financial system.

“This is a step in the right direction for establishing a robust global regulatory framework for the wider crypto market.”

Regulation is necessary, believes the deVere Group CEO, as it will provide further protection for the growing number of people using cryptocurrencies, the less likely it will be that criminals will use these digital payment methods, the less potential risk there will be for the disruption of global financial stability, and the more potential opportunities there will be for higher economic growth and activity in those countries which introduce it.

He continues: “Whatever you think about Facebook’s Libra as an individual cryptocurrency, these top-level U.S. governmental hearings underscore again that, as a concept, digital, global, borderless currencies are now a part of mainstream finance, and increasingly so.

“This is why most major financial institutions, tech giants, and of course institutional and retail investors are increasingly involving themselves in the burgeoning sector.”

The deVere CEO goes on to add: “Last week President Trump raised the issue of Bitcoin, with the effect of making cryptocurrencies become a presidential issue.  The hearings this week will make them a global policy issue.

“This all adds to greater awareness and acknowledgement of digital currencies that will further boost mass adoption and push up prices across the sector.”

Following the President’s Bitcoin comments last week, Mr Green commented:  “I agree with Mr Trump that Facebook’s new Libra project should be scrutinized.

“But, being the social media monolith that it is, it is surely expecting this level of scrutiny.  I would suggest that it is prepared for it, has the resources for it, and will welcome it, as it will make its cryptocurrency stronger.”

Nigel Green concludes: “Facebook’s Libra will likely get through these hearings on Capitol Hill in a stronger position. The scrutiny, which could advance the cause of regulation, will be welcomed by crypto investors as it provides more confidence.

“But whatever happens with the social media giant’s crypto project, it is clear from the top-level hearings that the U.S. government now understands that, whether they like it or not, people and institutions across the world are increasingly using a combination of sovereign and non-sovereign digital currencies.”

About:

deVere Group is one of the world’s largest independent advisors of specialist global financial solutions to international, local mass affluent, and high-net-worth clients.  It has a network of more than 70 offices across the world, over 80,000 clients and $12bn under advisement.


XPDUSD Palladium Analysis: Car sales are declining worldwide

By IFCMarkets

Car sales are declining worldwide

Palladium quotations again approached the historical maximum. Meanwhile, the car sales worldwide is decreasing. Is XPDUSD correction possible?

Approximately 80% of global palladium consumption is accounted for by the automotive industry and the production of catalysts to reduce harmful gasoline engine emissions. Another 5% is consumed by the global chemical industry. As environmental standards tightened, the demand for autocatalysts increased and the price of palladium soared 3 times in the last 3 years. Now it has reached the psychological level of $ 1600 / ounce for the 2nd time. Meanwhile, according to the estimates of the Association of European Businesses, the Association of European Automobile Manufacturers and a number of consulting agencies, sales of automobiles in the world decreased by 7.4% in 1Q2019 compared to the same period of 2018. The data for the first half of the year may turn out to be even worse, since according to official data, the decline in car sales in China in January-May 2019 was 15.2%. Note that after 3-fold growth of palladium quotations, its consumption has decreased in the jewelry and electronics industry, in dental prosthetic and in the issue of investment coins and bars. Theoretically, it is possible to increase the dependence of quotations on the state of affairs in the global automotive industry and the chemical industry.

XPDUSD

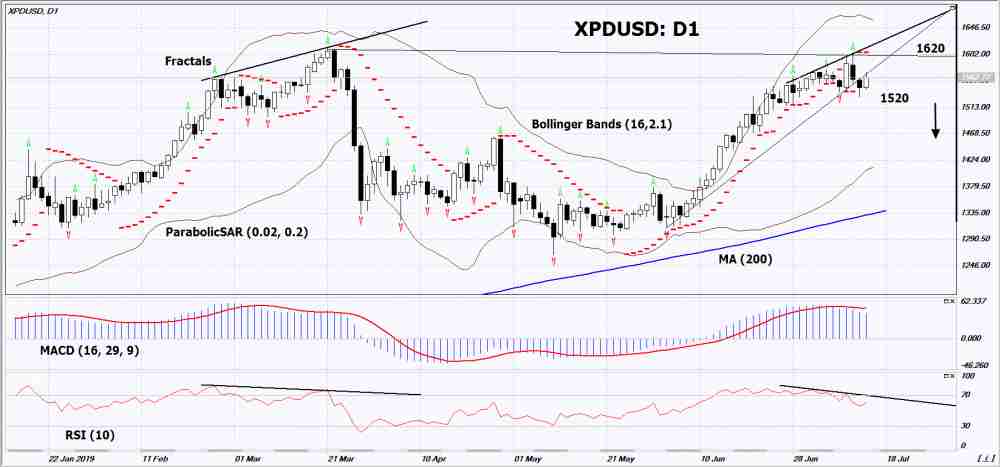
On the daily timeframe XPDUSD: D1 adjusted down from the historical maximum. It overcame the growing trend support line. Decrease in quotations is possible in the event of a decrease in global demand and a continuation of the decline in the Chinese automotive industry.

  • The Parabolic indicator indicates signal to decrease.
  • The Bolinger bands widened, indicating high volatility. The top line slopes down.
  • The RSI indicator is above the 50 mark. It has formed a divergence to decrease.
  • The MACD indicator gives bearish signal.

The bearish momentum may develop if XPDUSD will drop below its last high: 1520. This level can be used as an entry point. The initial stop lose may be placed higher than the last upper fractal, the historical maximum and the Parabolic signal: 1620. After opening the pending order, stop shall be moved following the the Bollinger and Parabolic signals to the next fractal minimum. Thus, we are changing the potential profit/loss to the breakeven point. More risk-averse traders may switch to the 4-hour chart after the trade and place a stop loss moving it in the direction of the trade. If the price meets the stop level (1520) without reaching the order (1620), we recommend to cancel the order: the market sustains internal changes that were not taken into account.

Technical Analysis Summary

PositionSell
Sell stopBelow 1520
Stop lossAbove 1620

Market Analysis provided by IFCMarkets

Ichimoku Cloud Analysis 16.07.2019 ( AUDUSD, NZDUSD, USDCAD)

Article By RoboForex.com

AUDUSD

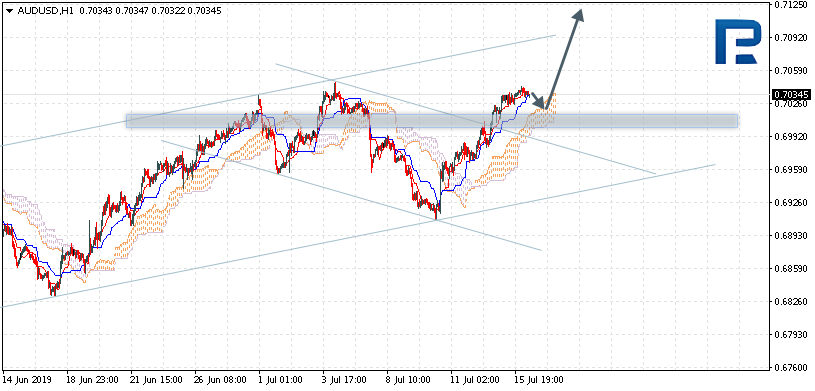
The instrument is trading at 0.703429 above the Ichimoku Cloud which suggests an ascending trend. Testing of the upper border of the Cloud near 0.7025 is expected, followed by growth to 0.7115. Yet another signal of growth may be a bounce off the support line. The scenario may no longer be valid in case the lower border of the Cloud is broken and trading closed under 0.6990, which may be followed by further decline below 0.6905.

AUDUSD_Анализ индикатора Ишимоку
Risk Warning: the result of previous trading operations do not guarantee the same results in the future

NZDUSD

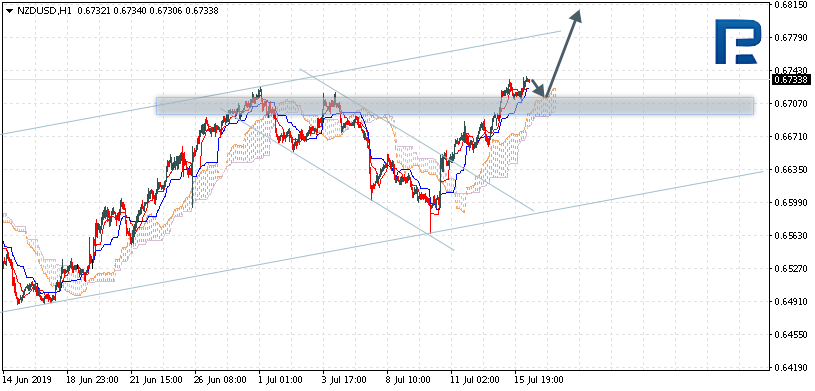
The instrument is trading at 0.6733 above the Ichimoku Cloud which suggests an ascending trend. A test of the signal lines near 0.6710 is expected, followed by growth to 0.6815. Yet another signal of growth may be a bounce off the support line. The scenario may no longer be valid in case the lower border of the Cloud is broken and trading closed under 0.6670, which may be followed by further decline to 0.6595.

NZDUSD_Анализ индикатора Ишимоку
Risk Warning: the result of previous trading operations do not guarantee the same results in the future

USDCAD

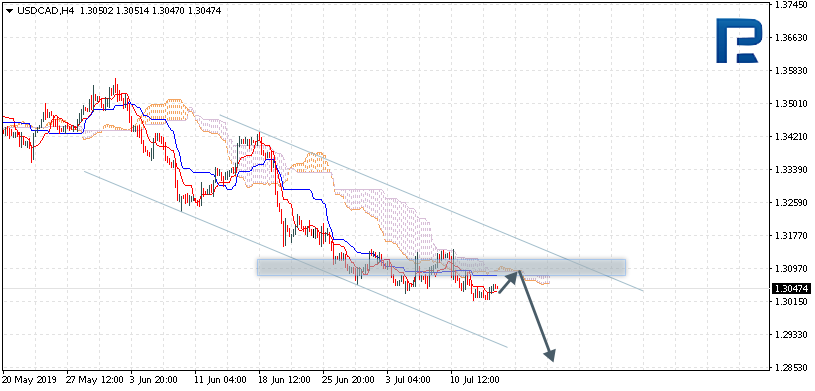
The instrument is trading at 1.3047 below the Ichimoku Cloud which suggests a descending trend. Testing of the lower border of the Cloud near 1.3065 is expected, followed by decline to 1.2855. Yet another signal of decline may be a bounce off the resistance line. The scenario may no longer be valid in case the upper border of the Cloud is broken and trading closed above 1.3135, which may be followed by further growth to 1.3205.

USDCAD_Анализ индикатора Ишимоку
Risk Warning: the result of previous trading operations do not guarantee the same results in the future

Article By RoboForex.com

Attention!
Forecasts presented in this section only reflect the author’s private opinion and should not be considered as guidance for trading. RoboForex LP bears no responsibility for trading results based on trading recommendations described in these analytical reviews.

Murray Math Lines 16.07.2019 (AUDUSD, NZDUSD)

Article By RoboForex.com

AUDUSD

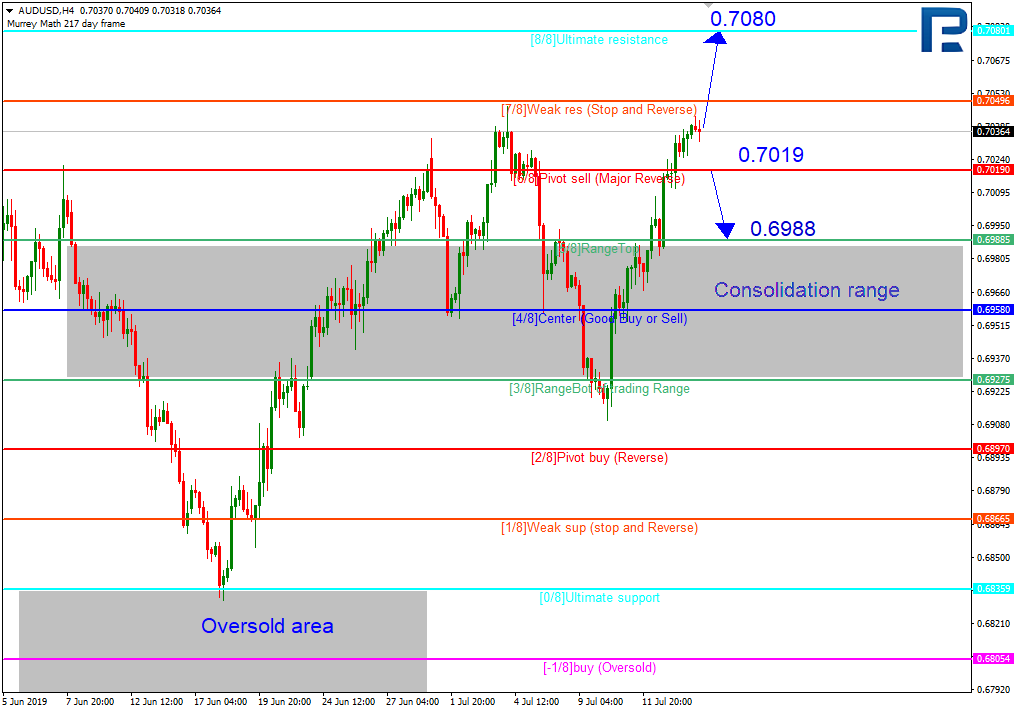
On H4 the instrument is trading above the consolidation area. The growth of price up to the resistance level 8/8 is expected. The scenario may no longer be valid if the price breaks through 6/8, which may entail further decline to the support at 5/8.

AUDUSD_H4_Анализ уровней Мюррея
Risk Warning: the result of previous trading operations do not guarantee the same results in the future

On M15 the upper line of the VoltyChannel is broken. This signifies prevalence of an ascending trend and may result in further price growth.

AUDUSD_M15
Risk Warning: the result of previous trading operations do not guarantee the same results in the future

NZDUSD

On H4 the instrument is trading in the overbought area. In this situation a breakthrough of 8/8 may lead to a correction down to 6/8. The scenario may no longer be valid if the instrument keeps growing, which may lead to a breakthrough of +2/8 and readjustment of the Murray lines. All in all, there is potential for growth but the goals may be determined after the readjustment of the lines.

NZDUSD_H4_Анализ уровней Мюррея
Risk Warning: the result of previous trading operations do not guarantee the same results in the future

On M15 the upper line of the VoltyChannel is broken through. This signifies high probability of further growth.

NZDUSD_M15
Risk Warning: the result of previous trading operations do not guarantee the same results in the future

Article By RoboForex.com

Attention!
Forecasts presented in this section only reflect the author’s private opinion and should not be considered as guidance for trading. RoboForex LP bears no responsibility for trading results based on trading recommendations described in these analytical reviews.

NQ Should Reach 8031 Before Topping

By TheTechnicalTraders.com

With earnings data starting to hit the markets and recent news that China’s economic activity levels shrank to levels not seen in nearly 30 years, we believe our proprietary Fibonacci price modeling system is showing us a target level in the NASDAQ (NQ) that will likely be reached within the next 7 to 10 days.  We believe once this target level is reached, the US stock market will immediately begin an extended topping formation with sideways price action and increased volatility) which will culminate in our August 19, 2019 setup date for a much deeper price correction.

At this time, traders should start to prepare for this topping event and prepare for price resistance to be found as the NQ nears this 8031 level – only 60 pts away.  If you are sitting on a bunch of profitable long trades, our suggestion would be to scale back 50% to 60% of these open positions and prepare for a top setup to begin within 7 to 10 days.  The volatility we expect to see over the next 30 days will likely be 2x or 3x current levels.

Nasdaq Daily Chart

This Daily NQ chart highlights the Fib Target Resistance level and shows our proprietary Fibonacci price modeling system’s current downside price targets (7760, 7400 and 7265).  These downside price target will change as the new price peak is established near the 8031 price level.

Nasdaq Weekly Chart

This NQ weekly chart highlights the same suggested resistance level (the YELLOW LINE drawn near the recent highs) and highlights deeper Weekly Fibonacci downside price targets near 6950, 6000 and 5950.

Our expectations are that economic weakness and price rotation will set up and begin a downside price move on or near August 19, 2019, based on our cycle research.  We believe this move will initially target a -6 to -9% downside price move, then extend into a much deeper price decline ending near the start of 2020 or within Q1 of 2020.

See my current trend and trade signals for the SP500 index here.

Conclusion:

Our researchers believe traders should be actively scaling back existing long positions in preparation for this top setup.  Key psychological levels have already been reached and the minute the NQ breaks above 8000, the key Fibonacci target level and the key psychological level (8000) become critical elements for the market top formation.

Now is the time to plan and prepare for these incredible price swings in the markets.  The next 18-24 months are certain to present technical traders with countless opportunities for success with these bigger price moves.

Our recent calls in the markets have resulted in over 42% in total gains over the past 60 days.  Isn’t it time you learned how TheTechnicalTraders.com can help you find and time better trades?

BECOME A TECHNICAL TRADER AND PROFIT WITH US

Chris Vermeulen
Technical Traders Ltd.


The Analytical Overview of the Main Currency Pairs on 2019.07.16

by JustForex

The EUR/USD currency pair

Technical indicators of the currency pair:
  • Prev Open: 1.12662
  • Open: 1.12574
  • % chg. over the last day: -0.10
  • Day’s range: 1.12554– 1.12635
  • 52 wk range: 1.1111 – 1.2009

The EUR/USD currency pair continues to consolidate. There is no defined trend. Local levels of support and resistance continue to be 1.12500 and 1.12800. Investors expect additional drivers. Today, investors will evaluate a number of important economic releases from Germany and the United States. We recommend to open positions from key levels.

The Economic News Feed for 16.07.2019:

  • – ZEW Economic Mood Index (GER) – 12:00 (GMT+3:00);
  • – Retail Sales Report (US) – 15:30 (GMT+3:00);
EUR/USD

Indicators do not give accurate signals: the price crossed 50 MA and 100 MA.

The MACD histogram is in the negative zone, but above the signal line, which gives a weak signal to sell EUR/USD.

The Stochastic Oscillator is in the neutral zone, the %K line is below the %D line, which indicates bearish moods.

Trading recommendations
  • Support levels: 1.12500, 1.12300, 1.12000
  • Resistance levels: 1.12800, 1.13100, 1.13500

If the price consolidates above 1.12800, expect further growth toward 1.13100-1.13400.

Alternatively, the quotes can drop toward 1.12200-1.12000.

The GBP/USD currency pair

Technical indicators of the currency pair:
  • Prev Open: 1.25495
  • Open: 1.25125
  • % chg. over the last day: -0.43
  • Day’s range: 1.25070 – 1.25203
  • 52 wk range: 1.2438 – 1.3631

GBP/USD once again moved to a decline. GBP updated local lows. At the moment, GBP/USD quotes are consolidating. The key range is 1.25100-1.25400. The pound remains under pressure due to the uncertainty around Brexit. Trading instrument has the potential to further decline. Today we expect important statistics from the UK. Positions must be opened from key levels.

At 11:30 (GMT + 3:00) a report on the labor market in the UK will be published.

GBP/USD

Indicators do not give accurate signals: the price has crossed 100 MA.

The MACD histogram is in the negative zone, but above the signal line, which gives a weak signal to sell GBP/USD.

The Stochastic Oscillator is in the neutral zone, the %K line crossed the %D line. There are no signals at the moment.

Trading recommendations
  • Support levels: 1.25100, 1.24800, 1.24400
  • Resistance levels: 1.25400, 1.25800, 1.26300

If the price consolidates below 1.25100, a further drop in GBP/USD quotes is expected. The movement will tend toward 1.24800-1.24600.

Alternatively, the quotes can grow toward 1.25700-1.25900.

The USD/CAD currency pair

Technical indicators of the currency pair:
  • Prev Open: 1.30312
  • Open: 1.30472
  • % chg. over the last day: +0.11
  • Day’s range: 1.30442 – 1.30588
  • 52 wk range: 1.2727 – 1.3664

The USD/CAD currency pair has stabilized. CAD is in lateral movement. Currently, the local support and resistance levels are: 1.30350 and 1.30600, respectively. In the near future, technical correction of the trading instrument after a long fall is not excluded. We recommend to pay attention to the dynamics of oil prices. Positions must be opened from key levels.

The Economic News Feed for 16.07.2019 is calm.

USD/CAD

Indicators do not give accurate signals: prices are fixed between 50 MA and 100 MA.

The MACD histogram is in the positive zone and continues to rise, indicating a correction of the USD/CAD quotes.

The Stochastic Oscillator is in the neutral zone, the %K line is below the %D line, indicating a bearish mood.

Trading recommendations
  • Support levels: 1.30350, 1.30200, 1.30000
  • Resistance levels: 1.30600, 1.30900, 1.31150

If the price consolidates above 1.30600, the price will rise toward 1.30900-1.31100.

Alternatively, the quotes can descend toward 1.30000.

The USD/JPY currency pair

Technical indicators of the currency pair:
  • Prev Open: 107.854
  • Open: 107.909
  • % chg. over the last day: +0.06
  • Day’s range: 107.820 – 108.094
  • 52 wk range: 104.97 – 114.56

The USD/JPY currency pair continues to consolidate. There is no defined trend. The safe harbor currency tests local support and resistance levels: 107.800 and 108.100, respectively. Financial market participants expect additional drivers. Today we recommend to pay attention to economic releases from the USA. Positions must be opened from key levels.

The Economic News Feed for 16.07.2019 is calm.

USD/JPY

Indicators do not give accurate signals: the price crossed 50 MA.

The MACD histogram is near the 0 mark.

The Stochastic Oscillator is in the neutral zone, the% K line is above the% D line, which indicates bullish moods.

Trading recommendations
  • Support levels: 107.800, 107.550
  • Resistance levels: 108.100, 108.300, 108.600

If the price consolidates below the 107.800, the quotes will fall toward 107.550-107.400.

Alternatively, USD/JPY can grow to 108.400-108.600.

by JustForex

The US Dollar Is Consolidating

by JustForex

The US dollar is changing slightly against a basket of major currencies. The US dollar index (#DX) closed trading session with a slight increase (+ 0.13%) yesterday. Trading activity and volatility in the foreign exchange market declined as investors focused on the publication of economic releases, which may signal further adjustments in interest rates of global Central Banks. Today, financial market participants will assess important statistics from the UK, Germany and the US.

During the Asian trading session, the New Zealand consumer price index has been published, which has met market expectations and counted to 0.6% (q/q). The British pound is still under pressure due to the uncertainty concerning Brexit. The main contenders for the post of leader of the Conservative Party, Boris Johnson and Jeremy Hunt, claimed that they were ready to the no-deal Brexit.

The “black gold” prices are stable. At the moment, futures for the WTI crude oil are testing $59.85 per barrel. At 23:30 (GMT+3:00) API weekly crude oil stock will be published.

Market Indicators

Yesterday, the bullish sentiment was observed in the US stock markets: #SPY (+0.03%), #DIA (+0.08%), #QQQ (+0.32%).

The 10-year US government bonds yield fell slightly. Currently, the indicator is at the level of 2.08-2.09%.

The News Feed on 2019.07.16:

– Data on the UK labor market at 11:30 (GMT+3:00);
– German ZEW economic sentiment at 12:00 (GMT+3:00);
– Statistics on retail sales in the US at 15:30 (GMT+3:00).

We also recommend paying attention to the speeches by the Governor of the Bank of England and FOMC representatives.

by JustForex

US Retail Sales To Rise Slower In June

By Orbex

The US Commerce Department will be releasing the monthly retail sales report today. Economists forecast that retail sales rose 0.3% in June, on a month over month basis. This follows a revised 0.5% increase in May.

The modest expectations come as economists try to pencil in the current economic state. There has been speculation about a possible slowdown in the US economy. However, various data points remain mixed.

Retail sales have grown for two consecutive months so far. A beat on the estimates could potentially see the second-quarter GDP expectations rising. The core retail sales, also known as the control group, are forecast to rise 0.4% on the month.

U.S. Retail Sales
U.S. Retail Sales, May 2019

Retail sales expanded for the second month in May, marking two consecutive months of gains. The numbers for April were also revised higher.  And the data for April and May underlined the uptick in consumer spending.

The retail sales data soothed concerns about a possible slowdown in the US economy. Investors will be looking to see how consumer spending fared in June. The data comes as the Federal Reserve is currently in the midst of deciding its monetary policy course.

Retail Sales Rise for 2nd Consecutive Month

Retail sales rose 0.5% in May, driven by increased spending on motor vehicles and other goods. On an annualized basis, retail sales grew 3.2%, comparing to the same period a year ago.

The numbers for April were revised to show a 0.3% increase against a drop of 0.2%.

The data for May was, however, slightly below estimates. This had investors speculating that the US GDP might have slowed during the second quarter of the year. Economists forecast that retail sales would rise 0.6% on the month.

Core retail sales which exclude automobiles, gasoline building and food services grew 0.4% on the month. This followed April’s revised numbers of a 0.4% increase. The core retail sales are seen to be closely corresponding with an increase in the GDP as well.

With consumer spending accounting for more than two-thirds of the GDP, the numbers for April and May were upbeat.

In Q1, retail sales grew quite a bit, and investors feared whether the pace of spending would continue into the second quarter. In Q2, retail sales have fallen from 3.8% in April to 2.9% in June year-on-year. Economists had expected a 3.4% raise, but that was short 50 basis points lower.

Auto dealership sales rebounded, rising 0.7% on the month in May. This followed April’s declines of 0.5%. The receipts at gasoline stations grew 0.3% in the month. Building materials edged modestly higher, rising 0.1%. Online sales and mail order purchases jumped 1.4% contributing to the gains.

The data for the two months raised the second-quarter GDP estimates. While initially, economists forecast a sub 2% GDP growth in the second quarter, this was revised higher. Based on the two-month retail sales report, economists now expect to see a higher than 2% GDP growth rate in the three months ending June.

Sales at auto dealerships accelerated 0.7% after dropping 0.5% in April. Receipts at service stations rose 0.3%.

Impact of June Report

Despite the upbeat figures, there were some underlying concerns. Exports had fallen in April alongside slowing inventory investment. Both manufacturing production and home sales also slowed during the period. These are likely to offset the gains in the retail sector when it comes to accounting for the third-quarter GDP.

Investors will be closely watching today’s retail sales report. The markets had initially speculated that the Fed would cut rates in July. However, the recent upbeat jobs report has dented the speculation on a larger rate cut.

Recent economic data is mixed, which further complicates the course for monetary policy. Fed officials seem to currently weigh the economic reports. This gives them a glimpse into how the US economy faredin the second quarter of the year.

A miss on the estimates will only see the markets raising their odds for a rate cut. However, if we get to see another monthly gain in retail sales, it could potentially lower the odds of a rate cut within the next two-three month horizon.

By Orbex