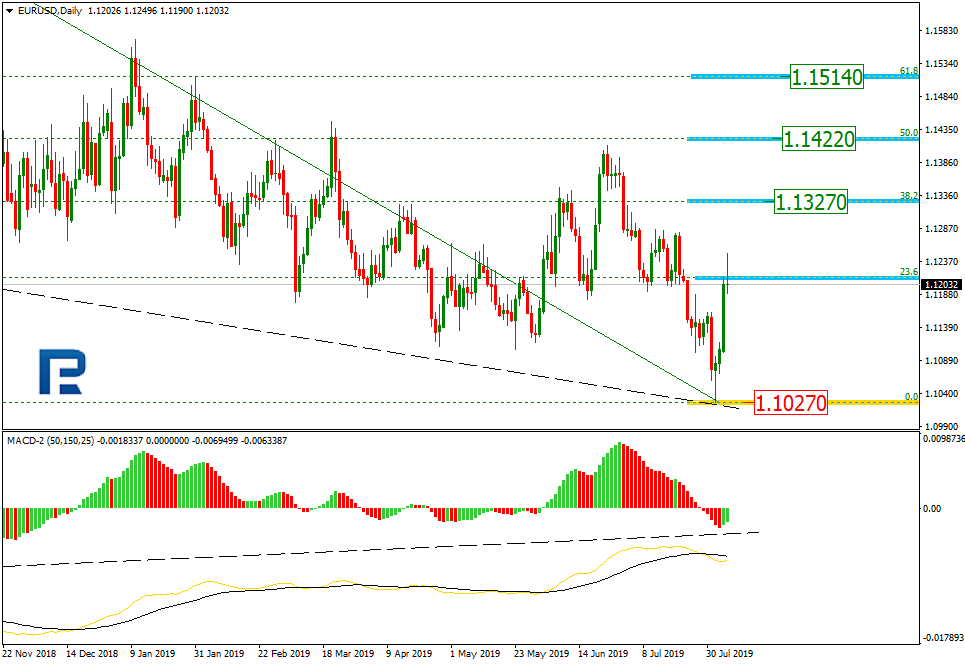
It would be better to analyze EURUSD in the daily chart. As we can see, after the price tried to reach the psychologically important level at 1.1000, there was a convergence on MACD, which made EURUSD start a new rising impulse that has already reached mid-term 23.6% fibo. The next upside targets may be 38.2%. 50.0%, and 61.8% fibo at 1.1327, 1.1422, and 1.1514 respectively. The resistance is the low at 1.1027.
In the H1 chart, after finishing its quick rising movement, EURUSD started a new pullback correction, which has already reached 23.6% fibo. The next targets may be 38.2%, 50.0%, and 61.8% fibo at 1.1165, 1.1139, and 1.1112 respectively. If the pair breaks the high at 1.1250, it may continue trading upwards.
USDJPY, “US Dollar vs. Japanese Yen”
As we can see in the daily chart, after plummeting and entering the post-correctional extension area between 138.2% and 161.8% fibo at 105.80 and 105.20 respectively, USDJPY has returned to 106.77. So far, this quick rise should be considered as an ascending correction. The key resistance is at 109.32.
In the H1 chart, the correction has reached 38.2% fibo. The next upside correctional targets may be 50.0% and 61.8% fibo at107.42 and 107.86 respectively. The support is the low at 105.52.
Attention! Forecasts presented in this section only reflect the author’s private opinion and should not be considered as guidance for trading. RoboForex LP bears no responsibility for trading results based on trading recommendations described in these analytical reviews.
The EUR/USD currency pair stabilized after significant growth during yesterday’s trading. The growth of the quotes exceeded 100 points. Investors began to partially fix the positions on the USD. Additional pressure on the US currency was provided by weak data on business activity in the US non-manufacturing sector from ISM. The focus remains on the trade conflict between Washington and Beijing. Currently, the EUR/USD currency pair is consolidating. The local support and resistance levels are: 1.11850 and 1.12150, respectively. We recommend opening positions from these marks.
At 17:00 (GMT+3) the US will publish the JOLTS report.
Indicators point to the strength of the buyers: the price has fixed above 50 MA and 100 MA.
The MACD histogram is in the positive zone, but below the signal line, which gives a weak signal to buy EUR/USD.
Stochastic Oscillator is located near the oversold zone, the %K line crossed the %D line. There are no signals at the moment.
Trading recommendations
Support levels: 1.11850, 1.11600, 1.11150
Resistance levels: 1.12150, 1.12450, 1.12800
If the price consolidates above 1.12150, further growth of EUR/USD quotes is expected. The potential movement is to 1.12450-1.12600.
Alternatively the currency pair could decrease to 1.11600-1.11400.
The GBP/USD currency pair
Technical indicators of the currency pair:
Prev Open: 1.21297
Open: 1.21368
% chg. over the last day: +0.06
Day’s range: 1.21355 – 1.21678
52 wk range: 1.2080 – 1.3385
The GBP/USD currency pair continues to trade in a long flat. There is no defined trend. The financial market participants expect additional drivers. At the moment, the local support and resistance levels are 1.21300 and 1.21800. We recommend keeping track of current information on the Brexit issue. In the near future, technical correction of the trading instrument after a prolonged fall is quite possible. You should open positions from key levels.
The Economic News Feed for 06.08.2019 is calm.
Indicators do not provide accurate signals: the price crossed 50 MA and 100 MA.
The MACD histogram is close to 0.
The Stochastic Oscillator is in the neutral zone, the %K line is below the %D line, which gives a signal to sell GBP/USD.
Trading recommendations
Support levels: 1.21300, 1.20850, 1.20500
Resistance levels: 1.21800, 1.22500, 1.23000
If the price consolidates above 1.21800, expect a correction toward 1.22300-1.22500.
Alternatively, the price could descend toward 1.20850-1.20600.
The USD/CAD currency pair
Technical indicators of the currency pair:
Prev Open: 1.32110
Open: 1.32012
% chg. over the last day: -0.08
Day’s range: 1.31869 – 1.32224
52 wk range: 1.2727 – 1.3664
The USD/CAD currency pair is still in sideways movement. There are no defined trends. At the moment, the following local support and resistance levels can be distinguished: 1.31800 and 1.32150, respectively. USD/CAD quotes has the potential for further growth. We recommend paying attention to the dynamics of oil quotes. Positions must be opened from key levels.
The Economic News Feed for 06.08.2019 is calm.
Indicators do not provide accurate signals, the price has crossed 100 MA.
The MACD histogram is in the negative zone and below the signal line which indicates a bearish sentiment.
The Stochastic Oscillator has started to leave the oversold zone, the %K line is above the %D line, which gives a signal to buy USD/CAD.
Trading recommendations
Support levels: 1.31800, 1.31500, 1.31200
Resistance levels: 1.32150, 1.32450, 1.32650
If the price consolidates above 1.32150, the USD/CAD currency pair is expected to grow to 1.32500-1.32700.
Alternatively, the price could drop toward 1.31500-1.31350.
The USD/JPY currency pair
Technical indicators of the currency pair:
Prev Open: 106.528
Open: 105.944
% chg. over the last day: -0.75
Day’s range: 105.521 – 107.088
52 wk range: 104.97 – 114.56
USD/JPY quotes began to recover after a long fall. The trading tool has updated local highs. At present, the currency of the “safe haven” is consolidating in the range of 106.250-106.800. Investors continue to monitor the trade conflict between Washington and Beijing. The US Treasury has accused China of currency manipulation. We also recommend paying attention to the dynamics of yield on US government bonds. Positions must be opened from key levels.
The Economic News Feed for 06.08.2019 is calm.
Indicators do not give accurate signals, the price has fixed between 50 MA and 100 MA.
The MACD histogram has moved into the positive zone, which indicates a further correction of the USD/JPY currency pair.
Stochastic Oscillator is in the neutral zone, the %K line is below the %D line, which gives a signal to sell USD/JPY.
Trading recommendations
Support levels: 106.250, 105.800, 105.550
Resistance levels: 106.800, 107.200, 107.500
If the price consolidates above 106.800, the price will correct toward 107.200-107.500.
Alternatively, the price could decrease toward 105.800-105.600.
Escalating trade tensions, fueled by weak economic data from the United States kept the greenback in check. The US dollar index fell for the third daily session, falling to a two-week low. Part of the declines also came as China’s yuan declined further. The yuan broke the psychological barrier of 7 yuan to the dollar. This prompted President Trump to comment that China was deliberately devaluing its currency. But Beijing hit back noting that it was in response to the US-led tariffs.
Euro Rises to a Two-Week High
The common currency gained ground on the back of a weak USD, pushing the currency pair to test a two-week high. Economic data for the eurozone was sparse. The final services PMI from Markit was almost in-line with the flash estimates. Eurozone’s services sector index rose to 53.2 against estimates of an increase to 53.3. The Sentix investor confidence was however weak, falling to -13.7 from -5.8 previously and was worse than the estimates of a decline to -6.9.
Can the EURUSD Rise Higher?
The currency pair broke past the minor resistance level of 1.1188 and was seen trading near the 1.1200 handle. In the near term, we could expect the declines to possibly stall near 1.1188. The declines, if severe, could see the euro easing to 1.1140 at worst. However, the downside could be limited for the moment, especially if the current narrative keeps up.
UK Services PMI and Weak USD Help GBP to Stabilize
The pound sterling was seen posting modest gains for a second day. The gains came with the UK’s services PMI coming out fairly better than expectations. Markit’s services PMI index was seen rising to 51.4 in July comparing to 50.2 in the month before. The data was also slightly better than the estimates of an increase to 50.4. The weaker USD also helped the currency pair to post the modest gains.
Will GBPUSD Maintain the Consolidation?
Price action in the cable suggests that there could be breakout soon, following the sideways range. We expect that there is a possibility for the GBPUSD to maintain a bottom near 1.2126 region in the near term. The consolidating descending wedge pattern could signal an upside breakout. This will push the GBPUSD to possibly test the main support level at 1.2400 that could be tested for resistance.
Gold Gains on Falling Risk Appetite
The precious metal was seen posting strong gains on Monday, as the bullish momentum picked up. The gains came largely due to falling risk appetite. U.S. equities fell sharply and continued their declines. Investors, as a result fled to safe haven assets. Gold posted intraday gains of 1469.59 at one point.
Can XAUUSD Maintain the Bullish Momentum?
The precious metal could be seen targeting the 1500 psychological level if the current momentum gains strength. However, the gains are likely to be dictated by the developing trade war narrative. It is likely now that the U.S. and China trade war could slip into currency wars. As a result, gold prices might be at risk of sudden volatility. To the downside, the main support level at 1428 will be tested in the near term.
The US dollar continued to decline against a basket of currency majors due to tense trade relations between the US and China. Yesterday, the US dollar index (#DX) closed trading in the negative zone (-0.56%). The US dollar was under pressure due to weak data on ISM non-manufacturing PMI.
US-China relations continue to escalate. The People’s Bank of China set the yuan reference rate at its lowest level for the year. The Chinese yuan collapsed due to these events, which sparked rumors that Beijing was ready to depreciate in order to offset the negative effects of US tariffs. Trump, in turn, accused China of currency manipulation. We recommend following current information on this issue.
The British pound is still under pressure. The EU believes that the new British Prime Minister, Boris Johnson, does not plan to make a deal on Brexit. As it became known, the official does not intend to resume negotiations with the European Union and look for solutions to exit Britain. It means that it is more likely that the country will leave the bloc without a deal before October 31 of the current year.
Today, during the Asian trading session, economic data from New Zealand and Australia have been published. Thus, the employment rate in New Zealand increased by 0.8% in the second quarter, while experts forecasted growth by only 0.3%. New Zealand’s unemployment rate counted to only 3.9% in the second quarter instead of 4.3%. The Reserve Bank of Australia decided on the interest rate and left the indicator unchanged at 1.00%.
The “black gold” prices are rising after the collapse the day before. At the moment, futures for the WTI crude oil are testing a mark of $55.00 per barrel. At 23:30 (GMT+3:00) API weekly crude oil stock will be published.
Market Indicators
Yesterday, aggressive sales were observed in the US stock markets: #SPY (-3.01%), #DIA (-2.91%), #QQQ (-3.53%).
The 10-year US government bonds yield has been recovering after a significant fall. At the moment, the indicator is at the level of 1.75-1.76%.
The selloff from risk assets continues today, with Asian equities extending this week’s declines, after the S&P 500 posted its biggest single-day drop so far in 2019.
The expanded scope of the US-China conflict, which now officially extends beyond trade and tech, has materially raised the bar on any attempts to reach a compromise ahead of the newly threatened US tariffs by September 1. At the time of writing, it remains to be seen exactly what trade-related measures will be called upon by China in response to the latest move out of the US administration, with Beijing having already pledged “necessary countermeasures”. The signalling out of the world’s two largest economies speaks to deteriorating global trade conditions which are set to drag the world economy’s growth projections lower for the year.
How much Yuan weakness will China tolerate?
Another key theme over the near-term is the level of Yuan weakness that will be tolerated by the People’s Bank of China. The PBOC has just set a daily reference rate of 6.9683, compared to Monday’s reference rate of 6.9225, which allows the onshore Yuan to move up to two percent either side of the rate against the US Dollar. While a weaker Yuan preserves some measure of competitiveness for Chinese exports, provided global demand holds up, it may also exert more downward pressure on currencies of trade-reliant economies across Asia and emerging markets.
Heightened US-China tensions adds to ‘Go for Gold’ mantra
The rapid and unexpected escalation in US-China tensions has sent markets scurrying towards safe-haven assets. Gold now has the psychological $1500 level in its sights, with Bullion prices having breached $1470 at the time of writing.
With alarms ringing over the projected path for the global economy that has been already dented by US-China trade tensions, investors are increasingly willing to park their money in the non-interest-bearing Bullion while ensuring that safe haven assets remain in vogue. The Japanese Yen is now trading below the 106 mark against the US Dollar, while yields on 10-year US Treasuries dipped briefly below 1.70 percent.
US-China conflict’s drag on global growth likely to prompt more Fed rate cuts
A dimmer global outlook should also heighten the prospects of more monetary policy easing out of global central banks, including the Federal Reserve. The Fed Funds Futures now point to a 42 percent chance that the Fed will cut US interest rates by 50 basis points at its September meeting.
Ramped-up expectations over multiple Fed rate cuts in 2019, despite Powell’s recent reluctance to capitulate to the markets’ dovish demands, have resulted in the Dollar index (DXY) unwinding recent gains, with the DXY testing the 97.2 support level at the time of writing.
Disclaimer: The content in this article comprises personal opinions and should not be construed as containing personal and/or other investment advice and/or an offer of and/or solicitation for any transactions in financial instruments and/or a guarantee and/or prediction of future performance. ForexTime (FXTM), its affiliates, agents, directors, officers or employees do not guarantee the accuracy, validity, timeliness or completeness, of any information or data made available and assume no liability as to any loss arising from any investment based on the same.
On Monday the 5th of August, trading on the EURUSD pair closed up. The day’s dominant theme was the ongoing trade dispute between the US and China.
On Friday the 2nd of August, Donald Trump announced that tariffs on Chinese goods would go up by 10% on the 1st of September. On Monday, the yuan shed 1.77% against the dollar. The stock market took a dive while gold, the yen, the Swiss franc, and bitcoin all rose.
During the US session, the US government officially labelled China a currency manipulator. China responded by halting the import of US agricultural produce. This has led to fears among investors that the trade conflict is set to continue for a while.
Day’s news (GMT+3):
17:00 US: JOLTS job openings (Jun).
19:00 US: Fed’s Bullard speech.
23:30 US: API weekly crude oil stock (2 Aug).
Current situation:
With a correction taking place on the safe haven assets, the EURUSD pair has corrected from the U3 line to 1.1190. There are currently no technical factors favouring a stronger euro; its rise is on account of geopolitical developments. China is showing no sign of backing down, while Trump is looking for new ways to pile on the pressure. It looks like the standoff between the two countries is set to continue, so keep an eye on the stock market, safe havens, the yuan, and Trump’s Twitter account. Trump has been the catalyst for the market’s most recent movements.
The EURUSD pair corrected by 45 degrees. The 67th degree and the trend line are sitting slightly lower at around 1.1175. At the time of writing, the pair is trading at 1.1205. I expect the pair to slide to 1.1180 followed by a recovery amounting to 76% of the drop from 1.1235. The economic calendar is virtually empty.
Investors are struggling to shake off the pounding hangover from yesterday’s dramatic global selloff as US-China trade tensions took a dangerous turn for the worse.
Any hopes of a resolution to longstanding trade disputes between both sides were thoroughly quashed after the Chinese Yuan slipped past the psychological 7.0 mark for the first time since 2008. With the US Treasury Department wasting no time in labelling China a currency manipulator for the first time since 1994, this could open doors to more US sanctions against China. Heightened fears over trade disputes between the two largest economies in the world reaching a point of no return have crippled risk appetite, ultimately exposing global equities to downside shocks.
Asian shares were painted bright red this morning following Wall Street’s gut-wrenching declines overnight. The negativity from Asian markets is likely to contaminate European stocks this morning. US stocks experienced their single worst day of 2019 in the previous session, and could extend losses this afternoon as US-China trade tensions drain investor confidence.
Dollar fails to benefit from safe-haven flows
The mighty Dollar was attacked from all directions yesterday despite trade concerns boosting appetite for safe-haven assets.
Appetite towards the Dollar was most likely hit by the disappointing ISM Non-Manufacturing PMI which dropped to 53.7 in July – the lowest since August 2016. With growth in the US services sector cooling as trade worries impact business orders and the outlook for economic growth, expectations are bound to mount over the Federal Reserve cutting interest rates again in 2019.
Given how the Dollar remains extremely sensitive to rate cut speculation, investors should fasten their seat belts and brace for Dollar volatility this quarter.
Commodity spotlight – Gold
Gold is positioned to remain one of the prime destinations of safety this week as the horrible combination of US-China trade disputes and global growth concerns boost appetite for safe-haven assets.
Fears over intensifying trade tensions destabilizing global growth and stability have already elevated the precious metal to a fresh 6-year high above $1473 this morning. Although prices are slipping back towards $1460 as of writing, the precious metal remains technical and fundamentally bullish. For as long as risk appetite is dented by global growth fears, trade drama and Brexit uncertainty among many other geopolitical risk factors, Gold bulls will remain in the driving seat.
In regards to the technical picture, the solid daily close above $1460 may open the doors towards $1485 and $1500, respectively.
Disclaimer: The content in this article comprises personal opinions and should not be construed as containing personal and/or other investment advice and/or an offer of and/or solicitation for any transactions in financial instruments and/or a guarantee and/or prediction of future performance. ForexTime (FXTM), its affiliates, agents, directors, officers or employees do not guarantee the accuracy, validity, timeliness or completeness, of any information or data made available and assume no liability as to any loss arising from any investment based on the same.
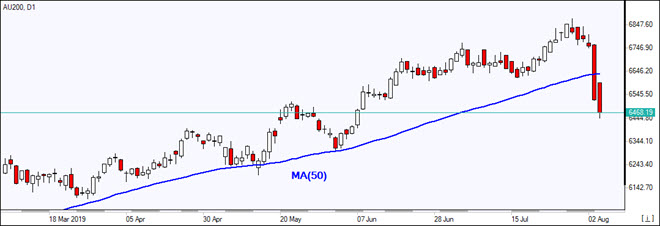
US stock indexes losses widened on Monday as China’s yuan fell to a more-than-10-year low versus the dollar. The S&P 500 fell 3% to 2844.74. Dow Jones industrial lost 2.9% to 25717.74. The Nasdaq composite dropped 3.5% to 7726.04. The pace of dollar weakening more than doubled: the live dollar index data show the ICE US Dollar index, a measure of the dollar’s strength against a basket of six rival currencies, fell 0.7% to 97.40 but is higher currently. Stock index futures point to higher market openings today
DAX 30 loss smallest among European indexes
European stocks extended losses on Monday. The EUR/USD climb accelerated yesterday while GBP/USD resumed its slide, both have reversed currently. The Stoxx Europe 600 index ended 2.3% lower. The DAX 30 lost 1.8% to 12658.51. France’s CAC 40 slid 2.2% and UK’s FTSE 100 dropped 2.5% to 7223.85.
Hang Seng still loss leader among Asian indexes
Asian stock indices are tracking today Wall Street losses overnight. Nikkei closed 0.7% lower at 20585.31 despite the yen slide against the dollar. Markets in China are falling as yuan steadied and Beijing confirmed it was suspending purchases of US agricultural products: the Shanghai Composite Index is down 1.8% and Hong Kong’s Hang Seng Index is 1.3% lower. Australia’s All Ordinaries Index deepened previous session losses 2.4% as Australian dollar turned higher against the greenback.
Note: This overview has an informative and tutorial character and is published for free. All the data, included in the overview, are received from public sources, recognized as more or less reliable. Moreover, there is no guarantee that the indicated information is full and precise. Overviews are not updated. The whole information in each overview, including opinion, indicators, charts and anything else, is provided only for familiarization purposes and is not financial advice or а recommendation. The whole text and its any part, as well as the charts cannot be considered as an offer to make a deal with any asset. IFC Markets and its employees under any circumstances are not liable for any action taken by someone else during or after reading the overview.
Thibaut Lepouttre of the Caesars Report has combed through the data, done the math and provides this assessment on the mining firm.
Introduction
Southern Silver Exploration Corp. (SSV:TSX.V; SSVFF:OTCQB; SEG1:FSE) has kept its promises and provided an updated resource estimate on its 40%-owned flagship Cerro Las Minitas (CLM; polymetallic) project in the second quarter of the year. We have combed through the technical report of the resource update and combined this with the previously reported results of the metallurgical test work on the different types of mineralization at CLM to build some sort of (very) preliminary economic model to check how the recent resource updates and more fine-tuned metallurgical test work has impacted the net present value (NPV) of the project.
All our calculations are based on what we think are reasonable assumptions, but keep in mind they are for educational purposes only and should definitely not be interpreted as Southern Silver’s official guidance or expectations. The official preliminary economic assessment (PEA), expected to be published in late 2020, is the document that will really matter.
The pre-summer resource update was excellent
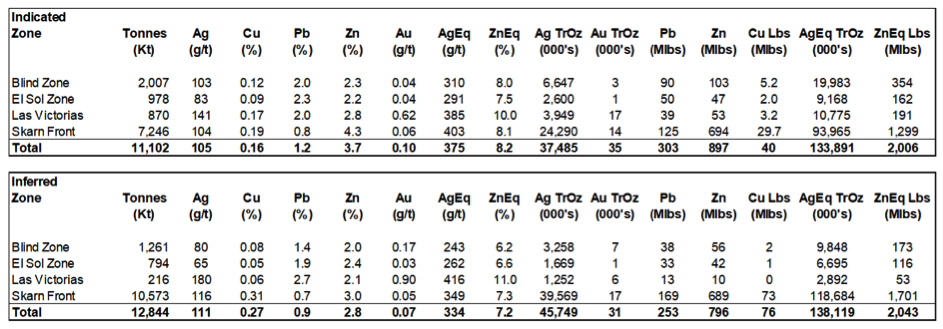
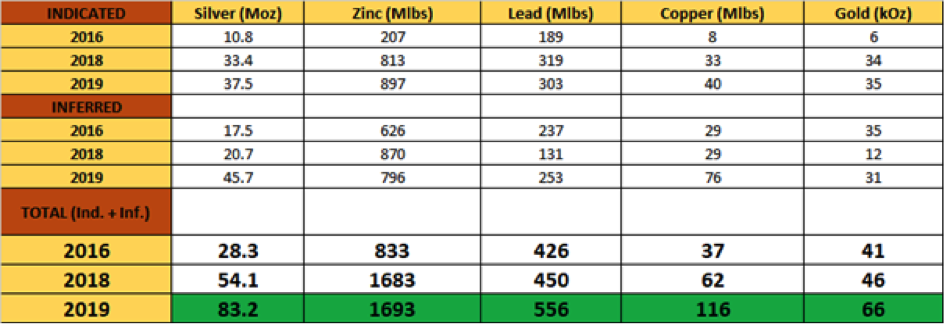
Southern Silver was able to update its resource estimate at the Cerro Las Minitas project right before the summer after completing an additional 10,157 meters of drilling. These additional meters added a lot of value as the indicated resource increased to almost 134 million ounces (134 Moz) silver equivalent (Ag eq) (consisting of 37.5 Moz silver, 35,000 ounces gold, 303 million pounds lead, a bit of copper and almost 900 million pounds of zinc).
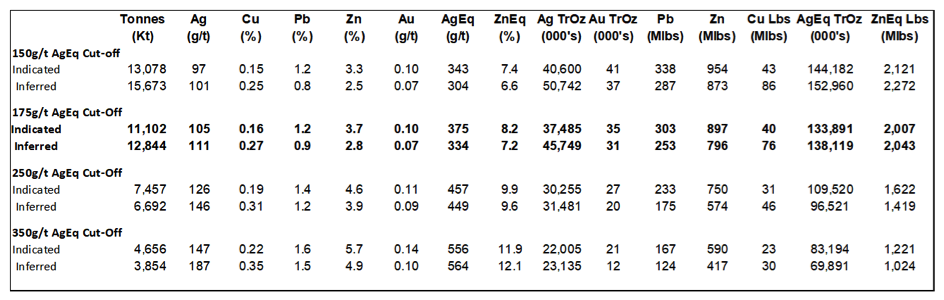
There’s an additional 138 million ounces of silver equivalent in the Inferred category, and of the 134 Moz, almost 46 Moz are pure silver, with the majority of the silver equivalent consisting of zinc. These results are based on a cut-off grade of 175 g/t silver equivalent (based on a $75/t operating, smelting and sustaining cost), but even at a higher cut-off grade of 250 g/t Ag eq the project would still contain in excess of 200 Moz Ag eq.
The resource estimate consists of four separate deposits, and the newly discovered Skarn Front zone is the main contributor to the updated resource estimate as this zone added almost 5 million tonnes of rock to the overall resource. The relatively low US$2M that was spent in 2018 on additional exploration resulted in adding 5.1 million tonnes to the combined indicated and inferred resources, and added 63 million ounces silver equivalent. Definitely a good return on investment!
The next table shows how the resource has increased over the past three years. The total amount of silver in all resource categories combined has tripled, while the zinc resource has doubled to almost 1.7 billion pounds.
Based on this updated resource, we can now update our preliminary and very much back-of-the-envelope economic model, which we published in 2018. Despite the additional data, our accuracy level will still be relatively low, as both different types of the deposit have different recovery rates. The Blind, El Sol and Las Victorias deposits have (slightly) higher recovery rates for silver, gold and lead, but the Skarn Front boasts a higher zinc and copper recovery rate. Additionally, Southern Silver is still working on optimizing the flow sheet to make sure the metals end up in the most favorable concentrate (as explained before, you would want the silver to end up in the lead concentrate, as the payability in the zinc concentrate is much lower).
A caveat
Before we dive into some numbers, we would like to emphasize (once again) that there will be a lot of assumptions and projections in this article. All of these projections will be based on publicly available material, but please keep in mind these are our own calculations and conclusions and should not be seen as an official point of view from the company.
The calculations (and corresponding explanations on how we get to our numbers) are only meant as a “back of the envelope” calculation, to have a first look at the project before Southern Silver publishes its PEA. This report should only be considered to be what it isassumptions that we deem to be realistic, but not as refined as an official NI-43-101-compliant mine plan (which could use a different ore sequencing, have different initial capital expenditures and operating expenditures, etc.).
The importance of the September 2018 metallurgical update
The updated metallurgical test results that were published last year are actually very encouraging. There are no huge changes in the recovery rates of the lead, silver and gold, but two important elements deserve to be singled out here.
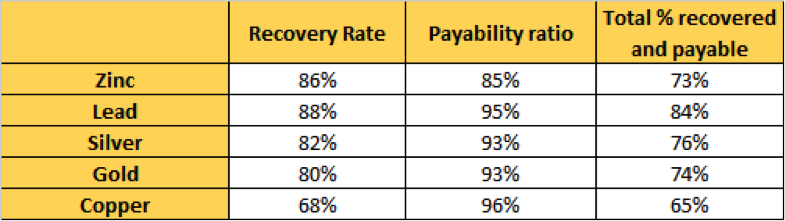
First of all, the zinc recoveries have increased by quite a bit: Approximately 89% of the zinc mineralization in the Skarn zone is being recovered into a zinc concentrate while the sulphide zones at BlindEl Sol showed an 78% recovery of the zinc in a zinc concentrate. The weighted average of both recovery rates thus increases to 86% (note: we realize a weighted average isn’t 100% reliable, but it does show you the positive developments on the metallurgical front).
Looking at the zinc concentrate, it looks like there will now be a very small silver credit payable. The average grade of the silver in the zinc concentrate produced from the Skarn zone is 111 g/t. For the first three ounces of silver per tonne of concentrate, a company doesn’t get paid anything, while the payability ratio is around 70% for the metal above this cut-off grade.
This means that, per tonne of zinc concentrate, Southern Silver should be able to be paid on 0.7 X 18 g = 12.6 grams of silver. That’s around 0.4 ounces per tonne and just $6/t zinc concentrate at this point. Considering the total resource (Indicated and Inferred) would result in the production of approximately 1.2 million tonnes of zinc concentrate, the $6/t will contribute just $7 million over the entire mine life. So that’s negligible. Also, because we just cannot assume 100% of the Indicated resources and 100% of the Inferred resources will make it to the mine plan, that’s just not realistic at this stage, but exploration is obviously still ongoing). Needless to say we will not account for this small byproduct credit in our assumptions.
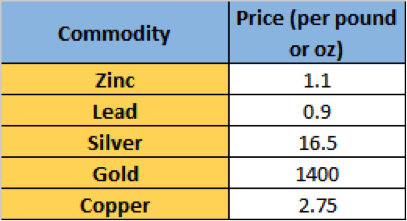
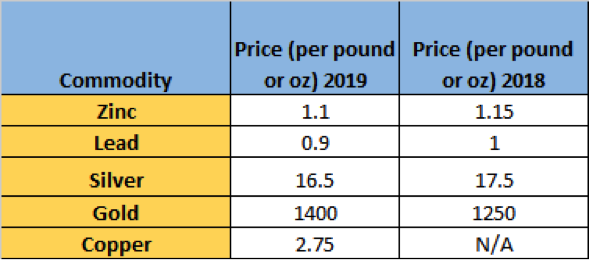
Second, in the metallurgical update, Southern Silver was also successful in producing a copper concentrate. In our previous back-of-the-envelope model, we didn’t take the copper into account. But according to last year’s test work, almost 68% of the copper was recovered in a concentrate with a marketable grade of 27.9% copper (in line with the standard specifications for a copper concentrate). Additionally, approximately 15% of the silver reported to the copper concentrate, and that’s important because the minimum deduction for silver in the copper concentrate is just one, while the payability of the remainder is 90% ounce (meaning Southern Silver won’t get paid for the first ounce in the concentrate, and $15 per ounce for the remaining silver, using a silver price of $16.5/oz).
It’s very clear that producing a separate copper concentrate with a high silver content is much more valuable than seeing the silver end up in the zinc concentrate, so by producing the copper concentrate, Southern Silver wins on both fronts: It’s now able to recover and sell the copper while it will increase its silver revenue.
And sure, while Cerro Las Minitas doesn’t contain a lot of copper and the 68% recovery rate isn’t that great, it does have the potential to move the needle. The Skarn zone contains 103 million pounds of copper in the Indicated and Inferred resource, and after applying the 68% recovery rate and 96% payability, the total amount of recoverable and payable pounds of copper would be 67 million. Assuming a copper price of $2.75, that’s an additional US$185 million in net smelter revenue.
But the operating costs will obviously also increase a bit by adding the copper flotation circuit and it’s unlikely every pound of copper will be mined. But more than the increase in the zinc recovery rate, being able to produce a separate copper concentrate could move the needlenot just on the NPV and cash flow front, but it would also allow Southern Silver to negotiate different offtake agreements with different parties for the copper, lead and zinc concentrates at Cerro Las Minitas, as different counterparties may offer different terms for each of the specific concentrates.
Putting everything together in an economic model
Now we have established the percentages of the metals that could be recovered and the percentages of the gross value of the concentrate that will effectively be paid by smelters, we can work toward establishing a net smelter return (NSR) model based on the average grades of the Indicated and Inferred resource categories. We are using the following commodity prices:
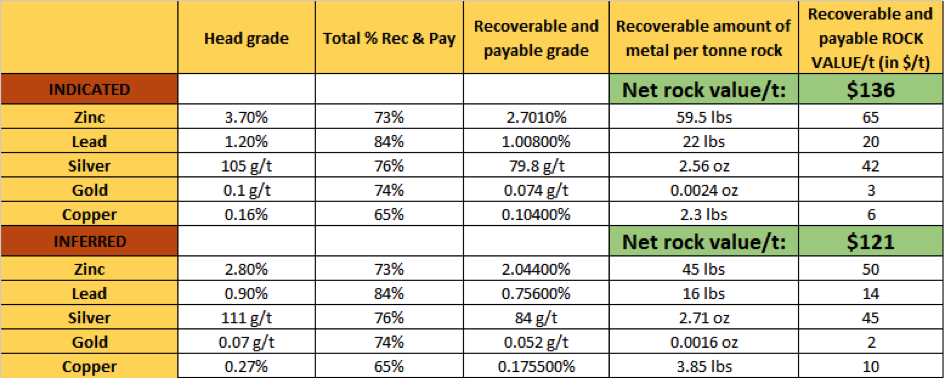
Again, these are just averages and in some years the net value of the rock will be higher than in other years, depending on the mine plan. This results in the following (average) net smelter revenue per tonne of rock based on the current resource estimate:
There are a few interesting observations to be made here. Although we are now using lower commodity prices compared to our previous model from last year (see the table below), the higher recovery rates and the addition of a copper concentrate to the product mix (last year, we excluded any potential byproduct revenue from the copper), we see a slightly higher NSR in the Indicated resource ($136/t versus $132/t last year) and a virtually unchanged value of the Inferred resource, where the higher silver grade is mitigating the impact of the lower zinc grade.
Applying last year’s prices on the updated resource estimate would result in a NSR of $144/t for the Indicated resource and $127/t for the Inferred resource. So a marginal increase of the commodity prices does have a meaningful impact on the NSR.
Again, these calculations are merely meant for educational purposes. You can easily rebuild them in your own spreadsheet and apply recovery rates and metal prices of your choice.
Using the net smelter returns to complete a back-of-the-envelope NPV calculation
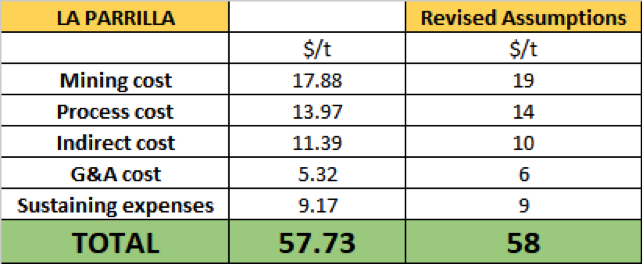
As mentioned last year, the La Parrilla mine owned by First Majestic Silver Corp. (FR:TSX; AG:NYSE; FMV:FSE)could provide a good basis to build an economic model. We are using the results from the 2017 technical report on the La Parrilla mine and have tweaked it a little bit (and are assuming the treatment charge/recovery charge (TC/RC) will be part of the indirect costs). TC/RC will be important as they could have a meaningful impact on the revenue generated by the zinc concentrate. For Southern Silver’s zinc concentrate, with a grade of 50.7%, the difference between a TC/RC of $245/t (the current price) and $180/t (which is used by some miners as long-term cost) would make a difference of just over $0.05 per produced pound of zinc. Definitely an important factor to keep an eye on!
Note these costs (La Parrilla) are based on a throughput of up to 2,000 tonnes per day (tpd). As we will assume a 4,000 tpd throughput in the Cerro Las Minitas model (due to the higher tonnage in the resource estimate), it would be realistic to assume some economies of scale will take place as well, and the real operating cost could be a few dollar per ton lower. But for now, let’s use $58/t.
Given the net smelter revenue of $136/t for the indicated resources and $121/t for the inferred resources, the net margins could reasonably be expected to be respectively $78/t and $63/t (on a pre-tax basis)
In 2018, we used an initial capex of US$280 million (US$280M) for a 2,500 tpd mine and processing plant. Considering the recent resource update to 24 million tonnes (in the Indicated and Inferred resource categories), this may be a bit too low for an optimized mining and processing scenario. As such, a 4,000-tpd mining and milling scenario may be justified (of course this will depend on the mine plan as there are no guarantees the mine could yield 4,000 tonnes of pay dirt per day), and we will assume the initial capex to be US$375M.
Next up: determining a discount rate. Although the company’s name is Southern “Silver”, the silver is just a byproduct, as 67% of the recoverable and payable rock value in the Indicated categories is generated by base metals. So we will use a weighted average between a discount rate of 5%, which seems to be the standard for precious metals projects these days (but too low, if you ask us), and the 8% that appears to be common for base metals projects. So, let’s use 7%.
Let’s now assume the higher-value Indicated resources gets mined first for the first seven years, where after Southern Silver switches to the lower-grade Inferred resources for the subsequent eight years (this clearly is not a real-life scenario, as the mine plan will be based on what’s the most opportune mining scenario rather than categorizing things as Indicated and Inferred. But, as mentioned before, there’s no mine plan yet, so we will just have to work with assumptions here to at least get an idea of what we are looking at).
Another assumption is to use a 10-year depreciation schedule for the initial capex, and to use a total tax pressure of 40% (corporate tax + the specific mining taxes). This means that the total average tax per processed tonne of rock in the first seven years will be 0.40 X [(1.44Mt X 78/t) $37.5M] = $30M, or $21 per processed tonne.
For years 810, the numbers are: 0.40 X [(1.44Mt X $63/t) $37.5M] = $22M, or $15/t.
For years 1115 there will be no depreciation allowance and the tax pressure will be 0.4 X $63/t = $25/t.
This results in the following after-tax cash margins per tonne of processed rock:
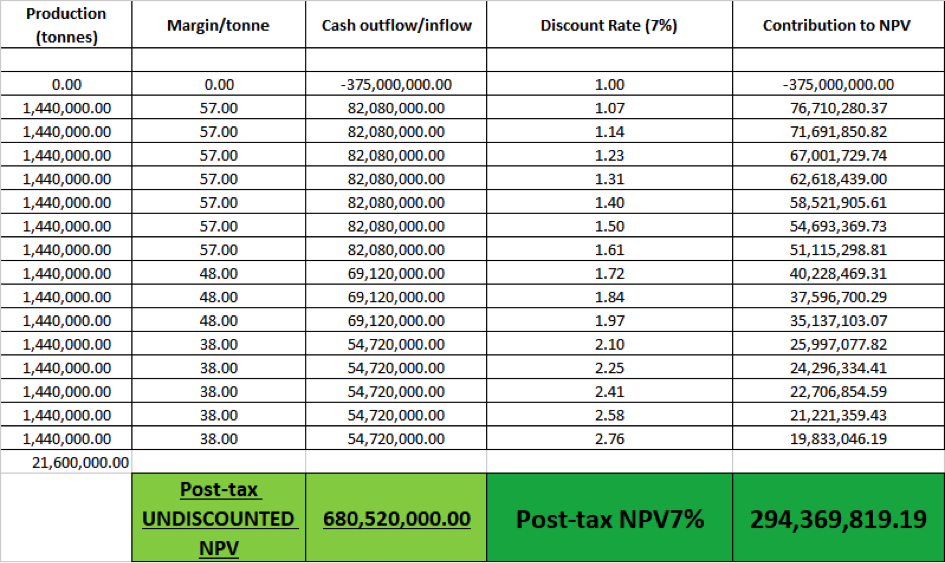
Years 17: $57/t Years 810: $48/t Years 1115: $38/t
Using these numbers in a back-of-the-envelope calculation based on an annual throughput of 1.44 million tonnes results in this:
So according to our “thinking exercise,” the after-tax NPV7%, based on the assumptions and inputs we mentioned before, would be US$294M. Southern Silver owns 40% of the project so its attributable NPV7% would be US$118M or CA$154M.
Raising CA$3M to further advance Cerro Las Minitas
Last week, Southern Silver announced its plans to issue 10 million units priced at CA$0.20 per unit to raise CA$2M to be spent on advancing Cerro Las Minitas to the next stage. The financing is “priced to sell,”as it contained a full warrant exercisable for a five-year period at CA$0.25, making it a very appealing “sweetener”for people with a long-term vision who are bullish on either the zinc price and/or the silver price.
The financing appeared to be a huge success as the financing was oversubscribed on the very same day and subsequently increased to CA$3M.Additionally, Electrum and another warrant holder have indicated their desire to exercise just over 10 million warrants with an exercise price of CA$0.08 to add an additional CA$835,000 in proceeds to the treasury. The warrant exercises will also help to remove the warrant overhang as there were approximately 25 million warrants with an exercise price of CA$0.08. This will now decrease to approximately 15 million, and as they have expiration dates in 2020 and 2021, we would expect these to be gradually exercised throughout their remaining term.
Conclusion
Southern Silver’s exploration programs continue to add value to the Cerro Las Minitas project, and the increased resources should make it easier to put a longer-term mine plan together. In our calculations, we ended up with an after-tax NPV7% of US$295M for the entire project, and the after-tax NPV7% attributable to Southern Silver came in at just over CA$150M.
Of course, there still are a lot of other variables that could change (mine life, capex, throughput, etc.), so our calculations are and should be seen as one “thinking exercise” in anticipation of the publication of the “official” PEA, which is slated for late 2020.
Thibaut Lepouttre is the editor of the Caesars Report, a newsletter and mining portal based in Belgium that covers several junior mining companies with a special focus on precious metals and base metals. Lepouttre has a Bachelor of Law degree and two economics masters degrees that have forged his analytical approach to the mining sector. Considered a number cruncher, Lepouttre focuses on the valuations of companies and is consistently on the lookout for the next undervalued mining company.
Disclosure: 1) Thibaut Lepouttre: The author has a long position in Southern Silver and is participating in the current financing. The author’s company has a financial relationship with Southern Silver. The author determined which companies would be included in this article based on his research and understanding of the sector. Additional disclosures are available here. 2) The following companies mentioned in this article are billboard sponsors of Streetwise Reports: None. Click here for important disclosures about sponsor fees. 3) Statements and opinions expressed are the opinions of the author and not of Streetwise Reports or its officers. The author is wholly responsible for the validity of the statements. The author was not paid by Streetwise Reports for this article. Streetwise Reports was not paid by the author to publish or syndicate this article. Streetwise Reports requires contributing authors to disclose any shareholdings in, or economic relationships with, companies that they write about. Streetwise Reports relies upon the authors to accurately provide this information and Streetwise Reports has no means of verifying its accuracy. 4) This article does not constitute investment advice. Each reader is encouraged to consult with his or her individual financial professional and any action a reader takes as a result of information presented here is his or her own responsibility. By opening this page, each reader accepts and agrees to Streetwise Reports’ terms of use and full legal disclaimer. This article is not a solicitation for investment. Streetwise Reports does not render general or specific investment advice and the information on Streetwise Reports should not be considered a recommendation to buy or sell any security. Streetwise Reports does not endorse or recommend the business, products, services or securities of any company mentioned on Streetwise Reports. 5) From time to time, Streetwise Reports LLC and its directors, officers, employees or members of their families, as well as persons interviewed for articles and interviews on the site, may have a long or short position in securities mentioned. Directors, officers, employees or members of their immediate families are prohibited from making purchases and/or sales of those securities in the open market or otherwise from the time of the interview or the decision to write an article until three business days after the publication of the interview or article. The foregoing prohibition does not apply to articles that in substance only restate previously published company releases.
Performance during the quarter and guidance for the rest of 2019 are reviewed in a Raymond James report.
In an Aug. 1 research note, Raymond James analyst Justin Jenkins reported that Magellan Midstream Partners L.P.’s (MMP:NYSE) Q2/19 results are positive, as is the nearing completion of several growth projects.
Jenkins highlighted that the master limited partnership (MLP) beat adjusted EBITDA and distributable cash flow (DCF) estimates in Q2/19. Adjusted EBITDA was $378.3 million versus Raymond James’ $355.5 million estimate and consensus’ $356 million forecast. Strong performance in Magellan’s Crude and Refined Products segments and lower maintenance and interest expense drove this.
DCF came in at $314.8 million, well above Raymond James and consensus’ estimates of $284.3 million and $285.1 million, respectively.
As for performance by segment, Jenkins indicated that Refined Products and Crude did the best, each beating Raymond James’ projection. Refined Products returned a $238 million operating margin; Raymond James expected $205.5 million. Crude’s operating margin was $160.3 million, and Raymond James forecasted $148 million.
The Marine segment fared worse. Its Q2/19 operating margin was $30 million, below Raymond James’ $33.4 million forecast. Refined Products and Crude, however, more than offset Marine’s underperformance.
Jenkins noted that based on strong Q2/19 performance and a positive outlook for Q3/19 spot shipments on BridgeTex/Longhorn, Midstream’s management increased full-year 2019 EBITDA/DCF guidance by 3%, or $40 million, which still remains conservative, Jenkins indicated.
He added, “Further, if the market opportunity remains open (which we think is likely for at least some portion of Q4/19), continued spot shipments would add about $20 million per quarter to DCF based on prior guidance.” In addition, management remains committed to its goal of growing distribution by 5% this year.
Jenkins pointed out that several of Midstream’s growth projects are nearly finished, including the Galena Park marine terminal, the Pasadena joint venture, Seabrook and others. To complete them, management expects to outlay $1.1 billion in 2019 and $150 million in 2020.
Raymond James has an Outperform rating on Magellan Midstream. The MLP currently has a share price of around $66.64.
Disclosure: 1) Doresa Banning compiled this article for Streetwise Reports LLC and provides services to Streetwise Reports as an independent contractor. She or members of her household own securities of the following companies mentioned in the article: None. She or members of her household are paid by the following companies mentioned in this article: None. 2) The following companies mentioned in this article are billboard sponsors of Streetwise Reports: None. Click here for important disclosures about sponsor fees. 3) Comments and opinions expressed are those of the specific experts and not of Streetwise Reports or its officers. The information provided above is for informational purposes only and is not a recommendation to buy or sell any security. 4) The article does not constitute investment advice. Each reader is encouraged to consult with his or her individual financial professional and any action a reader takes as a result of information presented here is his or her own responsibility. By opening this page, each reader accepts and agrees to Streetwise Reports’ terms of use and full legal disclaimer. This article is not a solicitation for investment. Streetwise Reports does not render general or specific investment advice and the information on Streetwise Reports should not be considered a recommendation to buy or sell any security. Streetwise Reports does not endorse or recommend the business, products, services or securities of any company mentioned on Streetwise Reports. 5) From time to time, Streetwise Reports LLC and its directors, officers, employees or members of their families, as well as persons interviewed for articles and interviews on the site, may have a long or short position in securities mentioned. Directors, officers, employees or members of their immediate families are prohibited from making purchases and/or sales of those securities in the open market or otherwise from the time of the interview or the decision to write an article until three business days after the publication of the interview or article. The foregoing prohibition does not apply to articles that in substance only restate previously published company releases.
Disclosures from Raymond James, Magellan Midstream Partners L.P., August 1, 2019
ANALYST INFORMATION
Analyst Holdings and Compensation: Equity analysts and their staffs at Raymond James are compensated based on a salary and bonus system. Several factors enter into the bonus determination including quality and performance of research product, the analyst’s success in rating stocks versus an industry index, and support effectiveness to trading and the retail and institutional sales forces. Other factors may include but are not limited to: overall ratings from internal (other than investment banking) or external parties and the general productivity and revenue generated in covered stocks.
The analysts Justin Jenkins and J.R. Weston, primarily responsible for the preparation of this research report, attest to the following: (1) that the views and opinions rendered in this research report reflect his or her personal views about the subject companies or issuers and that no part of the research analyst’s compensation was, is, or will be directly or indirectly related to the specific recommendations or views in this research report. In addition, said analyst(s) has not received compensation from any subject company in the last 12 months.
RAYMOND JAMES RELATIONSHIP DISCLOSURES Certain affiliates of the RJ Group expect to receive or intend to seek compensation for investment banking services from all companies under research coverage within the next three months.
Limited Partnerships may generate unrelated business taxable income (UBTI), which can create a tax liability that must be paid from a retirement account.
Raymond James & Associates, Inc. makes a market in the shares of Magellan Midstream Partners L.P.
Additional Risk and Disclosure information, as well as more information on the Raymond James rating system and suitability categories, is available here.