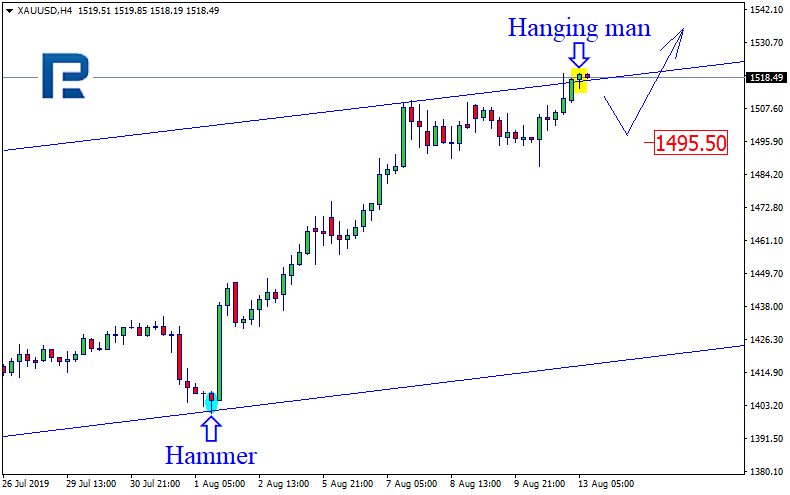
As we can see in the H4 chart, the ascending tendency continues. After forming Hanging Man pattern, XAUUSD is testing the channel’s upside border and may reverse. The target of the pullback is at 1495.50. At the same time, we shouldn’t exclude a possibility that the instrument may break the border and continue moving upwards without a significant correction.
NZDUSD, “New Zealand vs. US Dollar”
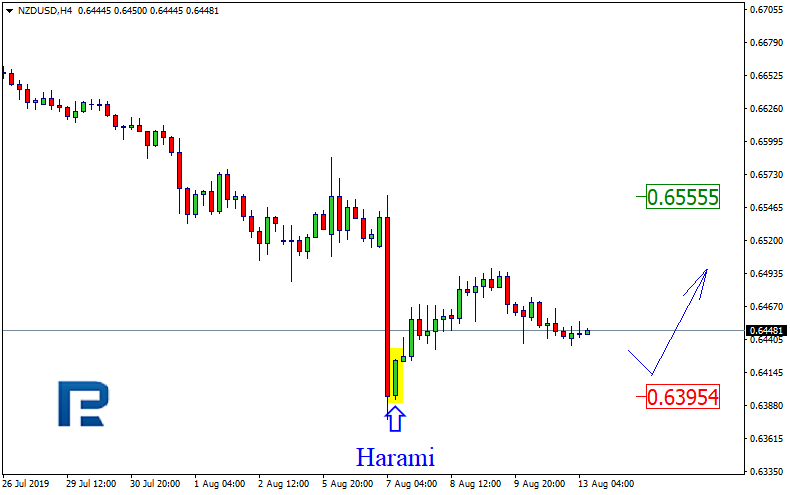
As we can see in the H4 chart, NZDUSD is still trading close to the support level, where it has formed Harami pattern. Right now, the pair is rebounding from the support line. In this case, the price may reverse and grow towards the resistance line at 0.6555. At the same time, one shouldn’t exclude an opposite scenario, according to which the instrument may complete the correction, break the support level at 0.6395, and continue falling.
Attention! Forecasts presented in this section only reflect the author’s private opinion and should not be considered as guidance for trading. RoboForex LP bears no responsibility for trading results based on trading recommendations described in these analytical reviews.
Our researchers have created this research post to highlight a big price move based on super-cycle research and patterns that should begin on or near August 19, 2019. Back in April/May 2019, we started warning of a critical top formation we believed was aligned for July 2019. In May/June, we altered this date to align more closely with our super-cycle research and determined the August 19, 2019 date.
It is our belief that this date will initiate a breakdown price move that may align with external news related or economic related data. Our research continues to point to the potential for a large global breakdown in equity prices related to some type of near-crisis event. It could be related to something within the US or outside the US – but either way, we slice it, August 19 looks to be the date we need to focus on.
This FANG custom index weekly chart highlights how our Fibonacci Price Amplitude Arcs work in alignment with price rotation and trends. The theory behind this analysis is that price trends operate at a frequency and amplitude that we can map out – much like Tesla’s theory of Mechanical Resonance.
In our studies, we have learned how to identify relative price amplitude and frequency factors, then align these to price peaks and valleys. The result is that we can see where hidden support and resistance channels form and where the price will potentially reach an “inflection point”.
Right now, this week and next on this FANG chart are likely to see increased volatility and the potential for a price breakdown as the current RED arc level sets up a massive resistance channel.
Custom Smart Cash Index Chart
Our custom Smart Cash Index chart is also highlighting an overall weakness in the US and global markets. Once this chart breaks the lower price channel level, there is a very strong possibility that this index will break down toward the $134 level (or lower) as the global markets attempt to identify price support. Overall lows could target the $111 level (seeing in 2016) if the breakdown is excessive.
Custom Volatility Index
This Custom Volatility Index is suggesting a deeper price low is setting up if the August 19 breakdown date acts as we suspect. If the global markets break lower, then this Custom Volatility Index will be pushed into an extreme low territory (below 5.5) were a very deep bottom/base will setup (as we have seen before). If it reaches levels below 4.0, then we should be very close to a very deep “V” type bottom.
The recovery from this base/bottom will likely be somewhat extended as the shift in the capital around the globe seeks out the best, safest locations and returns. We believe this bottom will complete near the end of 2019 or into early 2020 where the US markets will quickly gain acceptance as the location for global assets to avoid extended risks.
What Does All This Mean?
August 19 is only a few days away and we could see fireworks start in the global financial market place.
If our analysis is correct, we have only 4 to 7+ days before a major breakdown in price starts and we are yet unsure of the source or intensity of this event if there is one. Multiple analysis types are pointing to August as a key turn date and the market could fall by as much as 16-25% if there is a trigger event to spark the crisis.
What should you do? Well, being a pilot, quasi engineer, and technical trader using logic, rules, and processes to do things. I always wait for the price to confirm a new trend before taking action and entering a position. This is how we profited last week from the SP500 index falling. We traded the 2x bear fund SDS and locked in a quick profit.
The days are long gone where I would buy or sell stocks or trends based on tips and forecasts. That type of trading is really called legal gambling and the odds generally are not in your favor unless you tips are coming from insiders who actually know something.
Using technical analysis and proven strategies we can follow the market trends and profit from them no matter which the market moves. We bet with the market (the house) and provide entry, target, and stops for all trades we initiate.
It’s now been a year since we saw the crash in TRY. This crash led USDTRY to explode from around 5.25232 at the start of August 2018 to highs of 7.11745 in under two weeks.
It has been an important year for Turkey. What began as a diplomatic standoff with the US spiraled into a full-scale backlash against a credit-driven overheating of the economy.
Turkish Economy Recovering
In Q2 2018, Turkish growth fell into negative territory. Growth made it all the way down to -2.4% as of the final quarter of last year.
However, over Q1 this year, growth moved back up into positive territory. It hit 1.3% as a result of credit stimulus ahead of local elections. Following some significant adjustment over the last twelve months, the Turkish economy is now in much better health.
Inflation has also come down sharply. Headline CPI topped 25% in October last year and has now fallen back to 16.7% as of July this year. It is forecast to end the year at 15% or under.
Furthermore, the current account deficit, expressed as a percentage of GDP, has also recovered. From 6.5% in Q2 2018, it sits at 1.7% as of Q1 this year.
CBRT Cuts Rates
Following a series of sharp rate hikes last year to counter the spiraling inflation, the CBRT cut rates in July this year from 24% to 19.75%. This cut was greater than forecast with the CBRT noting that continued improvements in the inflation outlook, along with better domestic demand and supported the move.
Erdogan Supporters Split
In the political landscape, things have also changed. Turkey’s dominant AK party lost power in the country’s biggest cities in local elections held in March.
President Erdogan demanded re-elections, but the AK party was once again wiped out and defeated by an overwhelming majority. As a result, there has been a deeper split among those loyal to Erdogan and those expressing concern over his behavior and motivations.
Indeed, some senior members of the AK party have discussed forming a new political party. The new party aims to attract support from current, disillusioned AK party members.
Consumer Confidence Still Shaky
While the economy is back on a better footing, consumer confidence is still a little shaky. After the index recovered in March and April of this year, it suffered another hit in May.
Furthermore, although retail sales have recovered from the heavy hit they took in October–December last year, they have remained in negative territory all year so far. They started in January at -6.4% and sit at -3.7% as of the last reading.
PMI readings have also improved since Q3 last year. However, they have yet to move back into expansionary territory above the 50 level. Essentially, while leading indicators reflect a mild recovery, they are not yet showing signs of a strong pickup.
Global Downturn
Given the general downturn in global growth due to the ballooning US-China trade war, Turkish trade with the eurozone is suffering. This is ultimately capping the recovery.
However, with the Fed expected to ease further and the ECB also likely to start easing again, there is a greater appetite for higher-yielding EM assets. This should help buffer Turkey through increase capital inflows.
As a result of these offsetting factors, the current trajectory of subdued economic growth is likely to continue in Turkey allowing the CBRT to continue cutting rates.
Technical Perspective
The decline in USDTRY over the year has been framed by the falling wedge pattern which price is currently still trading within. After recent lows around 5.4497, price is now retesting the 5.5852 level with the top the falling wedge pattern sitting just above. If we break above here, focus will be on a test of the 5.70319 level next. Bullish divergence in the RSI indicator coupled with the falling wedge pattern, suggests the risk of a reversal higher.
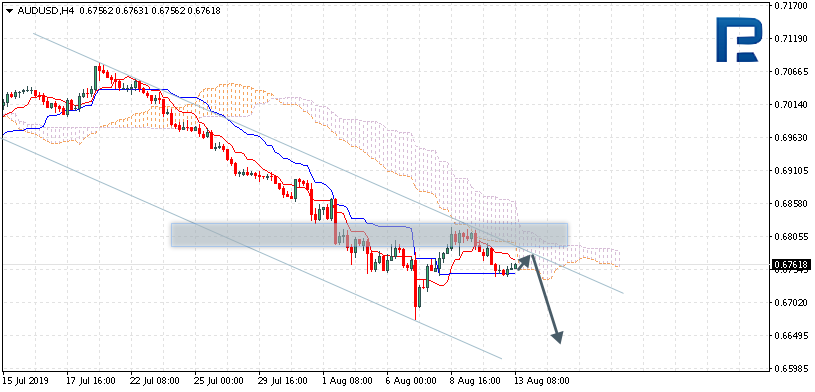
AUDUSD is trading at 0.6761; the instrument is moving below Ichimoku Cloud, thus indicating a descending tendency. The markets could indicate that the price may test the cloud’s downside border at 0.6765 and then resume moving downwards to reach 0.6635. Another signal to confirm further descending movement is the price’s rebounding from the descending channel’s upside border. However, the scenario that implies further decline may be canceled if the price breaks the cloud’s upside border and fixes above 0.6825. In this case, the pair may continue growing towards 0.6905.
NZDUSD, “New Zealand Dollar vs US Dollar”
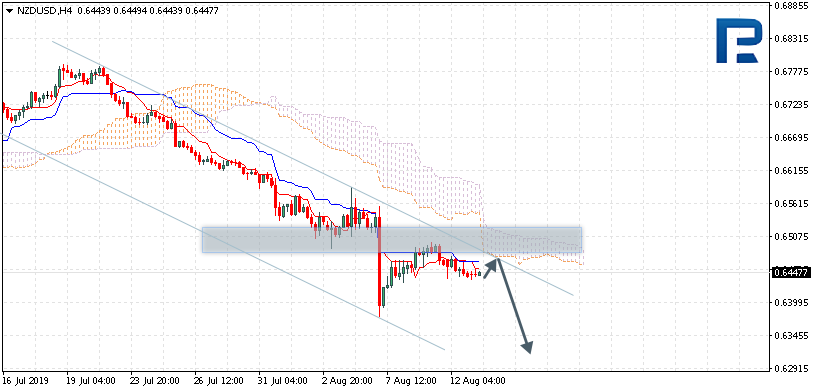
NZDUSD is trading at 0.6447; the instrument is moving below Ichimoku Cloud, thus indicating a descending tendency. The markets could indicate that the price may test the cloud’s downside border at 0.6455 and then resume moving downwards to reach 0.6315. Another signal to confirm further descending movement is the price’s rebounding from the resistance level. However, the scenario that implies further decline may be canceled if the price breaks the cloud’s upside border and fixes above 0.6525. In this case, the pair may continue growing towards 0.6645.
USDCAD, “US Dollar vs Canadian Dollar”
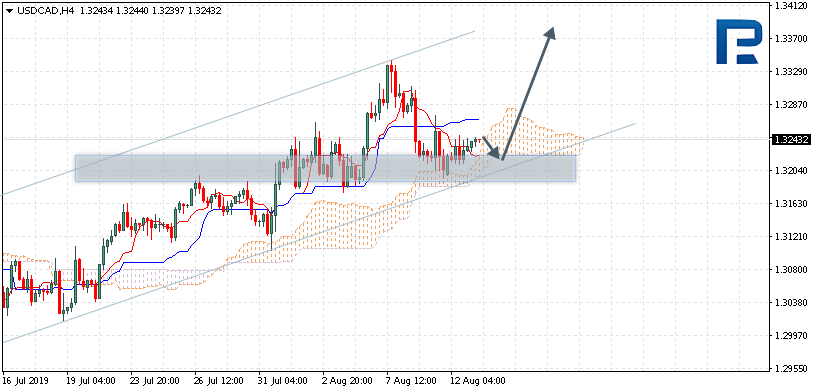
USDCAD is trading at 1.3243; the instrument is moving above Ichimoku Cloud, thus indicating an ascending tendency. The markets could indicate that the price may test the cloud’s downside border at 1.3230 and then resume moving upwards to reach 1.3375. Another signal to confirm further ascending movement is the price’s rebounding from the rising channel’s downside border. However, the scenario that implies further growth may be canceled if the price breaks the cloud’s downside border and fixes below 1.3175. In this case, the pair may continue falling towards 1.3095.
Attention! Forecasts presented in this section only reflect the author’s private opinion and should not be considered as guidance for trading. RoboForex LP bears no responsibility for trading results based on trading recommendations described in these analytical reviews.
A lack of any clear fundamentals over the day on Monday, saw investors staying cautious. The major narrative of trade wars and risk aversion kept equity markets in check. Some of the major US equity indices closed in the red, while safe-haven gold and yen continued to remain in favor. The US dollar index gapped lower on Monday’s open but closed directionless.
Euro Posts Modest Gains
The common currency was seen closing the day with some modest gains. This came despite the ongoing political turmoil in Italy. The euro was seen brushing aside concerns as the Italian government could be facing down a no-confidence vote sometime soon.
EURUSD Trades Flat at the Moment
The currency pair has been trading in a rather tight range over the past few days. A sideways range has been established within 1.1185 and 1.1250. This flat price action could potentially see a breakout in the near term. The bias is still to the upside. But a convincing break out is required for the euro to push higher. The next main target is seen at 1.1340.
Sterling Bounces Back after Friday’s Losses
The pound sterling was seen posting some modest gains on Monday. However, price action was confined to the range from Friday’s close. GBP fell after the UK’s economy was seen contracting during the second quarter. Economic data today will see the monthly jobs report, which could help to push the currency higher.
Can GBPUSD Recover Off the Lows?
A continuation to the upside will depend on how today’s jobs report will come out. GBPUSD managed to rebound off the lows near 1.2014. However, price is seen struggling near the minor resistance area of 1.2082. A firm breakout above this level will potentially see some upside building up. Alternately, we expect the currency pair to continue its descent lower.
Gold Holds Steady Above 1495
The precious metal was seen posting some modest gains on Monday. Price was clearly looking to the upside amid cautious trading. Economic data was sparse leading to investor concerns staying in the forefront. The US monthly inflation report is due today. This could potentially be a market-moving event.
Can XAUUSD Remain Above 1495?
Gold has clearly formed support at the 1495 handle. While the precious metal is testing the previous highs, failure to breakout higher could signal a correction. This will depend on whether the support will give way. A breakdown below 1495 could trigger a further correction in gold. Watch the lower support in the 1447–1448 region which could be the downside target in the near term.
The technical pattern on the EUR/USD currency pair is still ambiguous. The trading instrument is in a sideways trend. A unidirectional trend is not observed. Investors expect additional drivers. At the moment, local support and resistance levels are 1.11650 and 1.12150, respectively. We expect the publication of important economic releases. The EUR/USD quotes are tending to recover. We recommend opening positions from the key levels.
The News Feed on 13.08.2019:
– ZEW economic sentiment indices in Germany and the Eurozone at 12:00 (GMT+3:00);
– Inflation report in the US at 15:30 (GMT+3:00).
Indicators do not give accurate signals: 50 MA has crossed 100 MA.
The MACD histogram is near the 0 mark.
Stochastic Oscillator is near the oversold zone, the %K line has crossed the %D line. There are no signals at the moment.
Trading recommendations
Support levels: 1.11650, 1.11150
Resistance levels: 1.12150, 1.12450, 1.12800
If the price fixes above 1.12150, an increase in the EUR/USD quotes is expected. The movement is tending to 1.12450-1.12700.
An alternative could be a decrease in the EUR/USD currency pair to 1.11450-1.11300.
The GBP/USD currency pair
Technical indicators of the currency pair:
Prev Open: 1.20428
Open: 1.20718
% chg. over the last day: +0.49
Day’s range: 1.20558 – 1.20837
52 wk range: 1.2080 – 1.3385
The British pound recovered an insignificant part of losses against the US dollar yesterday. The GBP/USD currency pair has updated local highs. This movement was mostly caused due to technical factors. Currently, the GBP/USD quotes are consolidating in the range of 1.20550-1.20850. We do not exclude further correction of the trading instrument. Investors expect important statistics on the UK economy. Positions should be opened from the key levels.
At 11:30 (GMT+3:00) a report on the labor market will be published in the UK.
Indicators do not give accurate signals: the price is testing 50 MA.
The MACD histogram is near the 0 mark.
Stochastic Oscillator is located near the oversold zone, the %K line has crossed the %D line. There are no signals at the moment.
Trading recommendations
Support levels: 1.20550, 1.20150, 1.20000
Resistance levels: 1.20850, 1.21400
If the price fixes above 1.20850, further correction of the GBP/USD quotes is expected. The movement is tending to 1.21200-1.21400.
An alternative could be a decrease in the GBP/USD currency pair to 1.20350-1.20150.
The USD/CAD currency pair
Technical indicators of the currency pair:
Prev Open: 1.31986
Open: 1.32322
% chg. over the last day: +0.14
Day’s range: 1.32322 – 1.32491
52 wk range: 1.2727 – 1.3664
The USD/CAD currency pair continues to consolidate. A unidirectional trend is not observed. Financial market participants expect additional drivers. Currently, local support and resistance levels are 1.32150 and 1.32500, respectively. Today we recommend paying attention to economic releases from the United States, as well as the dynamics of oil prices. Positions should be opened from the key levels.
The news feed on Canada’s economy is calm.
Indicators do not give accurate signals: the price has fixed between 50 MA and 100 MA.
The MACD histogram has moved to the positive zone, which points to the power of buyers.
Stochastic Oscillator is near the overbought zone, the %K line has crossed the %D line. There are no signals at the moment.
Trading recommendations
Support levels: 1.32150, 1.31850, 1.31250
Resistance levels: 1.32500, 1.32750, 1.33100
If the price fixes above 1.32500, the USD/CAD currency pair is expected to grow. The movement is tending to 1.32800-1.33000.
An alternative could be a drop in the USD/CAD quotes to 1.31850-1.31600.
The USD/JPY currency pair
Technical indicators of the currency pair:
Prev Open: 105.554
Open: 105.266
% chg. over the last day: -0.12
Day’s range: 105.154 – 105.583
52 wk range: 104.97 – 114.56
Sales are still prevailing on the USD/JPY currency pair. Demand for “safe” assets remains at a fairly high level. Support is provided by the growth of geopolitical risks in Italy and Hong Kong, as well as the uncertainty in trade demand between Washington and Beijing. At the moment, the USD/JPY quotes are consolidating in the range of 105.100-105.650. Today we recommend paying attention to economic reports from the US. Positions should be opened from the key levels.
The news feed on Japan’s economy is quite calm.
Indicators do not give accurate signals: the price has crossed 50 MA.
The MACD histogram is near the 0 mark. There are no signals at the moment.
Stochastic Oscillator is in the neutral zone, the %K line is below the %D line, which indicates the bearish sentiment.
Trading recommendations
Support levels: 105.100, 104.800
Resistance levels: 105.650, 106.250, 106.650
If the price fixes below 105.100, a further fall in the USD/JPY currency pair is expected. The movement is tending to 104.800-104.600.
An alternative could be the correction of the USD/JPY quotes to 106.000-106.300.
The monthly consumer price index data will be released by the US Department of Commerce today.
According to the median expectations, consumer prices are forecast to rise slightly higher in July. This would mark a modest increase in inflation. However, it will, by no means change the underlying narrative from the Fed.
Expectations are for the headline inflation rate to inch higher to 1.7% on the year ending July. This marks a modest increase from the 1.6% print from the previous month.
On a month over month basis, headline inflation is forecast to rise 0.3% in July, higher than June’s print of 0.1%.
The core inflation rate, which excludes the volatile food and energy prices, is forecast to remain steady at 2.1%. It has been steadily anchored around the 2.1% level for the past few months, on a year over year basis.
On a monthly basis, we can expect the core inflation rate to slow to 0.2%, down from 0.3% in June.
CPI YOY Index, July 2019
The general expectation for an increase in consumer prices falls in line with the overall trends in inflation. Data from various other economies released so far shows that inflation managed to rise in July.
The gains in inflation were partly due to higher oil prices, which lift energy prices as well. WTI crude oil rose to almost $61.00 a barrel in July. This was a two-month high in oil prices after crude oil fell sharply in May this year.
As a result, the increase in consumer prices in the United States falls in line with the underlying global trend.
Inflation Data Unlikely to Move Markets or Impact Fed
The CPI data that will come out today will continue to see the Fed remaining on the sidelines. The central bank had previously noted that the rate cut it delivered in July wasn’t the start of an easing cycle.
On the contrary, the rate cut was seen more of an adjustment, in response to the uncertain economic conditions.
Even a strong beat on the estimates will not play a big role. Investors are more likely to wait and assess for data further down the line. On the contrary, if inflation data misses the estimate, resulting in a lower annualized print, it could have some impact.
This comes as the market expectations and that of the Fed’s remain disconnected at the moment. With the central bank maintaining that it is in no rush to lower rates, it would take further deteriorating conditions to compel the Fed to cut again.
Initially, investors expected the Fed to cut rates in July by 50 basis points. However, Fed officials responded by delivering just a quarter-point rate cut. However, speculation remains that the central bank will cut one more time this year.
But for the most part, the speculation of a rate cut will be data-dependent rather than a set course.
How the Federal Reserve will respond will depend on how inflation, one of the key things that the Fed looks at, will trend in the coming months.
Various forward-looking surveys have also pointed to the fact that a weaker pace of increase in consumer prices could help revive the economy. The US economy has been maintaining a slower pace of momentum. This is evident in the somewhat slower pace of GDP growth.
As a result, weaker inflation will keep consumers spending more amid the Fed maintaining the interest rates at a steady level.
The US dollar has not changed a lot against a basket of currency majors. Yesterday, the US dollar index (#DX) closed the trading session in the negative zone (-0.13%). Investors expect additional drivers. Today, important economic releases from the UK, Germany and the United States will be published. Experts also expect new information regarding US-China trade relations, as well as the Brexit process.
Market sentiment is still volatile due to events in Hong Kong and Argentina. In Hong Kong, mass protests against strict police actions to break up recent demonstrations have been lasting for more than two months. On Monday, more than 130 flights were canceled at Hong Kong Airport, as thousands of protesters gathered in the departure and arrival halls. Meanwhile, on Monday, the stock market and the Argentine peso fell sharply due to the presidential election, where opposition candidate Alberto Fernandez won. These events support the demand for “safe” assets.
The situation in the UK is getting worse amid the oncoming Brexit. According to The Guardian, one-in-five Britons are stockpiling food, drinks, and medicine. British people and large companies fear that Britain will leave the bloc without a deal and it will lead to a crisis.
The “black gold” prices have been growing. Currently, futures for the WTI crude oil are testing the $55.20 mark per barrel. At 23:30 (GMT+3:00) API weekly crude oil stock will be published.
Market Indicators
Yesterday, the bearish sentiment was observed in the US stock markets: #SPY (-1.22%), #DIA (-1.44%), #QQQ (-1.15%).
The 10-year US government bonds yield has declined significantly again. At the moment, the indicator is at the level of 1.64-1.65%.
The news feed for 2019.08.13:
– UK labor market data at 11:30 (GMT+3:00); – ZEW economic sentiment indices in Germany and the Eurozone at 12:00 (GMT+3:00); – US inflation report at 15:30 (GMT+3:00).
Six out of 10 investors are now actively seeking to move assets out of Britain as a perfect storm looks set to hit the UK economy, reveals a new poll.
The survey of more than 740 clients carried out by deVere Group, one of the world’s largest independent financial advisory organizations, which has $12bn under advisement, comes as the pound plunged to its lowest level for a decade late on Sunday amid growing fears the UK is heading for a no-deal Brexit.
It also follows Monday’s report by the Office for National Statistics (ONS) that finds the outlook for the general economic situation for the year ahead is worse than at any point since the final quarter of 2011.
Nigel Green, the CEO and founder of deVere Group, notes: “There is a legitimate and growing sense amongst those who were polled that in order to build and safeguard wealth, assets should be moved outside of the UK.
“It comes amid a slew of negative official data and public sentiment regarding Britain’s economic outlook over the next few years.
“Clients have expressed that they feel there’s a closing ‘window of opportunity’ to transfer their UK-based financial assets within the next few months.”
He continues: “Investors are seeing a perfect storm brewing: the UK’s slowing economy, weak global economic growth, the pound at a 10 year-low, the increasing possibility of an interest rate cut and the risk of a no-deal Brexit pushing the UK into a recession.
“Increasingly they’re now actively looking to take action to mitigate the risks to their wealth – as well as benefitting from the opportunities – through established, international financial planning solutions.”
It’s not just individuals and families. It has been widely reported that firms in the City of London alone have already committed to moving many billions out of the UK to prepare for Brexit – and this figure is expected to increase with many leaving details of their plans unpublished until the Brexit deadline on October 31.
Last month, Nigel Green noted: “There is no end in sight to the embattled British pound’s plight with both the current Prime Minister Boris Johnson and the leader of the official opposition Labour Leader Jeremy Corbyn promoting policies that will deliver fresh – and serious – blows to the currency.”
The deVere CEO concludes: “The poll underscores that the UK is no longer an attractive place for investors.
“The UK is now at a critical point – perhaps the most critical since the global crash. Many are simply not prepared to risk their wealth and are considering international options.”
About:
deVere Group is one of the world’s largest independent advisors of specialist global financial solutions to international, local mass affluent, and high-net-worth clients. It has a network of more than 70 offices across the world, over 80,000 clients and $12bn under advisement.
On Monday the 12th of August, trading on the EURUSD pair closed 15 pips up. Donald Trump is still the driving fundamental factor on the market. China is keeping the yuan below 7.00 to the dollar, while Trump is shaking the markets to its foundations with his remarks.
Following the pair’s drop to 1.1162, we got a recovery to 1.1231 on the back of a retreat towards the safe havens. The major US stock indices dropped by 1.5%, while US10Y bond yields also fell. Gold has hit a 6-year high, while the USDJPY pair has reached new lows.
Day’s news (GMT+3):
09:00 Germany: harmonised index of consumer prices (Jul).
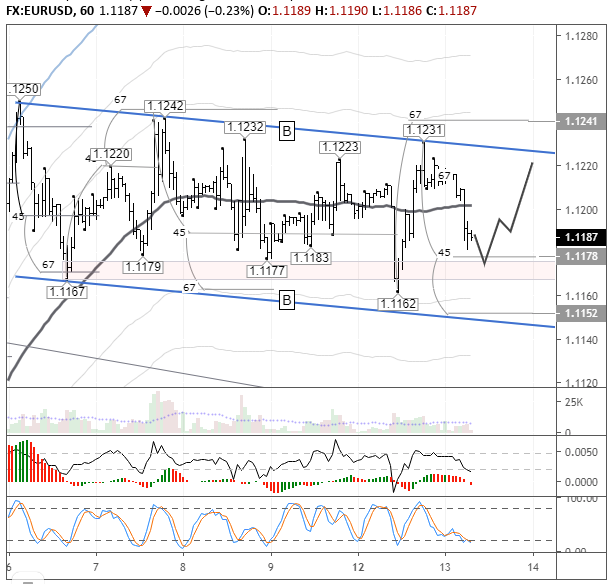
The 1.1167, 1.1179, and 1.1177 lows have been revisited. The bears have triggered the stop levels below here and must now wait for the 1.1231, 1.1242, and 1.1250 high to be revisited. The pair is trading below the balance line around the 45th degree. I’m expecting the 45th degree to be tested, followed by a bounce to the upper boundary of the channel at 1.1225.
Goldman Sachs analysts believe that the US and China won’t sign a trade deal before the 2020 election. They’ve also downgraded their growth forecast for the US in the third quarter.
Among the important news releases today are the employment report from the UK, and consumer inflation report from the US, which have a strong influence on the pound and dollar respectively.