A Potential CBD Processor with ‘Blue-Sky Prospects’

By The Life Science Report

Source: Peter Epstein for Streetwise Reports   08/20/2019

Peter Epstein of Epstein Research speaks with Martin Doane, CEO of Leviathan Cannabis Group, about the company’s international plans to grow hemp and produce a hemp-derived CBD isolate and what sets the company apart from its peers.

Cannabis and hemp related companies in North America have been beaten up pretty bad over the past several months, but the good companies should rebound. To the extent that this summer’s carnage is due to the CannTrust fiasco, I think that a buying opportunity in select oversold names may be at hand.

I’m tracking 300 cannabis, hemp and related companies. There are dozens that have zero or negligible revenue today, but that could do tens of millions of dollars in revenue next year. The trick, of course, is finding the ones that have a reasonable probability of making that giant leap.

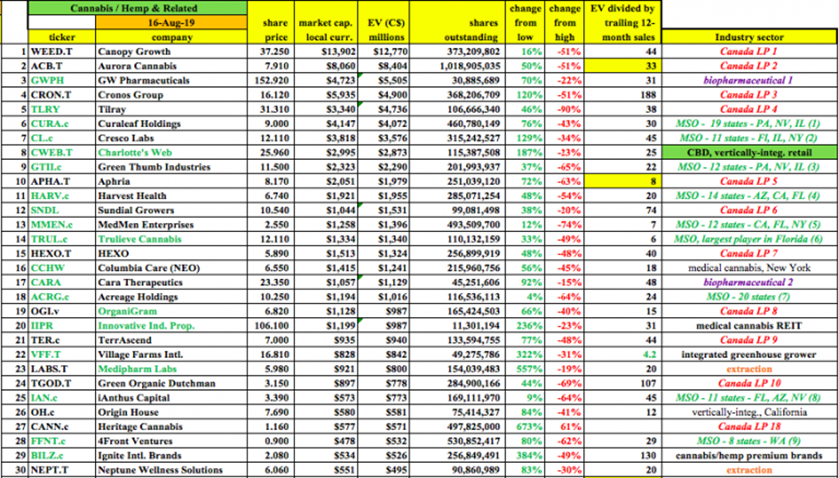
The companies that make it to the big leagues will be prime takeover targets next year by the top 50 players, 30 of which I show below. Notice there’s just one hemp/CBD focused name in the top 30, Charlotte’s Web.

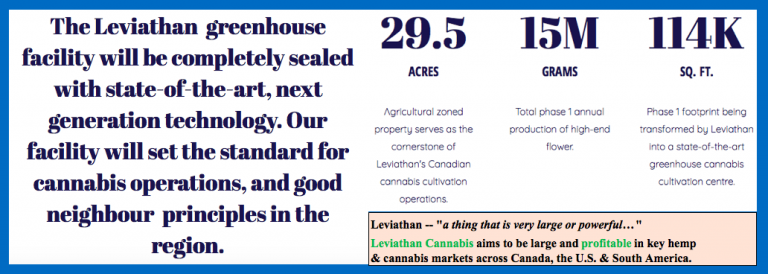
One company with great potential in this regard is Leviathan Cannabis Group Inc. (EPIC:CSE; LVCNF:OTC). I love the name and the ticker! More importantly, I love how it plans to make its mark in this ever evolving space, largely with a U.S. hemp cultivation and CBD extraction project.

If things go close to as planned, this 75%-owned venture alone could generate up to C$50 million in revenue in 2020, yet the company’s market cap is C$25 million (@26c/share on Aug. 19th). A surprising number of companies have blue-sky prospects like this. But, how many management teams will execute? How many can execute without significant equity dilution? Or, even with heavy dilution, how many can raise growth capital at all?

The following interview of Martin Doane, CEO of Leviathan Cannabis, was conducted by phone and email in the ten days ended August 18th.

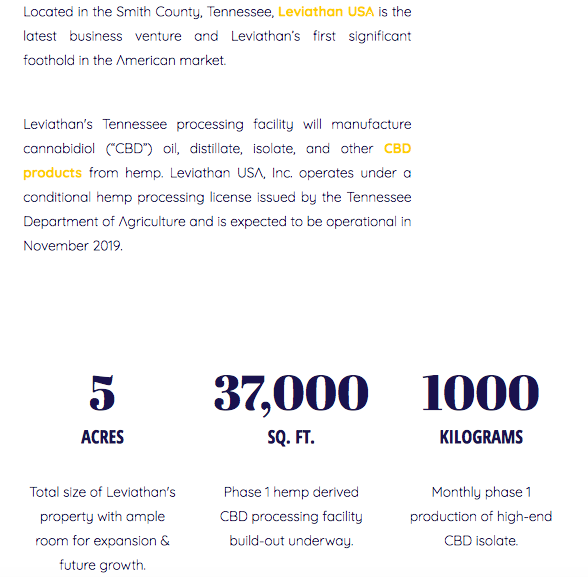
Peter Epstein: Leviathan plans to produce hemp-derived CBD isolate in Tennessee (USA), with potential revenue next year of up to C$50 million. Will you need to issue a large number of new shares?

Martin Doane: No. We will be funding Tennessee with as little equity as possible. For example, we are using equipment financing to acquire approximately US$1.5 million in new equipment. While we initially paid for our 5-acre property and building with cash, we expect to obtain a low-interest rate mortgage following completion of substantial improvements.

I should add, we are in the process of obtaining a number of grants from Tennessee entities available to us due to the economic stimulus we will bring to the state. Further, we believe that we can debt finance most, if not all, of our biomass requirements.

Finally, we have an incredibly supportive group of core investors, ready to provide debt or equity capital in the most optimal manner. We can tap that backstop resource if necessary.

Peter Epstein: Can you explain Leviathan’s Jekyll+Hyde Brand Builders Inc. segment?

Martin Doane: J+H is a hybrid enterprise within the Leviathan Cannabis Group (LCG). On one hand it serves external clients with branding and marketing expertise. On the other, it is a vital resource within LCG, adding value and exploiting the Group’s own assets. At present, probably 75% of J+H’s bandwidth is expended internally.

I don’t see that changing much over the next 6–12 months. However, next year we see J+H being a substantial revenue driver in its own right. Its margins are spectacular. Its client pipeline is significant. Its abilities are unique in the cannabis marketplace.

Peter Epstein: What is Woodstock Biomed Inc. (WBI), and why is the Town Council of Pelham, Ontario, trying to thwart you?

Martin Doane: WBI is our wholly owned subsidiary owning the property and business associated with a 30-acre property in Pelham, Ontario. We intend to build a significant cultivation and processing operation there. Earlier this year, we delivered full engineering plans and a building permit application to the Town Council.

But, the Town Council will not process the application pending expiry of the Interim Control By-law (ICBL) in mid-October. The ICBL can be renewed for up to a year. This was a “Black Swan” event, especially as the town had previously endorsed our application for a license to Health Canada.

The town’s reversal can only be explained by a vociferous anti-cannabis minority, who were able to put up this illegal (in our view) barrier to commerce. We continue to have dialogue with town officials who recommended to the Town Council that we be exempted from the application of this by-law.

However, even though attitudes appear to be shifting in Pelham, and new residents and staff are injecting healthy doses of logic, we can’t be sure that the ICBL will not be renewed. Accordingly, we are poised to commence litigation to strike down the ICBL and protect our interests.

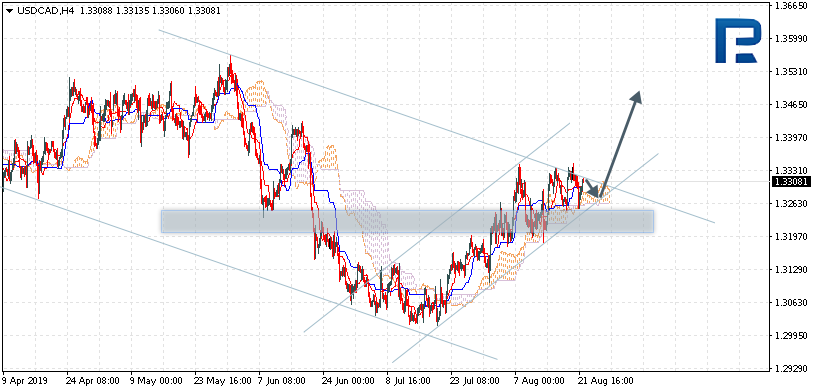
Peter Epstein: Does your team have a view on where high-quality cannabis flower prices in Canada are headed next year and in 2021?

Martin Doane: Canada, like the U.S., is bringing on substantial new capacity, but cultivators are having issues growing flower that passes regulatory requirements. Wholesale prices range from $3.5 to $8.0+ per gram. Retail prices range from $8.0 to $20.0 per gram. My sense is that prices will go down, but there will not be a “crash.”

Demand is increasing at a high rate, and demand for high-quality product is soaring as consumers become more educated and discriminating. Moreover, cultivators are learning how to grow more efficiently. Therefore, even though prices may decrease, margins should continue to improve.

Peter Epstein: How will Leviathan differentiate itself in a crowded field? THC content, pricing, branding?

Martin Doane: Quality and branding. We have a top-notch cultivation team, led by Dan Grady, that knows how to grow high-quality flower. We have a similarly excellent processing team that knows how to extract and manufacture high-quality hemp-derived CBD products. With the advantage of J+H, we believe our wholesale and retail branding is best in class, separating us from the herd.

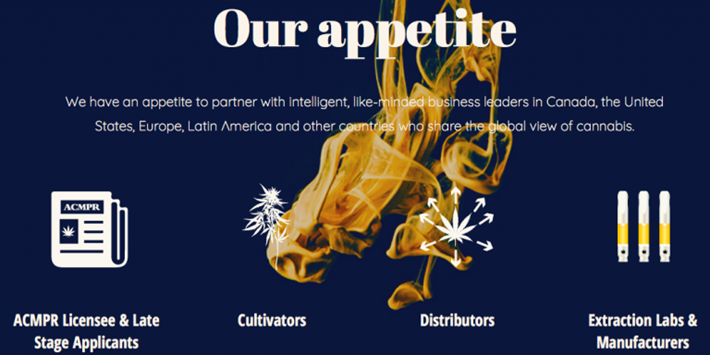
Peter Epstein: Due to low labor and electricity costs, Colombia, near the equator, is said to have the world’s cheapest cannabis production costs. Do you have any plans in Latin America?

Martin Doane: Yes, we like Colombia a lot as a cannabis jurisdiction. Our executive team recently traveled there to tour a number of acquisition opportunities. We think having operations in low-cost jurisdictions such as in South America makes a lot of sense, and we intend to implement that strategy this year.

Peter Epstein: How will your Canadian cultivation operations stack up on cost per gram produced?

Martin Doane: We hope to be around $1.00/gram once fully built out. That would place us among the lowest-cost producers in Canada.

Peter Epstein: What, if any, exporting strategy do you have?

Martin Doane: We are focusing on South America now. Once we complete an acquisition there later this year, we will turn our attention to Europe, where we have excellent relationships and a number of opportunities ripe for exploiting.

Peter Epstein: Investors in cannabis/hemp have well over 300 names to choose from. Why should readers consider buying shares of Leviathan Cannabis?

Martin Doane: Access to Capital: Leviathan Cannabis (EPIC.C) is uniquely positioned with a strong group of core shareholders who will fund our growth regardless of market conditions and who can act very quickly to capitalize on opportunities.

Deal Flow: We have a global network that pipelines non-shopped, one of a kind acquisition and JV opportunities. We don’t need to get into bidding wars, we can buy at the right time, at the right price, not an inflated one. We are seeing a number of interesting assets for sale at increasingly attractive valuations.

Low Market Cap: There is lots of scope to make money. Unlike many of the much larger cannabis companies, we are not “priced to perfection.”

Peter Epstein: Martin, thank you for your valuable time. Readers should know, this is a very hard man to get a hold of. He and his team are working tirelessly to move projects forward and achieve substantial revenue, and soon after, profitability. I look forward to continued updates on your progress.

Peter Epstein is the founder of Epstein Research. His background is in company and financial analysis. He holds an MBA degree in financial analysis from New York University’s Stern School of Business.

Sign up for our FREE newsletter at: www.streetwisereports.com/get-news

Disclosures: The content of this interview is for information only. Readers fully understand and agree that nothing contained herein, written by Peter Epstein of Epstein Research [ER], (together, [ER]) about Leviathan Cannabis, including but not limited to, commentary, opinions, views, assumptions, reported facts, calculations, etc. is not to be considered implicit or explicit investment advice. Nothing contained herein is a recommendation or solicitation to buy or sell any security. [ER] is not responsible under any circumstances for investment actions taken by the reader. [ER] has never been, and is not currently, a registered or licensed financial advisor or broker/dealer, investment advisor, stockbroker, trader, money manager, compliance or legal officer, and does not perform market making activities. [ER] is not directly employed by any company, group, organization, party or person. The shares of Leviathan Cannabis are highly speculative, not suitable for all investors. Readers understand and agree that investments in small cap stocks can result in a 100% loss of invested funds. It is assumed and agreed upon by readers that they will consult with their own licensed or registered financial advisors before making any investment decisions.

At the time this interview was published, Epstein Research [ER] was negotiating with Leviathan Cannabis with the goal of having Leviathan advertise on Epstein Research. [ER] owns no shares, warrants or options in any company mentioned. Readers should consider Epstein Research [ER] biased in favor of Leviathan Cannabis.

Readers understand and agree that they must conduct their own due diligence above and beyond reading this article. While the author believes he’s diligent in screening out companies that, for any reasons whatsoever, are unattractive investment opportunities, he cannot guarantee that his efforts will (or have been) successful. [ER] is not responsible for any perceived, or actual, errors including, but not limited to, commentary, opinions, views, assumptions, reported facts & financial calculations, or for the completeness of this article or future content. [ER] is not expected or required to subsequently follow or cover events & news, or write about any particular company or topic. [ER] is not an expert in any company, industry sector or investment topic.

Streetwise Reports Disclosure:
1) Peter Epstein’s disclosures are listed above.
2) The following companies mentioned in the article are billboard sponsors of Streetwise Reports: None. Click here for important disclosures about sponsor fees. The information provided above is for informational purposes only and is not a recommendation to buy or sell any security.
3) Statements and opinions expressed are the opinions of the author and not of Streetwise Reports or its officers. The author is wholly responsible for the validity of the statements. The author was not paid by Streetwise Reports for this article. Streetwise Reports was not paid by the author to publish or syndicate this article. Streetwise Reports requires contributing authors to disclose any shareholdings in, or economic relationships with, companies that they write about. Streetwise Reports relies upon the authors to accurately provide this information and Streetwise Reports has no means of verifying its accuracy.

4) The article does not constitute investment advice. Each reader is encouraged to consult with his or her individual financial professional and any action a reader takes as a result of information presented here is his or her own responsibility. By opening this page, each reader accepts and agrees to Streetwise Reports’ terms of use and full legal disclaimer. This article is not a solicitation for investment. Streetwise Reports does not render general or specific investment advice and the information on Streetwise Reports should not be considered a recommendation to buy or sell any security. Streetwise Reports does not endorse or recommend the business, products, services or securities of any company mentioned on Streetwise Reports.
5) From time to time, Streetwise Reports LLC and its directors, officers, employees or members of their families, as well as persons interviewed for articles and interviews on the site, may have a long or short position in securities mentioned. Directors, officers, employees or members of their immediate families are prohibited from making purchases and/or sales of those securities in the open market or otherwise from the time of the interview or the decision to write an article until three business days after the publication of the interview or article. The foregoing prohibition does not apply to articles that in substance only restate previously published company releases.

Graphics provided by the author.

( Companies Mentioned: EPIC:CSE; LVCNF:OTC,
)

A Summer Epiphany: Carpe Sanctum

By The Gold Report

Source: Michael Ballanger for Streetwise Reports   08/20/2019

Sector expert Michael Ballanger compares safe harbor on the water to safe harbor in the financial and precious metals markets.

“Destroyers seize gold and leave to its owners a counterfeit pile of paper.”– Ayn Rand

Twelve days ago, we were forced by gale force winds to seek safe harbor in the lovely northern Ontario town of Britt, located on the north shore of the Magnetawan River, approximately fifty miles south of Sudbury. As I was growing increasingly less patient with Mother Nature’s petulance, I found myself drawing an intuitive parallel between the good fortune in avoiding the ravages of the Georgian Bay rollers (big waves) and the pecuniary good fortune of having taken a very large physical and paper position in silver.

Riding out a dangerous and violent midsummer Great Lakes tempest in the sanctuary of Wright’s Marina alongside dozens of equally thankful-yet-exasperated mariners was analogous to watching your incompetent boss drive your new Porsche off a cliff: You are filled with mixed emotions, angry that your voyage has been delayed yet ecstatic that you are safe from harm.

Similarly, being overweight silver in today’s confused and catatonic financial world has been at once both a blessing and a damnation: Purchases at the lows in early July have been countermanded by the many earlier attempts, since December 2015, that had to be aborted due to the criminal interference and intervention covered countless times in this publication (and, invariably, to the point of launching quote monitors out the ninth-floor window in search of a bullion bank skull).

Since the tops in 2011, it has not been a pleasant voyage for those aboard the silver ship, but nothing quite as painful as the period of December 2015 until June 2019, as the precious metals nadir that I nailed on December 4, 2015 gave us a brief nine-month rally. Maddeningly, after August 2016, the bullion bank behemoths mercilessly punished all technical traders by selling all breakouts, flooding the Crimex with counterfeit paper “gold” and paper “silver.” I came out in late 2016 with the “Sell breakouts, buy breakdowns” strategy, which was precisely the correct chart to follow, gingerly avoiding the treacherous rocks and shoals of drawdowns as I successfully navigated around the perhaps $400 per gold ounce and $5 per silver ounce of systemic “shipwreck” brought about “regulatory undersight,” giving way to total bullion bank control. And all I could do was sit back and watch.

The landscape all changed in June, not so much by the advance through the six-year cap at $1,375 per ounce but more so by the content and quality of the advance. How many times have you read my thoughts on the importance of the prototypical sequence required by true precious metal bull markets? Silver outperforms gold; miners outperform physical; and junior miners outperform senior miners. As the chart below would suggest, we have a classic “phoenix-style” bull market, arising majestically from the ashes of neglect and criminal collusion to assume its well-deserved resplendence in its role the market leader for the balance of 2019.

The Invasive Species missive, penned just after we arrived into the Byng Inlet in full flight from the 50 kilometer per hour northwest gales, brought about a plethora of responses, the bulk of which were favorable, with the only dissenters being the staunchest of bulls in the precious metals arena. I advised the sale of 50% in the GDX and GDXJ positions exactly one week ago, and I did so, averaging over $42 (paid $30.13) for GDXJ and $29.60 (paid $21.11).

Despite the fact that they are marginally lower this week, the bulls were outraged by my decision to take profits on half-positions in the miners. The old adage that “one never goes broke by taking a profit” is offset by Jessie Livermore’s “the hardest thing to do in a bull market is to hold on,” but it is important for the outraged bulls to understand that the GYM portfolio remains 25% long physical gold, 25% long physical silver, 12.5% long GDX, 12.5% long GDXJ, and holds 25% cash. I am attempting to capture “alpha” by trading 25% of the portfolio into what has been a mind-blowing run from the lows in June—and also, I might add, from the start of the year, as shown in the chart below.

On a less-favorable note, the best performer of the bunch was the Gold Junior Miner ETF (GDXJ), which one might think would include more than a handful of the junior explorers. But investors are still reeling from the horror of the 2011–2015 bear market in gold, which resulted in catastrophic losses in the junior explorers. Gold corrected 45% from the 2011 highs, but many explorers, once darlings of the average speculator, are still down over 90% in some cases.

The best example of exactly why the GGMA portfolio kept the explorco exposure to a minimum is shown below. I cite, as an example from 2011, where ATAC Resources Ltd. (ATC:TSX.V) was heralded as the “next big Carlin-type deposit.” Some of the smartest investors in the world believed the hype as the control block wound up being sold to a billionaire investor at or near the top in 2011. This is a stark contrast to Great Bear Resources Ltd. (GBR:TSX.V; GTBDF:OTC) ($5.26) recommended at $2.30 in January, it is now the largest position in the GGMA portfolio.

I have chosen to discuss the junior explorcos only because of the relatively poor performance of the juniors within the GGMA portfolio, and that includes Getchell Gold Corp. (GTCH:CSE) (down 55% from the January purchase price at $0.18). The problem with exploration juniors here in 2019, versus 2009, is that the new generation of speculators have a) more (non-mining) to choose from; b) limited history of joy in discoveries; and c) no regard for precious metals.

Because of these reasons, if I invest in GTCH at $0.15 pre-drilling, I do not get the advantage of speculators moving the price higher in expectation of a lottery-style win. In the 1990s, stocks commanded $30 million market caps during the pre-discovery phase. That lasted until 1997, when Bre-X snuffed the lights out.

Again, in contrast, I recently added Aftermath Silver Ltd. (AAG:TSX.V) to the GGMA portfolio, to secure exposure to a physical silver resource for a company capped at under CA$3 million. When silver exploded higher in late July, AAG was able to catch a bid because they did not need to find a resource; they already had one.

Stakeholder Gold Corp. (SRC:TSX.V) was added in January at $0.05 per share, with gold under $1,300 per ounce, and there it remains with gold at $1,500. Why? It is because they have no precious metals resource and no active project to attract investor interest (but that is a topic for another time and day).

As I stated when I added Aftermath, the deals I will own going forward are the ones that have a resource to backstop exploration. From an investor’s viewpoint, it is preferable to be drilling to define a discovered ore body than to be trying to find a brand-new one. There may be less leverage in paying up for that resource, but until retail speculators begin to buy into exploration plays pre-discovery, I am better off waiting for that discovery and then buying, because I have deflected the risk away from reliance on those two unforgiving ladies of the exploration fates—Mother Nature and Lady Luck. Between Aftermath and Great Bear, the portfolio has over CA$50,000 in profits; the rest are down a cumulative CA$15,600. Two explorcos and one uranium/vanadium play (Western Uranium & Vanadium Corp. [WUC:CSE; WSTRF:OTCQX]) are underwater, with one gold discovery and one silver resource constituting the wins. As we move forward, I want to add to what is working and reduce what is not. (Note: I will have a missive out early next week specifically addressing the juniors, with special attention to GTCH and WUC.)

As we move forward though the second half of 2019, the goal is to continue to avoid the rocks, drastic drawdowns that have plagued most precious metals investors since 2016. Investing can be a wonderfully calm experience with flat seas and shining sun and just enough wind to keep us cool. But as I have found in my years as a mariner, “ideal conditions” on a body of water such as Georgian Bay can become “hazardous conditions” at the drop of a barometric hat. Just as a plummeting barometer warns of an impending change in conditions (usually for the worst), a rising barometer is the reverse.

For the precious metals, until the late 1980s and the advent of the Working Group on Capital Markets, precious metals were the singular best barometers (in reverse) of looming trouble on the economic or financial horizon. The shift we encountered in June has served to challenge the status quo, whereby prices are managed to facilitate an aura of calm, but since the bond market and the inversion of the yield curve represents a market that not even the powerful Fed can control, the metals now appear to be in the Fed’s rear-view mirror, instead of its crosshairs. Despite numerous albeit feeble attempts, the bullion banks have offered what I would brand as “futile attempts” to control prices, as if they are being distracted by a larger menace. Furthermore, since the bond market is many times larger in size than stocks, and since Forex is an equal amplitude larger than bonds, the central bankers have not only the tip of a tiny crag (gold) off their port bow to contend with, they also now have three Titanic-style icebergs and Cape Horn in their binoculars.

Finally, as a punctuative rationale to explain this change, the explosion in the amount of bonds paying a negative interest rate is not only an iceberg, it is a nuclear torpedo targeting the broad side of the global financial starboard bow.

Capital preservation is now the numero uno of objectives, and it is no surprise that just as running to an inland town called Britt vaporized any and all chance of quiet anchorages and serene relaxation, it also allowed us to let the tempest pass. Physical gold and silver are a “safe harbour” counterparty to nothing and no one. They have no nationality and no liens of any sort. Physical ownership and possession are akin to being “a lee of the wind,” and that is exactly where I will be in the days, weeks and months ahead.

Carpe Sanctum: Seize sanctuary.

Originally trained during the inflationary 1970s, Michael Ballanger is a graduate of Saint Louis University where he earned a Bachelor of Science in finance and a Bachelor of Art in marketing before completing post-graduate work at the Wharton School of Finance. With more than 30 years of experience as a junior mining and exploration specialist, as well as a solid background in corporate finance, Ballanger’s adherence to the concept of “Hard Assets” allows him to focus the practice on selecting opportunities in the global resource sector with emphasis on the precious metals exploration and development sector. Ballanger takes great pleasure in visiting mineral properties around the globe in the never-ending hunt for early-stage opportunities.

Sign up for our FREE newsletter at: www.streetwisereports.com/get-news

Disclosure:
1) Michael J. Ballanger: I, or members of my immediate household or family, own securities of the following companies mentioned in this article: Great Bear Resources, Aftermath Silver, Stakeholder Gold, Western Uranium & Vanadium, Getchell Gold. My company has a financial relationship with the following companies referred to in this article: Western Uranium & Vanadium, Getchell Gold. My firm no longer does consulting work for Stakeholder Gold. I determined which companies would be included in this article based on my research and understanding of the sector. Additional disclosures are below.
2) The following companies mentioned in this article are billboard sponsors of Streetwise Reports: Great Bear Resources. Click here for important disclosures about sponsor fees. As of the date of this article, an affiliate of Streetwise Reports has a consulting relationship with Western Uranium and Vanadium and Aftermath. Please click here for more information.
3) Statements and opinions expressed are the opinions of the author and not of Streetwise Reports or its officers. The author is wholly responsible for the validity of the statements. The author was not paid by Streetwise Reports for this article. Streetwise Reports was not paid by the author to publish or syndicate this article. Streetwise Reports requires contributing authors to disclose any shareholdings in, or economic relationships with, companies that they write about. Streetwise Reports relies upon the authors to accurately provide this information and Streetwise Reports has no means of verifying its accuracy.
4) This article does not constitute investment advice. Each reader is encouraged to consult with his or her individual financial professional and any action a reader takes as a result of information presented here is his or her own responsibility. By opening this page, each reader accepts and agrees to Streetwise Reports’ terms of use and full legal disclaimer. This article is not a solicitation for investment. Streetwise Reports does not render general or specific investment advice and the information on Streetwise Reports should not be considered a recommendation to buy or sell any security. Streetwise Reports does not endorse or recommend the business, products, services or securities of any company mentioned on Streetwise Reports.
5) From time to time, Streetwise Reports LLC and its directors, officers, employees or members of their families, as well as persons interviewed for articles and interviews on the site, may have a long or short position in securities mentioned. Directors, officers, employees or members of their immediate families are prohibited from making purchases and/or sales of those securities in the open market or otherwise from the time of the interview or the decision to write an article until three business days after the publication of the interview or article. The foregoing prohibition does not apply to articles that in substance only restate previously published company releases. As of the date of this article, officers and/or employees of Streetwise Reports LLC (including members of their household) own securities of Aftermath Silver, Stakeholder Gold, Western Uranium & Vanadium, Getchell Gold, companies mentioned in this article.

Charts provided by the author.

Michael Ballanger Disclaimer:
This letter makes no guarantee or warranty on the accuracy or completeness of the data provided. Nothing contained herein is intended or shall be deemed to be investment advice, implied or otherwise. This letter represents my views and replicates trades that I am making but nothing more than that. Always consult your registered advisor to assist you with your investments. I accept no liability for any loss arising from the use of the data contained on this letter. Options and junior mining stocks contain a high level of risk that may result in the loss of part or all invested capital and therefore are suitable for experienced and professional investors and traders only. One should be familiar with the risks involved in junior mining and options trading and we recommend consulting a financial adviser if you feel you do not understand the risks involved.

( Companies Mentioned: AAG:TSX.V,
ATC:TSX.V,
GTCH:CSE,
GBR:TSX.V; GTBDF:OTC,
SRC:TSX.V,
WUC:CSE; WSTRF:OTCQX,
)

Explorer Set to Drill on ‘Standout’ Target in the Golden Triangle

By The Gold Report

Source: Gwen Preston for Streetwise Reports   08/20/2019

Resource Maven Gwen Preston describes how leadership and a promising project in British Columbia translates to a compelling option for investors.

The thing about experience is it lets you see current situations in context—opportunities are more apparent when you’ve gone through the experience before.

Libero Copper Corp. (LBC:TSX.V:, LBCMF:OTCQB) was established in 2016 for exactly this reason. A group of geologists and mining executives looked at the nascent bull market through the lens of their past successes and decided to start accumulating copper projects.

The team started with two people: Leo Hathaway and Ian Slater. Both deserve some comment.

Hathaway was Ross Beaty’s main geologist in the Lumina Group. He vetted projects as Lumina built up its copper portfolio in 2004 and 2005, and he managed exploration on the assets they did acquire.

As the market strengthened, Lumina was “star burst” into six separate companies, each with one key project. Five got bought out in the last bull market; the fifth sold in 2014. Together these projects brought in $1.6 billion, generating a 20-for-1 return on capital for shareholders.

Lumina is the stuff of legend in the mining space. It’s incredibly rare for one company to attract $1.6 billion in buyouts. But the logic was straightforward:

  • Buy copper projects when no one cared about copper;
  • Ensure projects were free of fatal flaws, be it metallurgy or social issues or grade or infrastructure;
  • Focus on projects with known mineralization but also significant exploration potential;
  • Grow and de-risk each deposit as the market strengthened so that they stood out as advanced, clear opportunities when a strong market put mining companies on the hunt for acquisitions.

Ross Beaty gets most of the attention for Lumina’s incredible success but he certainly didn’t do it alone. Beaty certainly had the vision, but he relied on experts to enact the plan.

Hathaway was central in that expertise. He vetted each project that Lumina considered and bought. He helped craft each project deal. Once projects were in the Lumina fold, he ran the exploration programs and directed the de-risking, which ran from permitting and social license to water and roads.

Success on the Lumina scale is addictive. So I was not at all surprised when Leo told me that he was started a new Lumina-model company, for the next bull market.

Lots of people are trying this. Hathaway is way ahead of all of them because he has done it before.

But Hathaway couldn’t set up Lumina 2.0 on his own—he is a geologist, not a junior mining executive. He needed someone else to fill those shoes, which is where Ian Slater fits in.

Maven readers might recognize Slater’s name. . .and not for the best reason. Slater was the head of Red Eagle Mining, which stands as the worst investment I have made in the Maven portfolio. Red Eagle built an underground gold mine in Colombia, but insufficient engineering based on poor rock-type understanding meant the mine failed and Red Eagle went bankrupt.

Responsibility for that failure rests with Slater and the Red Eagle board of directors. Slater is an accountant by training. He knew he lacked the knowledge to build a mine so he built a team to get the job done. A few key members of that team overpromised and underdelivered.

Slater didn’t have the technical background to realize the errors in time. When he did, he tried hard to salvage the operation but leverage on the construction debt took Red Eagle down before he could make it work.

To be honest, when it happened I thought I would never back an Ian Slater deal again. Complete losses really burn. Yet here I am investing in Libero. What gives?

Two things. First, Libero is an explorer, not a developer. I would not back Slater again were he planning to build another mine, but that is not what he’s doing. He’s running a gold exploration company, which is a very different—and much easier—gig. I don’t mean to say that running a junior explore-co is easy, because it is not, but it is easier and far less technical than building a mine.

Second, I just said that running a junior explore-co is not easy. It takes a particular kind of person to do it successfully—and even despite the Red Eagle failure, Ian Slater is that kind of person.

Slater raised over $100 million during the bear market to build Red Eagle’s mine. He convinced investors to have faith in Colombia. He guided a social outreach program that generated true support for the mine within the local community. He never shied away from questions, even as bankruptcy drew near.

He has the tenacity, vision, salesmanship and network to led a junior, and it’s a combination of characteristics that’s hard to find. I think the Red Eagle effect will dog Libero to some extent, but as several friends reminded me as I thought through this situation, bull markets make investors forget past mistakes. In fact, most of mining’s most famous and successful executives have at least one failure on their resumes that gets forgotten amid the successes. So if Libero does hit into something exciting at Big Red, Slater’s failings will fade into the background.

Slater’s success raising capital for Libero to date shows that many have already decided to give him another chance. Libero has quietly raised money and acquired projects for several years now. The company also attracted some good people: Rob Pease, the geologist who founded and led Terrane Metals for years until it was acquired by Thompson Creek Metals Co. Inc., and who managed the process by which New Gold Inc. (NGD:TSX; NGD:NYSE.MKT) bought the Blackwater project for $550 million, is on the board. So is Jay Sujir, a well-known Vancouver mining lawyer.

Speaking of people, I should also note that Bill Bennett is on the board of directors. Bennett was the minister of mines in British Columbia for 16 years and offers truly unparalleled knowledge of government processes and First Nations relations.

Back to the story. Slater and Hathaway have been driving the Libero story forward for the last few years. Together the pair of them own 35% of the stock. B2Gold Corp. (BTG:NYSE; BTO:TSX; B2G:NSX) owns 15%, stock it acquired when Libero bought its Mocoa project. High-net-worth individuals from Slater and Hathaway’s networks hold a big chunk of the rest.

And some good new shareholders are coming in with the current financing. I can’t name names but some well-respected geologist executives put money into this raise because they’re excited about the opportunity at Big Red.

Big Red

Big Red is a large land package in BC’s Golden Triangle. Importantly, the project is road accessible: A paved road reaches within 18 kilometers (18 km) of the property and dirt roads extend onto the claim block.

The Golden Triangle hosts immense copper and gold, from deposits styles ranging from porphyry copper-gold to epithermal gold-silver and volcanogenic massive sulphide (VMS).

At Big Red there is evidence of all three kinds of mineralization, which suggests the presence of a large mineralizing system that has not been eroded.

Big Red is not a new target area. In fact, prospectors first noted evidence of gold and copper over 150 years ago. From the 1960s onward the ground saw scattered exploration but the project, as it stands today, was divided into a bunch of small properties. The combination of divided ownership and scattered work programs meant nothing exciting ever emerged.

The work did reveal some interesting results, though—enough that in 2014 a local geologist started working to consolidate the land. It took him four years but he eventually succeeded, establishing the Big Red project as we now know it.

Shortly thereafter Libero optioned the project from him. Libero’s first step was to understand what work had, indeed, already been done. The company tracked down 35 old assessment reports (files that project owners have to submit to the government outlining work completed) for each claim within the project and then digitized everything. They also flew a high-res magnetic and radiometric survey to add to the data.

Hathaway obviously liked what he saw at Big Red before seeing all the old data, but even he was impressed when the digitization and compilation effort wrapped up. Old data plus one airborne survey generated multiple porphyry copper-gold and epithermal gold-copper targets—in short, 50 years of exploration outlined a host of strong targets at Big Red but no one had pulled the data together until now.

I’ll take you through the targets briefly. First off, the project is centered around a clear magnetic high, as shown in warm colors below.

Mag highs can outline intrusions. The best places to find mineralization associated with such intrusions are around the edges. And that is exactly where Big Red offers gold- and copper-in-soil anomalies.

Copper Bowl is a large, strong copper anomaly, one where copper in soil grades better than 500 ppm across more than 3 square kilometers.

Ridge is the standout gold target. If you remember just one thing about Ridge, remember this: The soil anomaly covers more than a square kilometer and averages 1 g/t gold in soil. A good number of soil samples returned better than 5 g/t gold, especially in the southern part of the target area, and the target offered up dozens of rock samples carrying at least 1 g/t gold and up to 69 g/t gold.

Below is a zoom-in on the southern part of the soil anomaly. Pay attention to the legend: Purple denotes soils averaging better than 5 g/t, pink where they average 3 to 5 g/t, on down. Importantly, 5 g/t in soil is exceptional.

I can recall few soil anomalies that strong; the one that stands out is the soil anomaly above the high-grade discovery at GT Gold Corp.’s (GTT:TSX.V) Tatogga project.

Because of the similarity, Libero put its Ridge soil anomaly beside that from Tatogga, with both on the same scale.

The high-grade discovery at Tatogga sits underneath the lower soil anomaly; the huge porphyry discovery sits under the upper (northern) anomaly. The target at Big Red is very comparable, to both.

Ridge is the first target Libero will test at Big Red. Copper Bowl is the second. The map below shows magnetics and soil sample results. Note that most soil samples were taken along ridgelines, which means they have to represent in situ mineralization.

As at Ridge, the soil anomaly here is bigger—bigger, in fact—and strong, and sits on the margin of that big mag high.

There are never any guarantees with exploration, but these targets look good. It would be nice to have more soil samples as a way of refining drill targets, but Hathaway has decided he has enough information to start drilling.

And start they will: Drills will turn at Ridge in September. Results will be out within perhaps two months.

Copper Projects

I will not spend a lot of time on Libero’s two copper assets because focus is clearly on Big Red for the next while. That said, Mocoa and Tomichi offer enough copper and exploration potential to give Libero a valuation backstop.

Mocoa is in southern Colombia, near the Ecuador border. It’s a porphyry system that was initially discovered in 1973.

AngloGold Ashanti Ltd. (AU:NYSE; ANG:JSE; AGG:ASX; AGD:LSE) owned Mocoa for a time, as did B2 Gold. Historic work outlined 636 million inferred tonnes grading 0.33% copper and 0.04% molybdenum.

I know 0.33% copper doesn’t sound like a lot, but Libero is playing a game of scale with no fatal flaws. Mocoa already hosts 4.6 billion pounds of copper and is open for expansion, especially at depth, where grades increase. And 0.33% is a workable grade for an open pit mine if metallurgy and infrastructure are straightforward.

Tomichi is in Colorado, 50 km east of Gunnison. Colorado doesn’t stand out to most as a copper region but the state actually hosts several very good copper porphyries. Tomichi is already large, with 711 tonnes of inferred resource. The grade is a bit low, at 0.21% copper and 0.04% molybdenum, but again, we’re talking about easy metallurgy, access, and infrastructure, al in a region majors would be happy to operate.

The Wrap

Libero currently has 72 million shares outstanding. As I said earlier, Slater, Hathaway and B2 Gold own half of the count, while another quarter sit in tight friendly hands. So while the count isn’t small, it’s smaller than it looks.

The current financing will add another 30 million shares, roughly. These shares will not be available to trade until the four-month hold expires in December.

The Ridge target at Big Red is a big, strong soil-and-magnetics target in the popular and prolific Golden Triangle that has never before been drilled. Given that financing shares will not be trading and that the pre-financing count is tightly held, it’s likely the price will run in the near term as the market anticipates results.

To get articles like this sooner and with actionable investment ideas, subscribe to The Maven Letter.

With almost a decade of junior resource-focused journalism under her belt, Gwen Preston launched Resource Maven. Preston watches the wires, talks to her network and analyzes economics to identify resource news that matters and figure out how to profit. She focuses on early-stage exploration and development stories. Preston has been interviewed on CBC and in Financial Post.

Sign up for our FREE newsletter at: www.streetwisereports.com/get-news

Disclosure:
1) Gwen Preston: I, or members of my immediate household or family, own shares of the following companies mentioned in this article: Libero Copper. I personally am, or members of my immediate household or family are, paid by the following companies mentioned in this article: None. My company has a financial relationship with the following companies mentioned in this article: None. Resource Maven disclosures below. I determined which companies would be included in this article based on my research and understanding of the sector.
2) The following companies mentioned in this interview are billboard sponsors of Streetwise Reports: None. Click here for important disclosures about sponsor fees. As of the date of this article, an affiliate of Streetwise Reports has a consulting relationship with Libero Copper. Within the last six months, an affiliate of Streetwise Reports has disseminated information about the private placement of the following companies mentioned in this article: Libero Copper.
3) Statements and opinions expressed are the opinions of the author and not of Streetwise Reports or its officers. The author is wholly responsible for the validity of the statements. The author was not paid by Streetwise Reports for this article. Streetwise Reports was not paid by the author to publish or syndicate this article. The information provided above is for informational purposes only and is not a recommendation to buy or sell any security. Streetwise Reports requires contributing authors to disclose any shareholdings in, or economic relationships with, companies that they write about. Streetwise Reports relies upon the authors to accurately provide this information and Streetwise Reports has no means of verifying its accuracy.
4) The interview does not constitute investment advice. Each reader is encouraged to consult with his or her individual financial professional and any action a reader takes as a result of information presented here is his or her own responsibility. By opening this page, each reader accepts and agrees to Streetwise Reports’ terms of use and full legal disclaimer. This article is not a solicitation for investment. Streetwise Reports does not render general or specific investment advice and the information on Streetwise Reports should not be considered a recommendation to buy or sell any security. Streetwise Reports does not endorse or recommend the business, products, services or securities of any company mentioned on Streetwise Reports.
5) From time to time, Streetwise Reports LLC and its directors, officers, employees or members of their families, as well as persons interviewed for articles and interviews on the site, may have a long or short position in securities mentioned. Directors, officers, employees or members of their immediate families are prohibited from making purchases and/or sales of those securities in the open market or otherwise from the time of the interview or the decision to write an article, until one week after the publication of the interview or article. As of the date of this article, officers and/or employees of Streetwise Reports LLC (including members of their household) own securities of Libero Copper, a company mentioned in this article.

Resource Maven EDITORIAL POLICY AND COPYRIGHT: Companies are selected based solely on merit; fees are not paid. This document is protected by copyright laws and may not be reproduced in any form for other than personal use without prior written consent from the publisher.

Resource Maven DISCLAIMER: The information in this publication is not intended to be, nor shall constitute, an offer to sell or solicit any offer to buy any security. The information presented on this website is subject to change without notice, and neither Resource Maven (Maven) nor its affiliates assume any responsibility to update this information. Maven is not registered as a securities broker-dealer or an investment adviser in any jurisdiction. Additionally, it is not intended to be a complete description of the securities, markets, or developments referred to in the material. Maven cannot and does not assess, verify or guarantee the adequacy, accuracy or completeness of any information, the suitability or profitability of any particular investment, or the potential value of any investment or informational source. Additionally, Maven in no way warrants the solvency, financial condition, or investment advisability of any of the securities mentioned. Furthermore, Maven accepts no liability whatsoever for any direct or consequential loss arising from any use of our product, website, or other content. The reader bears responsibility for his/her own investment research and decisions and should seek the advice of a qualified investment advisor and investigate and fully understand any and all risks before investing. Information and statistical data contained in this website were obtained or derived from sources believed to be reliable. However, Maven does not represent that any such information, opinion or statistical data is accurate or complete and should not be relied upon as such. This publication may provide addresses of, or contain hyperlinks to, Internet websites. Maven has not reviewed the Internet website of any third party and takes no responsibility for the contents thereof. Each such address or hyperlink is provided solely for the convenience and information of this website’s users, and the content of linked third-party websites is not in any way incorporated into this website. Those who choose to access such third-party websites or follow such hyperlinks do so at their own risk. The publisher, owner, writer or their affiliates may own securities of or may have participated in the financings of some or all of the companies mentioned in this publication.

( Companies Mentioned: LBC:TSX.V:, LBCMF:OTCQB,
)

Indonesia cuts rate 2nd time, to keep easy policy mix

By CentralBankNews.info

Indonesia’s central bank lowered its benchmark interest rates for the second month in a row and going forward it said it would “maintain an accommodative policy mix in line with low inflation expectations, maintained external stability and the need to build economic growth momentum.”

Bank Indonesia (BI) cut its key benchmark BI 7-day reverse repo rate by another 25 basis points to 5.50 percent and has now cut it by 50 basis points this year following a similar cut in July.

BI also lowered the rate on its deposit and lending facilities by 25 points to 4.75 percent and 6.25 percent, respectively.

Although the rate cut surprised many analysts, BI in July signaled it was ready to lower rates further to boost economic growth, which slowed in the second quarter, as inflation expectations remained low.

The central bank said today the rate cut was consistent with inflation that is forecast to be below the midpoint of its inflation target, ensuring attractive returns on domestic financial assets and thus supporting external stability as well as a “pre-emptive measure to safeguard economic growth momentum going forward against the impact of global economic moderation.”

Last year BI raised its rates six times and by a total of 175 basis points during the U.S. Federal Reserve’s four rate hikes to shore up the exchange rate of the rupiah and ensure inflation didn’t rise.

This year Indonesia, along with other emerging market economies, is facing a slowing global economy that is suppressing commodity prices and its exports.

But despite the shift in global capital toward safer assets, such as government bonds in the U.S. and Japan as well as gold, the exchange rate of Indonesia’s rupiah is holding up well and is expected to remain stable, with BI attributing this to an inflow of foreign capital that is looking for attractive returns amid the impact of looser monetary policy in advanced economies.

“Ongoing trade tensions coupled with geopolitical risks are undermining world trade volume and global economic growth,” BI said, noting Indonesia’s economic growth slowed in the second quarter to 5.05 percent year-on-year from 5.07 percent due to the ongoing contraction in exports while stronger consumption and stable investment is still underpinning growth.

BI confirmed its forecast for 2019 economic growth to be below the midpoint of the 5.0 to 5.4 percent range and forecast 2020 growth in the middle of a 5.1 to 5.5 percent range.

Inflation in Indonesia remains low and stable, rising slightly to 3.32 percent in July from 3.28 percent in June and BI confirmed its forecast for inflation this year to be below the midpoint of its target corridor of 3.5 percent, plus/minus 1 percentage point.

For 2020 BI forecast inflation would be within its lower target range of 3.0 percent, plus/minus 1 percentage point.

After depreciating during the first 10 months of 2018, the rupiah bounced back from November through January and has been relatively stable since February. Today the rupiah was trading at 14,235   to the U.S. dollar, up 2.3 percent this year.

Last month the International Monetary Fund said Indonesia’s economy performed well last year despite the reversal of global capital flows, with economic growth this year and in 2020 seen remaining stable at 5.2 percent as credit growth of 12 percent is sustained and inflation remains within the target band while the current account deficit continues to narrow.

Bank Indonesia released the following statement:

“The BI Board of Governors agreed on 21st and 22nd August 2019 to lower the BI 7-day Reverse Repo Rate by 25 bps to 5,50%, Deposit Facility (DF) rates lowered 25 bps to 4,75% and Lending Facility (LF) rates lowered 25 bps to 6,25%. The policy is consistent with low inflation projected below the midpoint of the target corridor, attractive returns on domestic financial investment assets that support external stability, as well as a pre-emptive measure to safeguard economic growth momentum moving forward against the impact of global economic moderation. The monetary operations strategy remains oriented towards ensuring adequate liquidity and increasing money market efficiency, thus strengthening the transmission of accommodative monetary policy. Bank Indonesia will maintain an accommodative macroprudential policy stance in order to stimulate bank lending and expand economic financing, including green finance. Payment system policy and financial market deepening will also be strengthened in order to foster economic growth. Moving forward, Bank Indonesia will maintain an accommodative policy mix in line with low inflation expectations, maintained external stability and the need to build economic growth momentum. Furthermore, Bank Indonesia will continue to strengthen coordination with the Government and other relevant authorities in order to maintain economic stability and catalyse domestic demand, while boosting exports and tourism and attracting foreign capital inflows, including foreign direct investment (FDI).
Ongoing trade tensions coupled with geopolitical risks are undermining world trade volume and global economic growth.  A softening of growth is predicted in the United States as exports decline along with non-residential investment. Flatter economic growth in Europe, Japan, China and India is the result of restrained external sector performance and dwindling domestic demand. Global economic moderation continues to suppress commodity prices, including the global oil price. In response, several countries have introduced fiscal stimuli and loosened monetary policy, including the US Federal Reserve that decided to lower its policy rate in July 2019. In addition, global financial market uncertainty remains, which has precipitated a shift in global funds to safer assets, such as government bonds in the United States and Japan, as well as gold. Prevailing global economic dynamics must be considered when striving to spur economic growth and maintain foreign capital inflows to support external stability.
The policy mix instituted by Bank Indonesia and the Government has effectively maintained economic growth momentum at home.  In the second quarter of 2019, national economic growth stood at 5.05% (yoy), retreating slightly from 5.07% (yoy) in the previous period due to the ongoing export contraction. Meanwhile, stronger consumption and stable investment prompted an uptick of domestic demand, which is underpinning national economic growth. Spatially, the key drivers of national economic growth are the regions of Sumatra, Kalimantan as well as Bali and Nusa Tenggara, coupled with economic stability in Java. Moving forward, Bank Indonesia projects solid economic growth on the back of domestic demand, high investment growth in particular. National economic growth momentum is supported by an accommodative policy mix implemented by Bank Indonesia combined with fiscal policy and structural reforms introduced by the Government. For the year, economic growth in 2019 is projected below the midpoint of the 5.0-5.4% range before increasing towards the middle of the 5.1-5.5% range in 2020.
Indonesia’s Balance of Payments demonstrated how Indonesia is maintaining external resilience despite strong global headwinds and seasonal trends at home.  Sound BOP performance in the second quarter of 2019 was supported by a capital and financial account surplus totalling USD7.1 billion in line with the positive domestic economic outlook and attractiveness of domestic investment instruments. Meanwhile, the current account deficit increased from USD7.0 billion (2.6% of GDP) in the first quarter of 2019 to USD8.4 billion (3.0% of GDP) in the reporting period, exacerbated by seasonal trends to repatriate dividends and service interest payments on external debt, along with the impact of lower world trade volume and international commodity prices. Consequently, the BOP recorded a USD0.4 billion surplus in the first semester of 2019 despite amassing a USD2.0 billion deficit in the second quarter of 2019. Moving forward, Bank Indonesia expects to maintain external resilience, backed by a capital and financial account surplus together with a manageable current account deficit, which is projected in 2019 and 2020 with in the 2.5–3.0% of GDP range. The position of reserve assets in Indonesia remains solid, recorded at USD125.9 billion at the end of July 2019, equivalent to 7.3 months of imports or 7.0 months of imports and servicing government external debt, which is well above the international adequacy standard of around three months. Moving forward, Bank Indonesia will continue to strengthen policy synergy with the Government and other relevant authorities in order to bolster external resilience, including efforts to attract foreign direct investment (FDI).
The rupiah continues to move in line with the currency’s fundamental value, thereby reinforcing external resilience.  Point-to-point, the rupiah gained 0.8% in July 2019 compared with the level recorded at the end of June 2019, and by 1.3% compared with the June average in 2019. The stronger rupiah was supported by an influx of foreign capital inflows based on the positive perception of non-resident investors regarding the national economic outlook as well as the attractiveness of domestic financial assets. Mirroring global currency movements, the rupiah depreciated in August 2019, weighed down by global financial market uncertainty as trade tensions between the United States and China escalated, triggering 1.6% (ptp) depreciation or 1.4% on the July average in 2019. As of 21st August 2019, the rupiah appreciated 0.98% (ptp) compared with conditions at the end of 2018. Moving forward, Bank Indonesia expects stable rupiah exchange rates in line with maintained market mechanisms. Furthermore, projected currency stability is supported by the prospect of foreign capital inflows to Indonesia on sound domestic economic performance and attractive returns, as well as the favourable impact of looser monetary policy in advanced economies. To support exchange rate policy effectiveness and strengthen domestic financing, Bank Indonesia will continue to accelerate financial market deepening efforts, targeting the money market and foreign exchange market in particular.
Low and stable inflation has been maintained.  Consumer Price Index (CPI) inflation in July 2019 stood at 0.31% (mtm), falling from 0.55% (mtm) the month earlier. Annually, headline inflation in July 2019 was recorded at 3.32% (yoy), up slightly from 3.28% (yoy) in the previous period. Furthermore, core inflation was also kept under control due to anchored inflation expectations in line with policy consistency by Bank Indonesia to maintain price stability, manage aggregate demand and minimise the impact of global prices. Administered prices recorded deflation in the reporting period as a result of the ongoing impact of readjustments to airfares and corrections to intercity and railway fares after the Eid-ul-Fitr festive season. Meanwhile, inflation of volatile foods has slowed, although the prices of various horticultural commodities continue to demand attention. Bank Indonesia will continue to consistently maintain price stability and strength policy coordination with the central and regional governments to ensure low and stable inflation despite potential weather disruptions due to a protracted dry season that could undermine the supply of foodstuffs. Bank Indonesia projects inflation in 2019 below the midpoint of the 3.5%±1% target corridor and within the target range for 2020, namely 3.0%±1%.
A stable and efficient money market has been maintained, thus supporting monetary policy transmission.  Adequate liquidity was maintained in the interbank money market, as reflected by a high average daily transaction volume totalling Rp18.96 trillion, which helped to sustain low overnight interbank rate volatility. The banking industry also effectively maintained adequate liquidity in the banking system, as confirmed by a ratio of liquid assets to deposits of 19.1% in June 2019, up from 18.5% in May 2019. The overnight interbank rate, as the operational target of monetary policy, maintained convergence with the policy rate, which was set at 5.75% in July 2019. Furthermore, a conducive interbank money market supports effective monetary policy transmission. The weighted average deposit rate was recorded at 6.66% in July 2019, falling 3 basis points on the level posted the month earlier. In addition, the banks have begun to lower lending rates on all credit lines. The returns on government and corporate bonds fell 13 basis points and 15 basis points respectively in July 2019. Moving forward, Bank Indonesia will continue to ensure adequate liquidity and increase efficiency in the money market, while strengthening the transmission of accommodative monetary policy.
Financial system stability has been maintained, accompanied by contained credit risk and a solid intermediation function.  Bank resilience was confirmed by a high Capital Adequacy Ratio (CAR) of 22.5% in June 2019, coupled with a low level of non-performing loans at 2.5% (gross) or 1.2% (nett). Meanwhile, the bank intermediation function remains positive despite credit growth decelerating from 11.1% (yoy) in May 2019 to 9.9% (yoy) in June 2019. In contrast, deposit growth accelerated to 7.4% (yoy) in June 2019 from 6.7% (yoy) the month earlier. Financial system stability was also supported by the sound performance of public listed corporations, buoyed by maintained repayment capacity. Moving forward, Bank Indonesia expects sufficient space to maintain an accommodative macroprudential policy stance in order to stimulate credit growth without disrupting financial system stability. Bank Indonesia projects growth of outstanding loans disbursed by the banking industry in the 10-12% (yoy) range in 2019 and 11–13% (yoy) in 2020, with deposit growth predicted at around 7-9% (yoy) in 2019 and 8–10% (yoy) in 2020.
The payment systems, both cash and non-cash, remain uninterrupted.  The position of currency in circulation grew 5.9% (yoy) in July 2019, while non-cash payments using ATM/debit cards, credit cards and electronic money increased 10.5% (yoy) in the second quarter of 2019, dominated by ATM/debit card instruments with a 97.0% share. Electronic money continues to enjoy precipitous growth, reaching 241.2% (yoy) in the reporting period, further confirming the public’s growing preference towards digital currencies. Bank Indonesia constantly strives to expand the payment system’s role in supporting economic growth, including actively backing the transformation towards a digital economy and finance. Moreover, the current electronification program has been strengthened by coordination across authorities in terms of social aid program (bansos) disbursements, local government financial transactions and integrated transportation modes. Bank Indonesia also supports the transformation of micro, small and medium enterprises (MSME) towards digital payment platforms in terms of payments, finance and trade. QR Code Indonesian Standard (QRIS) implementation, which was launched on 17th August 2019, will be accelerated in order to garner broader public acceptance when using digital payment services. Furthermore, digital innovation will also be strengthened through sandbox revitalisation at Bank Indonesia towards an innovation lab, as well as industry and regulatory sandboxes.”


Hong Kong Stock Market Analysis: HK50 technical setup turns bullish

By IFCMarkets

HK50 technical setup turns bullish

Hong Kong inflation remained steady in July while unemployment ticked up. Will the HK50 advance continue?

Hong Kong economic data have been weak on balance recently: unemployment ticked up to 2.9% in July from 2.8%, the Q2 GDP contraction was revised downward to 0.4% decline from 0.3% of advance reading. However foreign exchange reserves rose while inflation remained steady at 3.3% when a decline to 2.8% was forecast. All these data were recorded against the background of contraction in the private sector activities as evidenced by decline in Markit’s PMI to 43.8 from 47.9 in June: readings above 50.0 indicate sector expansion, and contraction below. Deteriorated US-China trade relations are main reason for slowing of activities. However technical indicators point to upside momentum for Hong Kong stock market. And unresolved US-China trade dispute remains a downside risk for Hong Kong stock market.

HK50 retracing toward MA(200) 08/22/2019 Technical Analysis IFC Markets chart

On the daily timeframe HK50: D1 is retracing higher after hitting 10-month low, still below the 200-day moving average MA(200), which is level.

  • The Parabolic indicator has formed a buy signal.
  • The Donchian channel indicates no trend yet: it is flat.
  • The MACD indicator is below the signal line with the gap narrowing. This is a bullish signal.
  • The RSI oscillator has not reached the overbought zone and has formed a bullish divergence.

We believe the bullish momentum will continue after the price breaches above the upper Donchian boundary at 26401.10. This level can be used as an entry point for placing a pending order to buy. The stop loss can be placed below the lower fractal at 24850.00. After placing the pending order the stop loss is to be moved every day to the next fractal low, following Parabolic signals. Thus, we are changing the expected profit/loss ratio to the breakeven point. If the price meets the stop-loss level (24850.00) without reaching the order (26401.10) we recommend cancelling the order: the market sustains internal changes which were not taken into account.

Technical Analysis Summary

OrderBuy
Buy StopAbove 26401.10
Stop lossBelow 24850.00

Market Analysis provided by IFCMarkets

Zambia holds rate but may hike if inflation remains high

By CentralBankNews.info
Zambia’s central bank left its policy rate steady at 10.25 percent, saying inflation is still expected to remain above the upper bound of its target range for much of the forecast horizon but then revert to the range toward the end this period amid a weakening of near-term growth prospects.
However, the Bank of Zambia (BOZ), which raised its rate 50 basis points in May as inflation was forecast to remain above its target range of 6.0 – 8.0 percent, cautioned it “may adjust the Policy Rate upward, if inflation does not revert to the target range.”
In addition to recent data that points toward reduced economic growth, BOZ said liquidity challenges and constrained aggregate demand continue to weigh on economic activity, with gross domestic product projected to decline this year due to the effects of drought on agriculture, constrained electricity generation and lower than anticipated output from mining.
BOZ didn’t issue a growth forecast but last month the International Monetary Fund said Zambia’s growth was projected to slow to 2.0 percent this year from an estimated 3.7 percent last year, reflecting a decline in mining activity and the impact on drought on hydro power production.
BOZ said preliminary data show economic growth easing to 2.6 percent in the first quarter of this year from 2.7 percent in the same 2018 quarter, with data pointing to reduced growth in the second quarter.
Zambia’s inflation rate has accelerated this year due to a depreciation of the kwacha and higher food prices, pushing up inflation from an average 7.0 percent in 2018 to to 8.8 percent in July.
BOZ expects inflation to remain above its 8.0 percent inflation limit for much of the forecast period due to a persistent rise in food prices from low agricultural output. But easing pressure on food prices is then expected to lower inflation toward the end of the forecast period.
Key upside risks to this outlook stem from persistent drought, lower electricity generation, higher-than-expected fiscal deficits and elevated debt service payments, which is likely to impact inflation through the exchange rate and expectation channels.
In addition, BOZ said weaker-than-projected global growth, partly due to an escalation of trade tensions between the US and China, is likely to impact copper prices, which may also affect the kwacha’s exchange rate.
After falling 15.6 percent against the U.S. dollar last year, the kwacha has continued to weaken this year and was trading at 13.12 to the dollar today, down almost 9 percent this year.
The IMF in July forecast inflation would average 9.9 percent this year and 10.0 percent in 2020.

www.CentralBankNews.info


Ichimoku Cloud Analysis 22.08.2019 (AUDUSD, NZDUSD, USDCAD)

Article By RoboForex.com

AUDUSD, “Australian Dollar vs US Dollar”

AUDUSD is trading at 0.6766; the instrument is moving inside Ichimoku Cloud, thus indicating a sideways tendency. The markets could indicate that the price may test the cloud’s upside border at 0.6775 and then resume moving downwards to reach 0.6635. Another signal to confirm further descending movement is the price’s rebounding from the descending channel’s upside border. However, the scenario that implies further decline may be canceled if the price breaks the cloud’s upside border and fixes above 0.6825. In this case, the pair may continue growing towards 0.6905. After breaking Triangle’s downside border and fixing below 0.6720, the price may continue moving downwards.

AUDUSD
Risk Warning: the result of previous trading operations do not guarantee the same results in the future

NZDUSD, “New Zealand Dollar vs US Dollar”

NZDUSD is trading at 0.6381; the instrument is moving below Ichimoku Cloud, thus indicating a descending tendency. The markets could indicate that the price may test the cloud’s downside border at 0.6405 and then resume moving downwards to reach 0.6275. Another signal to confirm further descending movement is the price’s rebounding from the resistance level. However, the scenario that implies further decline may be canceled if the price breaks the cloud’s upside border and fixes above 0.6490. In this case, the pair may continue growing towards 0.6595.

NZDUSD
Risk Warning: the result of previous trading operations do not guarantee the same results in the future

USDCAD, “US Dollar vs Canadian Dollar”

USDCAD is trading at 1.3308; the instrument is moving above Ichimoku Cloud, thus indicating an ascending tendency. The markets could indicate that the price may test the cloud’s upside border at 1.3270 and then resume moving upwards to reach 1.3475. Another signal to confirm further ascending movement is the price’s rebounding from the support level. However, the scenario that implies further growth may be canceled if the price breaks the cloud’s downside border and fixes below 1.3255. In this case, the pair may continue falling towards 1.3165. After breaking the descending channel’s upside border and fixing above 1.3345, the price may continue moving upwards.

USDCAD
Risk Warning: the result of previous trading operations do not guarantee the same results in the future

Article By RoboForex.com

Attention!
Forecasts presented in this section only reflect the author’s private opinion and should not be considered as guidance for trading. RoboForex LP bears no responsibility for trading results based on trading recommendations described in these analytical reviews.

FOMC Minutes Lift USD

By Orbex

USD Firmer Following FOMC Minutes

The US dollar has been a little firmer over the European morning on Thursday following the FOMC minutes yesterday. The minutes revealed little in the way of new information, though did show that “most” members agree that the July rate cut was a mid-cycle adjustment. Consequently, pricing for a September rate cut has reduced, leading USD higher. USD index trades 98.20 last, just off the week’s 98.34 highs.

EUR Under Pressure

EURUSD has come back under pressure today in light of the USD rebound. Data weakness in the eurozone, as well as uncertainty linked to global trade and Brexit, is keeping EUR pressured. The market is widely expecting the ECB to announce fresh easing in September. EURUSD trades 1.1080 last with price remaining capped 1.1112

GBP Remains Muted

GBPUSD remains stagnant in the block of consolidation which has formed just above the 1.20 2017 lows. Growing fears of a no-deal Brexit are keeping GBP sentiment weighted to the downside despite a continued spate of positive data. GBPUSD trades 1.2128 last with the near term bias remaining bearish.

Equities Come off

Risk assets have come back under pressure today following a solid recovery yesterday. The resurgence in USD following yesterday’s FOMC minutes has capped the upside in equities for now. SPX500 trades 2921.28. While above the 2908.55 level, focus remaining on a further grind to the upside.

JPY Rallies While Gold Falls

Safe havens have had a mixed day so far with gold down against USD, while JPY trades higher. The pullback in equities has seen safe-haven flows into JPY. On the other hand, Gold has come under pressure due to the FOMC minutes which were less dovish than expected. USDJPY trades 106.38 last with price remaining tightly wound in a block of consolidation below the 106.77 level.  XAUUSD trades 1497.73 last as the rejection from the 1522.75 level continues. While above the 1433.58 level, the focus remains on further upside.

Crude Rallies On Inventories Draw

Oil prices have been a little firmer today on the back of yesterday’s EIA report which showed a second consecutive weekly drawdown in US crude stores. The report also showed that US crude stores at the Cushing site in Oklahoma were down for a seventh consecutive week. However, upside in oil has been tempered somewhat as the report also showed US crude production surging back up to just below all-time highs. Crude trades 55.90 last, with price challenging the bearish trend line from July highs yet again.

CAD Up, AUD Down

USDCAD has come back under pressure today, despite a higher USD, as resurgent oil prices have helped boost CAD. CAD has also been boosted by better than expected CPI for July, released yesterday, which came in at 2% vs 1.7% expected. USDCAD trades 1.3289 last, with price sitting back below the 1.33 level.

AUDUSD has traded lower today. A combination of a firmer USD and lower gold prices has weighed on the Aussie. AUDUSD trades .6763 last with price fighting to stay above the .6758 level for now, though remaining vulnerable to a break lower.

By Orbex


Murrey Math Lines 22.08.2019 (USDCHF, GOLD)

Article By RoboForex.com

USDCHF, “US Dollar vs Swiss Franc”

As we can see in the H4 chart, USDCHF is no longer moving inside the “oversold area”. In this case, the pair may break 2/8 and continue growing towards the resistance at 3/8. However, this scenario may no longer be valid if the price rebounds from 2/8. After that, the instrument may continue falling towards the support at -1/8.

USDCHF_H4
Risk Warning: the result of previous trading operations do not guarantee the same results in the future

In the M15 chart, the pair may break the downside line of the VoltyChannel indicator and, as a result, continue moving downwards.

USDCHF_M15
Risk Warning: the result of previous trading operations do not guarantee the same results in the future

XAUUSD, “Gold vs US Dollar”

As we can see in the H4 chart, XAUUSD is still trading inside the “overbought area”. In this case, the price is expected to break 8/8 and then resume falling to reach the support at 6/8. However, this scenario may no longer be valid if the price breaks +1/8. After that, the instrument may continue growing towards the resistance at +2/8.

GOLD_H4
Risk Warning: the result of previous trading operations do not guarantee the same results in the future

In the M15 chart, the pair may break the downside line of the VoltyChannel indicator and, as a result, continue moving downwards to reach 6/8 from the H4 chart.

GOLD_M15

Article By RoboForex.com

Attention!
Forecasts presented in this section only reflect the author’s private opinion and should not be considered as guidance for trading. RoboForex LP bears no responsibility for trading results based on trading recommendations described in these analytical reviews.

Crude Rallies On Inventories Draw

By Orbex

Its been another frustrating week for crude traders given the initial rally in the market, and subsequent retracement lower.

Oil was boosted mid-week by the latest industry reporting which showed an unexpected drawdown in US crude stocks. The Energy Information Administration’s report, covering the week ending August 16th, showed US crude stores falling by 2.7 million barrels. This was greater than the 1.9 million barrel draw the market was looking for. It also marks the second consecutive week of declines in US crude stores.

Notably, the report showed that crude levels at the Cushing delivery hub in Oklahoma fell for a seventh consecutive week. They declined by 2.5 million barrels and now sit at 42.3 million barrels. This is their lowest level since February. The declines here have been attributed to the starting of the pipelines from the Permian region which mean that a reduced number of barrels now go to Cushing.

Gasoline Stores Rose

Despite the drawdown in crude stores, the report showed that gasoline inventories were higher over the week. Gasoline inventories rose by 312k barrels, a greater jump than the 169k barrel gain forecast.

Meanwhile, distillate stockpiles were also higher. Distillates, which include diesel and heating oil, rose by a solid 2.6 million barrels. This was far greater than the 314k barrel increase forecast.

The EIA also reflected a decline in net US crude imports, which fell by 616k barrels per day.

Meanwhile, US crude production remained steady at 12.3 million barrels, just 100k barrels below all-time highs.

Refinery crude runs were up by 400k over the week. Refinery utilization rates rose by 1.1% to 95.9% of total capacity.

Risk Appetite Supporting Oil

Crude prices have also been boosted over the week by the general improvement in risk appetite.Equities prices have recovered this week, following sharp losses last week. This is because the market is striking a more optimistic tone over the outlook for US/China trade negotiations.

The two sides are scheduled to meet for a further round of talks in September. The markets are welcoming the absence of negative headlines, showing that tensions have eased, for now.

Earlier in the week, Trump declared that although he is not yet ready to make a deal with China, talks are progressing well. The potential for a trade deal is helping keep crude prices bid, given that China is the largest global consumer of oil.

The demand outlook for oil ties in heavily to expectations for the Chinese economy. As such, plenty of two-way risks remain around the ongoing trade story as any breakdown in talks would be heavily bearish for crude.

Technical Perspective

Following a brief move above the bearish trend line from July highs, crude is now back below the trendline. However, today, it is fighting to stay above the 55.81 level. While above here, focus is on a further grind higher towards the 58.01 level net. There, we also have the bearish trend line from year to date highs offering resistance. To the downside, 50.67 remains the key market to watch.

By Orbex