SP500 slips while Dow gains after weak manufacturing data
US stock indexes ended mixed on Thursday after weak manufacturing data as longer term bond yields dipped below short term debt yields, spurring recession fears. The S&P 500 slipped 0.05% to 2922.95. The Dow Jones industrial average rose 0.2% to 26252.24 buoyed by 4.2% gain in Boeing. Nasdaq composite index slid 0.4% to 7991.38. The dollar strengthening halted as Markit’s Manufacturing PMI index declined to 49.9 in August from 50.4 in July, signaling contraction in factory activity: the live dollar index data show the ICE US Dollar index, a measure of the dollar’s strength against a basket of six rival currencies, slipped 0.1% to 98.19 but is higher currently. Investors await Fed chair Powell’s speech at central bankers symposium in Jackson Hole, after Kansas City Fed President Esther George and Philadelphia Fed President Patrick Harker said they would like to hold interest rates steady. Stock index futures point to higher market openings today.
FTSE 100 paces European indexes retreat
European stocks pulled back on Thursday after Treasurys yield curve inverted once again, the third inversion in less than two weeks. EUR/USD continued declining while GBP/USD turned higher yesterday with both pairs moving lower currently. The Stoxx Europe 600 index ended 0.5% lower. Germany’s DAX 30 slipped 0.5% to 11747.04. France’s CAC 40 slid 0.9% and UK’s FTSE 100 fell 1.1% to 7128.18.
Shanghai Composite leads Asian indexes gains
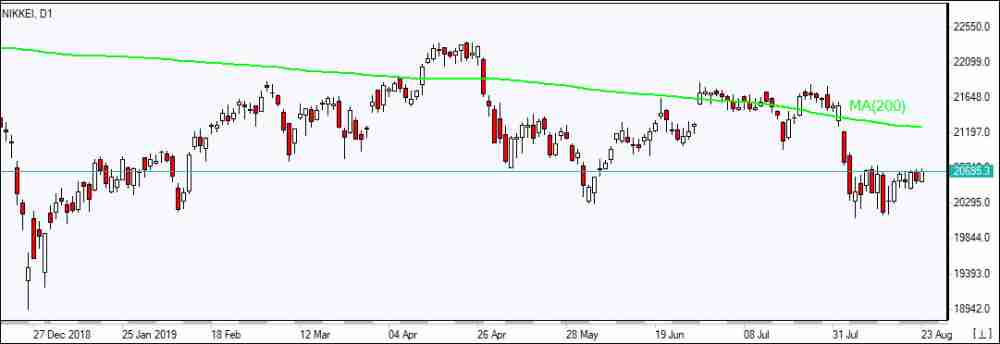
Asian stock indices are mostly higher today as China’s onshore yuan hit its weakest level since 2008. Nikkei extended gains 0.4% to 20710.91 as yen’s slide against the dollar resumed. Chinese shares are rising: the Shanghai Composite Index is up 0.5% and Hong Kong’s Hang Seng Index is 0.4% higher. Australia’s All Ordinaries Index added another 0.3% to previous session gains as Australian dollar slowed its slide against the greenback.
Note: This overview has an informative and tutorial character and is published for free. All the data, included in the overview, are received from public sources, recognized as more or less reliable. Moreover, there is no guarantee that the indicated information is full and precise. Overviews are not updated. The whole information in each overview, including opinion, indicators, charts and anything else, is provided only for familiarization purposes and is not financial advice or а recommendation. The whole text and its any part, as well as the charts cannot be considered as an offer to make a deal with any asset. IFC Markets and its employees under any circumstances are not liable for any action taken by someone else during or after reading the overview.
The investment thesis on this Canadian company is delivered in a BMO Capital Markets report.
Analyst Ryan Thompson wrote in an Aug. 13 research note that his firm BMO Capital Markets initiated coverage on Leagold Mining Corp. (LMC:TSX.V; LMCNF:OTCQX) with an Outperform rating and a CA$4 per share target price. With The company is currently trading at around CA$2.34 per share.
“Our Outperform rating is underpinned by Leagold’s attractive relative valuation and peer-leading per share growth profile,” he added.
Thompson expanded on those key points.
The gold miner is about to kick off its aggressive growth plan with the phased expansion of the Los Filos mine in Mexico. There, the company will develop the Bermejal underground mine starting in Q3/19 then launch the Guadalupe open pit in Q4/19 and lastly, build a carbon-in-leach plant, beginning in mid-2020, to accommodate bigger recoveries.
Once Los Filos is completed, Leagold will turn its attention, likely in early 2021, to restarting the Santa Luz mine in Brazil. That will require about 10 months of construction first.
The producer has the capital to carry it all out due to the $400 million financing package it secured earlier this year.
Further, Leagold has a management team that, with its experience and impressive history, could make it all happen. CEO Neil Woodyer, for instance, developed Endeavour Mining into one of the largest gold producers in West Africa.
Thompson highlighted that Leagold is currently attractively valued considering it is about to “deliver more than 650,000 ounces of gold production by 2021.” Recent share price weakness created “a buying opportunity for investors with a longer-term view on the growth potential.”
Disclosure: 1) Doresa Banning compiled this article for Streetwise Reports LLC and provides services to Streetwise Reports as an independent contractor. She or members of her household own securities of the following companies mentioned in the article: None. She or members of her household are paid by the following companies mentioned in this article: None. 2) The following companies mentioned in this article are billboard sponsors of Streetwise Reports: None. Click here for important disclosures about sponsor fees. 3) Comments and opinions expressed are those of the specific experts and not of Streetwise Reports or its officers. The information provided above is for informational purposes only and is not a recommendation to buy or sell any security. 4) The article does not constitute investment advice. Each reader is encouraged to consult with his or her individual financial professional and any action a reader takes as a result of information presented here is his or her own responsibility. By opening this page, each reader accepts and agrees to Streetwise Reports’ terms of use and full legal disclaimer. This article is not a solicitation for investment. Streetwise Reports does not render general or specific investment advice and the information on Streetwise Reports should not be considered a recommendation to buy or sell any security. Streetwise Reports does not endorse or recommend the business, products, services or securities of any company mentioned on Streetwise Reports. 5) From time to time, Streetwise Reports LLC and its directors, officers, employees or members of their families, as well as persons interviewed for articles and interviews on the site, may have a long or short position in securities mentioned. Directors, officers, employees or members of their immediate families are prohibited from making purchases and/or sales of those securities in the open market or otherwise from the time of the interview or the decision to write an article until three business days after the publication of the interview or article. The foregoing prohibition does not apply to articles that in substance only restate previously published company releases.
Disclosures from BMO Capital Markets, Leagold Corp., August 13, 2019
IMPORTANT DISCLOSURES
Analyst’s Certification I, Ryan Thompson, hereby certify that the views expressed in this report accurately reflect my personal views about the subject securities or issuers. I also certify that no part of my compensation was, is, or will be, directly or indirectly, related to the specific recommendations or views expressed in this report.
Analysts who prepared this report are compensated based upon (among other factors) the overall profitability of BMO Capital Markets and their affiliates, which includes the overall profitability of investment banking services. Compensation for research is based on effectiveness in generating new ideas and in communication of ideas to clients, performance of recommendations, accuracy of earnings estimates, and service to clients.
Analysts employed by BMO Nesbitt Burns Inc. and/or BMO Capital Markets Limited are not registered as research analysts with FINRA. These analysts may not be associated persons of BMO Capital Markets Corp. and therefore may not be subject to the FINRA Rule 2241 restrictions on communications with a subject company, public appearances and trading securities held by a research analyst account.
Company Specific Disclosures
Disclosure 5: BMO Capital Markets or an affiliate received compensation for products or services other than investment banking services within the past 12 months from Leagold Mining. Disclosure 6C: Leagold Mining is a client (or was a client) of BMO Nesbitt Burns Inc., BMO Capital Markets Corp., BMO Capital Markets Limited or an affiliate within the past 12 months: C) Non-Securities Related Services. Disclosure 16: A research analyst has extensively viewed the material operations of Leagold Mining. Disclosure 17: Leagold Mining has paid or reimbursed some or all of the research analyst’s travel expenses.
For Important Disclosures on the stocks discussed in this report, please click here.
Peter Epstein of Epstein Research compares this explorer to others in the area.
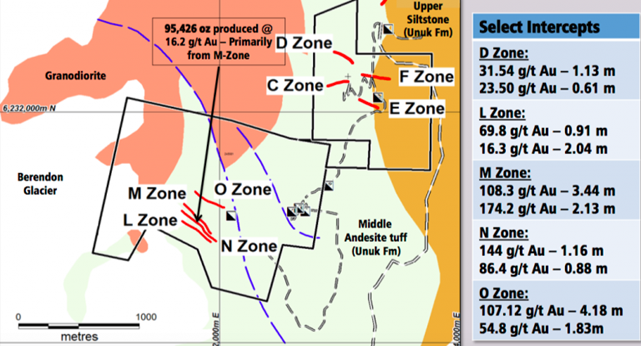
In May I conducted an in-depth interview with Brad Rourke, president and CEO of Scottie Resources Corp. (SCOT:TSX.V). Scottie owns/controls 18,544 hectares (~45,823 acres) in the world-famous Golden Triangle (GT) in northwestern British Columbia in Canada. Some of the best historical gold intercepts on the company’s seven properties are: 107.1 grams per tonne (g/t) over 4.18m, 108.3 g/t over 3.44m, 2.13m of 174.2 g/t, and 4.2m of 70.6g/t.
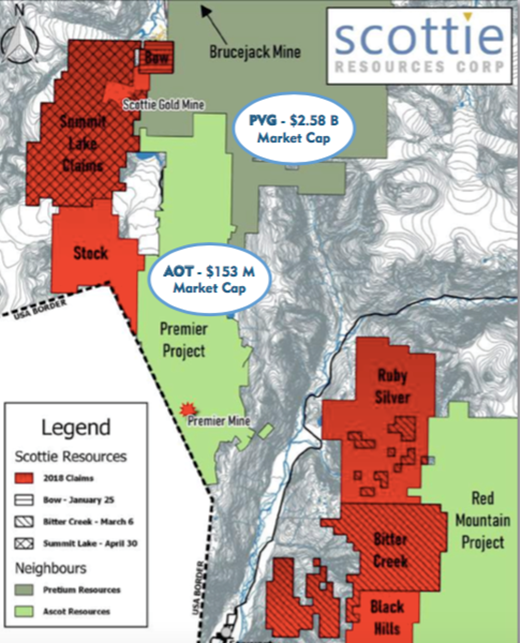
Yet, these historical results barely scratch the surface of a newly expanded land package consisting of two substantial contiguous claim blocks in one of the hottest parts of the red hot GT. Since my interview, gold is up ~$220/oz. to $1,515/oz., but Scottie Resources’ share price is down 31% to C$0.145. Both of Scottie’s sizable, contiguous land packages share borders with Ascot Resources (AOT.V). (See map below.)
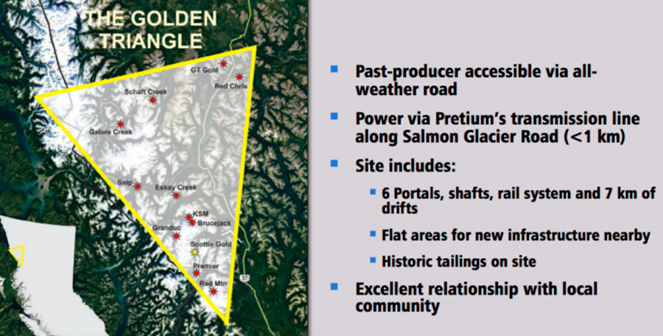
The 1) Bow, 2) Scottie Gold Mine, 3) (newly optioned, 100% of 4,877 ha) Summit Lake and 4) Stock properties, totaling 8,178 hectares, are 2030 km south of Pretium Resources’ (PVG.T) ultra high-grade, 400k oz/year Brucejack mine and west of Ascot’s advanced exploration, past-producing Premier-Dilworth project.
Scottie’s second contiguous block consists of 1) Ruby Silver, 2) Bitter Creek and 3) Black Hills, a combined 10,366 hectares. These properties are west of Ascot’s Red Mountain project. A 2017 BFS done on Red Mountain using US$1,250/oz. gold returned an after-tax IRR of 32%. At $1,450/oz., the IRR jumps to 44%. And, that’s with only a 5.4-year operating mine life.
Is Scottie Resources under-followed and undervalued?
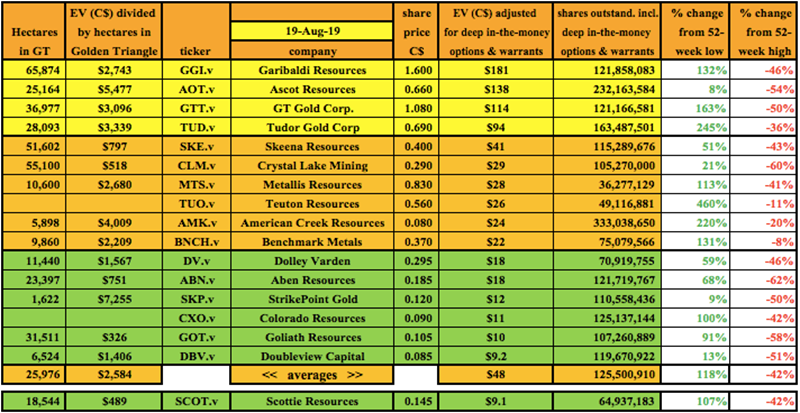
CEO Rourke and team believe their company is worth considerably more than its enterprise value [market cap + debt cash] (EV) of C$9.1 million = ~US$6.9 million. (See corporate presentation.) Scottie is trading at a 92% discount to the average of EVs of GT Gold (GTT.V), Ascot and Tudor Gold (TUD.V).
Admittedly, those companies warrant significant premiums. For one thing, they have a lot more drill results in hand. However, neither GT Gold nor Tudor have delivered maiden resources on their primary Golden Triangle properties.
Ascot has three or four projects on its combined 25,164 hectare holdings, including the recently acquired IDM Mining and Silver Coin properties. It wants to produce from multiple mine sites, feeding a central mill. Ascot’s CEO recently said that he thinks AOT could reach production by the end of next year. That would draw a lot of attention to Scottie, look at the map!
Scottie’s best intercepts, and past production profile at the Scottie Gold mine property (95.4k ounces @ 16.2 g/t gold) could prove superior to Ascot’s grade (2.826 million ounces Measured, Indicated + Inferred @ ~7.4 g/t gold). Higher grade, 10+ g/t gold, would be valuable to Ascot to mix with its 78 g/t mill feed.
To be clear, Scottie has a lot more drilling to do before it can provide line of sight to a meaningful high-grade resource.
Every GT junior says it’s in a great spot, some are misinformed .
There’s reason to take Scottie’s CEO and new full-time VP of Exploration seriously when they brag about their properties being situated in a top location in the Triangle. Two of the very best geologists working in the region, JoAnne Nelson and Jeff Kyba, said the following in this 2014 British Columbia Geological paper,
“One of the most important mineral trends of northwestern British Columbia extends from near the town of Stewart north to the Treaty Glacier, in the western part of the Stikine arc terrane. Major deposits along this trend include KSM (Seabridge Gold), Brucejack, (Pretium Resources), Silbak-Premier, Big Missouri and Red Mountain (Ascot Resources) and Scottie Gold (Scottie Resources).”
Scottie Resources offers a compelling risk-adjusted investment opportunity. Look no further than the gold price. It was at ~$1,295/oz. the day my CEO interview was posted. Earlier this month it smashed through $1,500/oz., and is now at $1,515/oz. Gold is at a 64-month high!
“Rock Star” VP of Exploration has tremendous GT experience
In June, Scottie hired a literal, “rock star,” a full-time VP of Exploration. Thomas Mumford, Ph.D., P. Geo, is an exploration geologist with a comprehensive field, technical and academic background.
He’s passionate about grassroots exploration and has 15 years’ extensive project management experience. Thomas’ expertise, much of it gained in the GT, greatly enhances the team’s ability to design cost effective, high impact drill programs.
2,000 meter / 12-hole drill program to start by mid-September
On August 20th, the company announced that 2,000 meters, in 12 holes, split between the Scottie Gold mine and Bow properties, will start by mid-September. The program is designed to follow up on, and step-out from, historical near-surface high-grade intercepts at Bow. And, assess a newly discovered zone on the Scottie Gold property recently exposed from glacial retreat.
Thirteen gold-bearing vein zones have been identified between the contiguous Scottie Gold and Bow properties, but mine production was primarily from a single vein (the M-zone). (See image below.)
Highlights from Bow property historical drill hole intercepts include:
84-7: 70.15 g/t Au over 4.17m / 91-5: 57.94 g/t Au over 2.60m
91-6: 28.11 g/t Au over 2.64m / 05-03: 18.48 g/t Au over 1.83m
All intercepts reported above are true widths and are located at vertical depths of less than 45m. No drilling has tested mineralization below 55 m in vertical depth. Management believes that the near-surface, high-grade veins pinch and swell, meaning that mineralization could be open at depth. Results are expected in late October.
CEO Rourke commented in the latest press release,
“Based on the historical drilling and extensive fieldwork over the last 2 years, the initial drill program is designed to expand & confirm the geometry and continuity of high grade gold zones. The 2019 fieldwork and drill program will lead to a larger, more targeted exploration program on the Scottie and Bow properties, as well as our newly acquired Summit Lake claims in 2020<.”
180K tonnes of tailings could be monetized starting next year
I estimate Scottie has 910,000 ounces of gold contained in tailings. Monetization of this valuable asset could start as soon as next year. Both the economics of the proposed operation and the ability to fund start-up costs have dramatically improved. The in-situ (in-the-ground) value of 9,500 ounces would be twice Scottie’s EV of C$9.1 million. These ounces are above-ground, they’ve already been mined!
Many GT juniors have rallied, some have soared, along with the gold price. In the past three months, Garibaldi (GGI.V), Tudor, American Creek (AMK.V) and Teuton (TUO.V) are up an average of 174%. By contrast, despite having secured nearly 5,000 additional hectares in the heart of the GT, Scottie’s share price is down 31% from $0.21 to $0.145.
If looking at relative value, it’s hard to ignore Scottie Resources
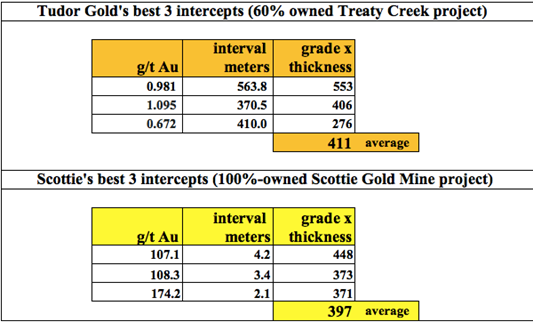
In comparing Scottie Resources to other GT juniors, it’s hard to explain why the company is valued the way it is. Consider Tudor Gold, with an EV of $94 million. It’s more advanced project, Treaty Creek, is about 18,000 hectares in size. However, Tudor owns just 60% of it, and it is free-carrying two juniors, 20% each.
Is 60% of Treaty Creek, (plus three far less important properties), worth more than 10 times Scottie’s two contiguous blocks totaling 18,544 hectares? I think the huge valuation gap between Tudor and Scottie will shrink as more investors look at relative value in the GT. Scottie has tremendous resource expansion and discovery potential at depth, from additional zones along strike, and in parallel mineralized structures.
M&A in the Golden Triangle likely to soar
With gold above $1,500/oz., M&A in the GT is likely to pick up. I believe that transactions will shine a favorable light on Scottie Resources. Majors including Newmont Goldcorp, Newcrest Mining, Teck Resources and Kinross Gold are either active in the GT or thought to be interested in entering the district.
Any of those players, with an average EV above $20 billion, could look to acquire companies like Pretium (Brucejack), NovaGold (Galore Creek) or Seabridge (KSM). In addition, Pretium, NovaGold and Seabridge, in turn, could have their sights on Ascot, GT Gold and Tudor. And, the latter three could be interested in some of the remaining 13 names on my chartjuniors with EVs ranging from $9 million (Scottie) to $41 million (Skeena Resources).
Scottie’s property size is 5.3% of the total hectares listed in the chart, but its EV is just 1.2% of total EVs. Therefore, if each hectare were equal in terms of ownership tenure, proximity to infrastructure, depth of deposit, geology, grade, etc., Scottie would be significantly undervalued.
Conclusion
The Golden Triangle is world famous, known for high and super-high grade gold deposits, but it can be very expensive to explore there. Drill programs can only be done four or five months out of the year. A strong gold price is incredibly helpful. As capital flows into the GT, infrastructure gets built for the good of many and M&A attracts a lot more attention and investment to the area.
All of this is great news for well positioned GT juniors, but especially for Scottie Resources. Unlike several peers, Scottie’s share price has not moved significantly higher with the gold price. It owns or controls a sizable 18,554 hectares (a larger footprint than six peers on the chart), in two contiguous blocks in a great location. Scottie, with its small EV, is, or will be, a prime takeout target by a growing number of prospective suitors.
Readers interested in investing in the Golden Triangle, should consider taking a closer look at Scottie Resources (SCOT.V). In addition to filings on Sedar, the company has an excellent corporate presentation. And, here are the latest press releases.
Peter Epstein is the founder of Epstein Research. His background is in company and financial analysis. He holds an MBA degree in financial analysis from New York University’s Stern School of Business.
Disclosures: The content of this article is for information only. Readers fully understand and agree that nothing contained herein, written by Peter Epstein of Epstein Research [ER], (together, [ER]) about Scottie Resources, including but not limited to, commentary, opinions, views, assumptions, reported facts, calculations, etc. is not to be considered implicit or explicit investment advice. Nothing contained herein is a recommendation or solicitation to buy or sell any security. [ER] is not responsible under any circumstances for investment actions taken by the reader. [ER] has never been, and is not currently, a registered or licensed financial advisor or broker/dealer, investment advisor, stockbroker, trader, money manager, compliance or legal officer, and does not perform market making activities. [ER] is not directly employed by any company, group, organization, party or person. The shares of Scottie Resources are highly speculative, not suitable for all investors. Readers understand and agree that investments in small cap stocks can result in a 100% loss of invested funds. It is assumed and agreed upon by readers that they will consult with their own licensed or registered financial advisors before making any investment decisions.
At the time this article was posted, Peter Epstein owned shares of Scottie Resources, and the Company was an advertiser on [ER].
Readers understand and agree that they must conduct their own due diligence above and beyond reading this article. While the author believes he’s diligent in screening out companies that, for any reasons whatsoever, are unattractive investment opportunities, he cannot guarantee that his efforts will (or have been) successful. [ER] is not responsible for any perceived, or actual, errors including, but not limited to, commentary, opinions, views, assumptions, reported facts & financial calculations, or for the completeness of this article or future content. [ER] is not expected or required to subsequently follow or cover events & news, or write about any particular company or topic. [ER] is not an expert in any company, industry sector or investment topic.
Streetwise Reports Disclosure: 1) Peter Epstein’s disclosures are listed above. 2) The following companies mentioned in the article are billboard sponsors of Streetwise Reports: Pretium Gold and Seabridge Gold. Click here for important disclosures about sponsor fees. The information provided above is for informational purposes only and is not a recommendation to buy or sell any security. 3) Statements and opinions expressed are the opinions of the author and not of Streetwise Reports or its officers. The author is wholly responsible for the validity of the statements. The author was not paid by Streetwise Reports for this article. Streetwise Reports was not paid by the author to publish or syndicate this article. Streetwise Reports requires contributing authors to disclose any shareholdings in, or economic relationships with, companies that they write about. Streetwise Reports relies upon the authors to accurately provide this information and Streetwise Reports has no means of verifying its accuracy.
4) The article does not constitute investment advice. Each reader is encouraged to consult with his or her individual financial professional and any action a reader takes as a result of information presented here is his or her own responsibility. By opening this page, each reader accepts and agrees to Streetwise Reports’ terms of use and full legal disclaimer. This article is not a solicitation for investment. Streetwise Reports does not render general or specific investment advice and the information on Streetwise Reports should not be considered a recommendation to buy or sell any security. Streetwise Reports does not endorse or recommend the business, products, services or securities of any company mentioned on Streetwise Reports. 5) From time to time, Streetwise Reports LLC and its directors, officers, employees or members of their families, as well as persons interviewed for articles and interviews on the site, may have a long or short position in securities mentioned. Directors, officers, employees or members of their immediate families are prohibited from making purchases and/or sales of those securities in the open market or otherwise from the time of the interview or the decision to write an article until three business days after the publication of the interview or article. The foregoing prohibition does not apply to articles that in substance only restate previously published company releases. As of the date of this article, officers and/or employees of Streetwise Reports LLC (including members of their household) own securities of Pretium Resources, a company mentioned in this article.
The next steps for each of the programs are outlined in a Dawson James Securities report.
In an Aug. 14 research note, Dawson James Securities analyst Jason Kolbert reported that Soligenix Inc. (SNGX:NASDAQ) “is now focused on the two pivotal programs, in cutaneous T-cell lymphoma (SGX301) and mucositis (dusquetide), while moving the public health solutions platform forward.”
Kolbert provided updates on all three efforts, highlighting that the two involving Phase 3 biotherapeutics are nearing topline data readout.
As for Soligenix’s SGX301, or synthetic hypericin, program for cutaneous T-cell lymphoma (CTCL), the independent data monitoring committee gave the pivotal trial a positive recommendation. Enrollment is taking place of about 40 more people “to maintain the assumption of 90% statistical power for the primary efficacy endpoint,” noted Kolbert. Soligenix expects to finish enrollment in H2/19 and subsequently release topline results in Q1/20.
Regarding Soligenix’s SGX942 (dusquetide) program for mucositis associated with head and neck cancer, enrollment of 90 patients is slated to start in September for the interim efficacy analysis. With enrollment expected to be done in H2/19, final topline results are anticipated in H1/20.
With respect to Soligenix’s public health platform, the company continues to advance RiVax, a ricin toxin vaccine. In H2/19, it will commence a Phase 1/2, immunogenicity and safety trial involving healthy volunteers. Also, the company plans to conduct efficacy studies in nonhuman primates to build a “larger database of biomarkers for correlation with human clinical results,” Kolbert explained.
The analyst also included in his report a brief recap of Soligenix’s Q2/19 financials. The biopharma spent $2.1 million during the quarter and ended it with $7 million in cash.
Dawson James has a $3 per share price target and a Buy rating on Soligenix, whose stock is currently trading at around $1.09 per share.
Disclosure: 1) Doresa Banning compiled this article for Streetwise Reports LLC and provides services to Streetwise Reports as an independent contractor. She or members of her household own securities of the following companies mentioned in the article: None. She or members of her household are paid by the following companies mentioned in this article: None. 2) The following companies mentioned in this article are billboard sponsors of Streetwise Reports: None. Click here for important disclosures about sponsor fees. 3) Comments and opinions expressed are those of the specific experts and not of Streetwise Reports or its officers. The information provided above is for informational purposes only and is not a recommendation to buy or sell any security. 4) The article does not constitute investment advice. Each reader is encouraged to consult with his or her individual financial professional and any action a reader takes as a result of information presented here is his or her own responsibility. By opening this page, each reader accepts and agrees to Streetwise Reports’ terms of use and full legal disclaimer. This article is not a solicitation for investment. Streetwise Reports does not render general or specific investment advice and the information on Streetwise Reports should not be considered a recommendation to buy or sell any security. Streetwise Reports does not endorse or recommend the business, products, services or securities of any company mentioned on Streetwise Reports. 5) From time to time, Streetwise Reports LLC and its directors, officers, employees or members of their families, as well as persons interviewed for articles and interviews on the site, may have a long or short position in securities mentioned. Directors, officers, employees or members of their immediate families are prohibited from making purchases and/or sales of those securities in the open market or otherwise from the time of the interview or the decision to write an article until three business days after the publication of the interview or article. The foregoing prohibition does not apply to articles that in substance only restate previously published company releases.
Disclosures for Dawson James Securities, Soligenix Inc., August 14, 2019,
The Firm does not make a market in the securities of the subject company(s). The Firm has NOT engaged in investment banking relationships with Dare in the prior twelve months, as a manager or co-manager of a public offering and has NOT received compensation resulting from those relationships. The Firm may seek compensation for investment banking services in the future from the subject company(s). The Firm has not received any other compensation from the subject company(s) in the last 12 months for services unrelated to managing or co-managing of a public offering.
Neither the research analyst(s) whose name appears on this report nor any member of his (their) household is an officer, director or advisory board member of these companies. The Firm and/or its directors and employees may own securities of the company(s) in this report and may increase or decrease holdings in the future. As of July 31, 2019, the Firm as a whole did not beneficially own 1% or more of any class of common equity securities of the subject company(s) of this report. The Firm, its officers, directors, analysts or employees may affect transactions in and have long or short positions in the securities (or options or warrants related to those securities) of the company(s) subject to this report. The Firm may affect transactions as principal or agent in those securities.
Analysts receive no direct compensation in connection with the Firm’s investment banking business. All Firm employees, including the analyst(s) responsible for preparing this report, may be eligible to receive non-product or service specific monetary bonus compensation that is based upon various factors, including total revenues of the Firm and its affiliates as well as a portion of the proceeds from a broad pool of investment vehicles consisting of components of the compensation generated by investment banking activities, including but not limited to shares of stock and/or warrants, which may or may not include the securities referenced in this report.
Analyst Certification: The analyst(s) whose name appears on this research report certifies that 1) all of the views expressed in this report accurately reflect his (their) personal views about any and all of the subject securities or issuers discussed; and 2) no part of the research analysts compensation was, is, or will be directly or indirectly related to the specific recommendations or views expressed by the research analyst in this research report; and 3) all Dawson James employees, including the analyst(s) responsible for preparing this research report, may be eligible to receive non-product or service specific monetary bonus compensation that is based upon various factors, including total revenues of Dawson James and its affiliates as well as a portion of the proceeds from a broad pool of investment vehicles consisting of components of the compensation generated by investment banking activities, including but not limited to shares of stock and/or warrants, which may or may not include the securities referenced in this report.
Bob Moriarty of 321 Gold provides an update on recent exploration developments at this company’s project located in British Columbia’s Golden Triangle.
Goliath Resources Ltd. (GOT:TSX.V)released an interesting press release on August 15th that doubled the price of the shares in the next week. The company drilled a 718-meter hole, limited only by the constraints on the drill, that hit mineralized material right from surface for the entire length of the core. If it runs the expected gold/copper/silver/moly that they were finding on surface, it will go a lot higher.
I wrote about the company a little over a year ago. The shares were new then and twice what they are now even with the latest results.
Goliath is drilling the Lucky Strike property. So far they have completed one hole and are in the midst of drilling the 2nd hole. The 2nd hole is planned for about 700 meters. This initial drill program will have three holes.
They are paying the vendor $989,000 over a five year period and have a $6.5 million work commitment to own 100% of the project.
The company has 68 million warrants outstanding at an average exercise price of $0.19 so any initial success will cash up the company with over $13 million in cash so the work commitment will be no problem.
From a technical point of view, it would appear the initial hole at Lucky Strike was a home run. The core is being cut and will be off for assay shortly. Results will be back by mid-October so until then the grade is an interesting mystery.
The Lucky Strike project is surrounded by porphyry and lies near the Golden Triangle of Northern British Colombia. While it is greenfield exploration, the intercept shows good understanding of the technical issues. Soil samples taken in 2018 and earlier this year support the potential for a massive system.
Goliath is not intending to take anything to production. They want to do the initial geochemical and soil samples to support the drill program and with any success joint venture the project to any interested major.
I would guess the majors would be looking real hard at the core to think of doing a deal. Since Goliath has to spend $6.5 million anyway, I would expect any initial success to be followed up with a lot more drilling prior to doing a deal.
Goliath was an advertiser before but is keeping all their cash for the drill program so are not currently an advertiser. Based on what seems to me to be an excellent start to the drill program, I have gone out into the market to buy shares so I am biased. They are doing an excellent job of communication so I would encourage any potential investor to spend a lot of time researching the company and the project.
Bob and Barb Moriarty brought 321gold.com to the Internet almost 16 years ago. They later added 321energy.com to cover oil, natural gas, gasoline, coal, solar, wind and nuclear energy. Both sites feature articles, editorial opinions, pricing figures and updates on current events affecting both sectors. Previously, Moriarty was a Marine F-4B and O-1 pilot with more than 832 missions in Vietnam. He holds 14 international aviation records.
Want to read more Gold Report articles like this? Sign up for our free e-newsletter, and you’ll learn when new articles have been published. To see a list of recent articles and interviews with industry analysts and commentators, visit our Streetwise Interviews page.
Disclosure: 1) Bob Moriarty: I, or members of my immediate household or family, own shares of the following companies mentioned in this article: Goliath Resources. Goliath Resources is a former advertiser on 321 Gold. I determined which companies would be included in this article based on my research and understanding of the sector. 2) The following companies mentioned are billboard sponsors of Streetwise Reports: None. Click here for important disclosures about sponsor fees. 3) Statements and opinions expressed are the opinions of the author and not of Streetwise Reports or its officers. The author is wholly responsible for the validity of the statements. The author was not paid by Streetwise Reports for this article. Streetwise Reports was not paid by the author to publish or syndicate this article. The information provided above is for informational purposes only and is not a recommendation to buy or sell any security. Streetwise Reports requires contributing authors to disclose any shareholdings in, or economic relationships with, companies that they write about. Streetwise Reports relies upon the authors to accurately provide this information and Streetwise Reports has no means of verifying its accuracy. 4) The article does not constitute investment advice. Each reader is encouraged to consult with his or her individual financial professional and any action a reader takes as a result of information presented here is his or her own responsibility. By opening this page, each reader accepts and agrees to Streetwise Reports’ terms of use and full legal disclaimer. This article is not a solicitation for investment. Streetwise Reports does not render general or specific investment advice and the information on Streetwise Reports should not be considered a recommendation to buy or sell any security. Streetwise Reports does not endorse or recommend the business, products, services or securities of any company mentioned on Streetwise Reports. 5) From time to time, Streetwise Reports LLC and its directors, officers, employees or members of their families, as well as persons interviewed for articles and interviews on the site, may have a long or short position in securities mentioned. Directors, officers, employees or members of their immediate families are prohibited from making purchases and/or sales of those securities in the open market or otherwise from the time of the interview or the decision to write an article, until one week after the publication of the interview or article.
Egypt’s central bank cut its key interest rates by a further 150 basis points and said the “pace and magnitude of future policy adjustments will continue to be subject to confirmation that inflation expectations are anchored at target levels that are consistent with disinflation and price stability over the medium term.”
The Central Bank of Egypt (CBE) cut its overnight deposit rate, the overnight lending rate, the rate on its main operation and the discount rate by 150 basis points each to 14.25 percent 15.25 percent, 14.75 percent and 14.75 percent, respectively.
CBE has now cut its key rates by a total of 250 basis points this year following a cut in February and by a total of 450 basis points since February 2018 when it shifted into an easing cycle in response to slowing inflation following a surge after the exchange rate of the pound was floated in November 2016 as part of an agreement with the International Monetary Fund (IMF).
“As incoming data continued to confirm the moderation of underlying inflationary pressures, the MPC (monetary policy committee) decided to cut the policy rates by 150 basis points,” CBE said, adding this was consistent with its aim of lowering inflation to its target of 9.0 percent, plus/minus 3 percentage points by the fourth quarter of 2020.
Egypt’s inflation rate fell to 8.7 percent in July from 9.4 percent in June and 14.1 percent in May but the central bank cautioned the path for future policy rates is based on inflation expectations rather than current inflation rates and future rate changes are based on confirmation that inflation expectations are anchored to its target level.
The larger-than-expected drop in July inflation to the lowest rate in almost four years surprised analysts who had expected inflation to rise following a cut to subsidies that pushed up fuel prices. But it also ignited expectations the central bank would cut its rates by at least 100 basis points today.
CBE said the fall in inflation was supported by a containment of inflationary pressures and by favorable base effects as the recent fiscal consolidation measures were weaker than in the previous year.
Egypt’s economy is estimated to have expanded by 5.7 percent in the second quarter of this year, up from 5.6 percent in the first quarter, and by 5.6 percent in fiscal 2018/19, the highest rate in 11 years while unemployment is continuing to declined.
The Central Bank of Egypt released the following statement:
“The Monetary Policy Committee (MPC) decided to cut the Central Bank of Egypt’s (CBE)overnight deposit rate, overnight lending rate, and the rate of the main operation by 150 basis points to 14.25 percent, 15.25 percent, and 14.75 percent, respectively. The discount rate was also cut by 150 basis points to 14.75 percent. Annual headline and core inflation continued to decline to record 8.7 percent and 5.9 percent in July 2019, respectively, the lowest rates in almost four years, notwithstanding the recently implemented fiscal consolidation measures that reached cost recovery for most fuel products. This decline was supported by the containment of inflationary pressures, as evident in the relatively tame monthly inflation figures, and by favorable base effects, as the recently implemented measures were weaker compared to the previous year. Real GDP growth continued to increase slightly to record a preliminary estimate of 5.7 percent in 2019 Q2 and 5.6 percent in fiscal year 2018/19, the highest in eleven years. Meanwhile, the unemployment rate continued to decline to record 7.5 percent in 2019 Q2, thereby narrowing by almost 6 percentage points from its peak in 2013 Q4. Globally, the expansion of economic activity continued to weaken, financial conditions eased, and trade tensions continued to weigh on the outlook. International oil prices recently declined, yet remain subject to volatility due to geopolitical risks and potential supply-side factors. As incoming data continued to confirm the moderation of underlying inflationary pressures, the MPC decided to cut key policy rates by 150 basis points. This remains consistent with achieving the inflation target of 9 percent (±3 percentage points) in 2020 Q4 and price stability over the medium term. The path for future policy rates remains a function of inflation expectations, rather than of prevailing inflation rates. Accordingly, the pace and magnitude of future policy rates adjustment will continue to be subject to confirmation that inflation expectations are anchored at target levels that are consistent with disinflation and price stability over the medium term. The MPC closely monitors all economic developments and will not hesitate to adjust its stance to preserve monetary stability.”
Money manager Adrian Day explains why he is a believer in holding royalty company shares in a bull market.
There is a common perception that the royaltyand streamingcompanies are defensive in a bear market, but that you don’t want to own them in a bull market since they lack leverage. We disagree, and think the major royalty companies should continue to form cornerstones of a precious metals portfolio in a bull market.
No doubt, we do not expect any of the major royalty companies to be the very top-performing stock in a precious metals portfolio during a bull market. But:
Royalty companies have plenty of leverage from expansions at existing mines and new mines coming into production on higher gold prices; the royalty company contributes no additional capital to see a dormant asset start generating revenue.
Royalty companies continue to exhibit, on balance, the lowest risk of any precious metals sector, second only to bullion itself.
Royalty companies tend to pay dividends above the PM universe average, and with tremendous free cash flow generation, have the ability to increase dividends.
The royalty companies will attract new money in the gold space; generalists will go to Franco, U.S. retail investors to Royal Gold.
If not necessarily the best performing stocks in a bull market, the returns from royalty companies will be more than satisfactory.
In short, I will put a portfolio of four or five royalty companies against four or five miners any day.
Franco remains the crown jewel
Franco-Nevada Corp. (FNV:TSX; FNV:NYSE, US$92.78) is the crème of the crop; its shares have outperformed the index about 10 times since its re-listing in 2008. It has top management, innovative and conservative; a solid balance sheet, with modest debt only twice in that time frame; a willingness to act counter-cyclically; strong diversification in its portfolio; a low cost structure; and a deep pipeline of assets.
Only two of its assets contribute more than 10% of its revenue, and the top operator is responsible for only 12%. This diversification is broader than for other companies, and means Franco is not at risk from a failure either of an operator or an asset.
As for costs, its G&A is not much higher today than it was a decade ago, despite the tremendous growth in revenue, representing today less than 5% of its revenue.
Strong quarter and stronger year
Franco reported strong revenues, above estimates, in its latest quarter, with oil and gas revenues offsetting slightly weak metals sales. The company expects metals sales to be at the higher end of guidance for the rest of the year, as Cobre Panama, its latest major asset, ramps up. And oil and gas revenues are expected to continue strong as well, including from the recent Marcellus shale acquisition.
First deliveries from Cobre Panama came in July, a little later than expected, and therefore are not contributing to first-half revenues at all. But operator First Quantum is reporting better grades and higher recoveries, leading to expectations for a rapid ramp up, and a strong contribution to second-half revenues. This mine lays the groundwork for five years of revenue growth for Franco, even absent other developments.
Even after final capital contributions to Cobre Panama and the Marcellus shale acquisition, Franco ended the quarter with a strong balance sheet, with virtually $400 million in cash against $385 million in total debt. It has $1.1 billion of available liquidity, more than sufficient to make additional large-scale acquisitions. The next acquisition is expected to be in the precious metals, not oil and gas.
Franco recently implemented an “ATM” program for up to $200 million, allowing the company to issue small amounts of shares from treasury into the market. This tool is better than raising capital in one go, which tends to have a negative impact on the market. Together with cash flow, this new equity could extinguish the debt rapidly.
Royal recoveries strong, though one risk remains
Royal Gold Inc. (RGLD:NASDAQ; RGL:TSX, US$124.64) lost some revenue in the last quarter, both early on from the reduction in operations at Mt Milligan due to water shortages, and from the suspended operations at Peñasquito after a road blockade. Both operations are back up to speed now. The result was revenue slightly under expectations.
Mt Milligan saw sequential improvements and next quarter should be a strong one, but the underlying water issue is unresolved, and operator Centerra has indicated that there may be another stoppage this winter. With both Mt Milligan and Peñasquito up to normal operation levels, and with the resumption of revenue from Voisey’s Bay following an agreement with Vale, the balance of the year should see strong revenues.
Royal has a strong balance sheet, with $119 million cash, $220 million recently drawn down on its credit line, and available liquidity of $780 million. This puts them in a strong position for new acquisition; the company indicated they had been receiving numerous requests for financing, many from earlier stage projects. We expect to see some acquisitions in coming months, but perhaps smaller ones that won’t move the needle much in the near term.
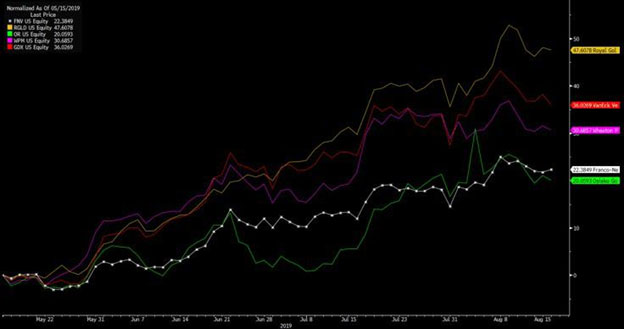
Royalty Companies versus Miners Since May
Source: Bloomberg The royalty companies have mostly lagged the major miners since gold took off in mid-May, but the picture looks different if we look at the entire year or any longer period.
Osisko sees recovery in revenues
Osisko Gold Royalties Ltd. (OR:TSX; OR:NYSE, US$12.15) reported a small beat to expectations, partly due to better-than-expected production at Pretium’s Bruejack, though ounces were down on a year ago, partly due to the Renard diamond mine, currently in restructuring. But the company is expecting a significant improvement in ounces in the second half of the year as the new Eagle Mine of Victoria Gold comes on stream, with first production expected next month, as well as improvement in production from the Éléonore Mine.
The most important development in the last quarter was the deal with Orion, a private equity firm. Osisko bought back from Orion shares in exchange for cash and the transfer of several junior investments. The shares repurchased were returned to treasury, resulting in an 8% reduction in shares outstanding, while there was no reduction in the cash-generating assets (but a $2.5 million reduction in dividend payments). Orion is now down to just over 6% ownership.
The result at quarter end was liquidity of $450 million, plus an investment portfolio now valued at $282 million, down from $400 million prior to the Orion transaction.
Osisko tends to be more involved in the companies on which it holds revenues, whether through its accelerator programthere were several advances at such companies owned by Osisko Mining, in which Osisko Royalties owns over 16%–or in helping companies in difficulties. Osisko is taking an active role in the restructuring of the Renard mine.
Undervalued vs peers
As we have said before, the acceleratoror “incubator”program certainly adds an element of risk, in addition to the greater leverage not in a traditional royalty company. That, plus Osisko’s size relative to the “big three,” partly account for its lower valuation, but the gap has now become quite extreme. Osisko’s price-to-book value, for example, is 1.5x compared with up to 3.8x for Royal; its free cash-flow multiple is 29 x compared with over 1,000x for Franco, and non-existent for Wheaton (both temporary anomalies).
Wheaton down to loss
Wheaton Precious Metals Corp. (WPM:TSX; WPM:NYSE, US$26.49) reported a financial loss despite strong operating results and higher sales (notwithstanding temporary suspension of operations at Peñasquito during the recent quarter). The higher sales were offset by higher costscost per ounce can increase under some streaming dealsand higher G&A.
The financial loss was caused by an impairment charge on its recent cobalt stream (a deal criticized at the time) after a company with a similar stream (on the same mine, Voisey’s Bay) was sold, crystalizing the market value). Even without all adjustments, earnings still declined from $72 million a year ago to $45 million in the latest quarter.
Wheaton is looking a strong second half, forecasting record gold production for the year, with Peñasquito back on line.
One asset which was to be one of its medium-term growth drivers, Hudbay’s Rosemont Mine in Arizona, received a setback with a district judge issued an injunction against construction of the mine. Wheaton’s payment of $230 million only occurs once construction is underway, so the risk is limited.
Wheaton’s balance sheet is the weakest of the four major royalty companiesor perhaps we should call it the “least strong,” with $87 million of cash against net debt of over $1 billion. Cash flow in the latest quarter was $109 million, so it would take a while to pay down the debt. Available liquidity on the unused portion of its credit line is $900 million.
All the royalty stocks have moved up and we are expecting a near-term pullback in the gold sector, so you should wait before buying. Franco is a core holding, so you should take a position on any pullback if you do not own. Osisko, the least well-valued, can also be bought on a pullback. Royal has moved too far, too fast, notwithstanding prospects for a strong next quarter, and Mt Milligan remains a risk, so we are holding, as are we Wheaton.
Adrian Day, London-born and a graduate of the London School of Economics, heads the money management firm Adrian Day Asset Management, where he manages discretionary accounts in both global and resource areas. Day is also sub-adviser to the EuroPacific Gold Fund (EPGFX). His latest book is “Investing in Resources: How to Profit from the Outsized Potential and Avoid the Risks.”
Disclosure: 1) Adrian Day: I, or members of my immediate household or family, own shares of the following companies mentioned in this article: Franco-Nevada and Royal Gold. I personally am, or members of my immediate household or family are, paid by the following companies mentioned in this article: None. My company has a financial relationship with the following companies mentioned in this article: None. Funds controlled by Adrian Day Asset Management hold shares of the following companies mentioned in this article: Franco-Nevada, Royal Gold, Osisko Gold Royalties and Wheaton Precious Metals. I determined which companies would be included in this article based on my research and understanding of the sector. 2) The following companies mentioned in this article are billboard sponsors of Streetwise Reports: Pretium Resources and Wheaton Precious Metals. Click here for important disclosures about sponsor fees. The information provided above is for informational purposes only and is not a recommendation to buy or sell any security. 3) Statements and opinions expressed are the opinions of the author and not of Streetwise Reports or its officers. The author is wholly responsible for the validity of the statements. The author was not paid by Streetwise Reports for this article. Streetwise Reports was not paid by the author to publish or syndicate this article. Streetwise Reports requires contributing authors to disclose any shareholdings in, or economic relationships with, companies that they write about. Streetwise Reports relies upon the authors to accurately provide this information and Streetwise Reports has no means of verifying its accuracy. 4) This article does not constitute investment advice. Each reader is encouraged to consult with his or her individual financial professional and any action a reader takes as a result of information presented here is his or her own responsibility. By opening this page, each reader accepts and agrees to Streetwise Reports’ terms of use and full legal disclaimer. This article is not a solicitation for investment. Streetwise Reports does not render general or specific investment advice and the information on Streetwise Reports should not be considered a recommendation to buy or sell any security. Streetwise Reports does not endorse or recommend the business, products, services or securities of any company mentioned on Streetwise Reports. 5) From time to time, Streetwise Reports and its directors, officers, employees or members of their families, as well as persons interviewed for articles and interviews on the site, may have a long or short position in securities mentioned. Directors, officers, employees or members of their immediate families are prohibited from making purchases and/or sales of those securities in the open market or otherwise from the time of the interview or the decision to write an article until three business days after the publication of the interview or article. The foregoing prohibition does not apply to articles that in substance only restate previously published company releases. As of the date of this article, officers and/or employees of Streetwise Reports (including members of their household) own securities of Franco-Nevada, Osisko Gold Royalties, Wheaton Precious Metals and Pretium Resources, companies mentioned in this article.
Overnight, we could get the most important economic data from New Zealand for the week. And an important indicator of what we might expect for their dollar in the future!
Unlike most other countries, the Kiwis track retail sales only on a quarterly basis. So we have to use other data as proxies to get insight into consumer demand.
This data is going to be extra relevant because it covers the period right after the first rate cut. So we’ll be looking to see if it had any effect. Also, we want to know if the data is justifying the speculation that there will be another cut by the end of the year.
The outlook from the RBNZ remains less than optimistic, but will consumers have a different view? Or will they at least respond to the actions taken to prop up the economy?
What We Are Expecting
For retail sales, the consensus among analysts is that they will have dropped by -2.4% in the last quarter. This would be a significant drop from the surprising growth of 0.7% in the first quarter.
It’s not unusual to have worse retail sales in the second quarter. This is because of the drop in agriculture activity and the lull before the start of the winter tourism season. However, the projections are for the worst quarterly performance since the financial crisis.
Electronic Card Transactions are one of the proxies we use to gauge consumer sentiment during the quarter, and the average came out to be negative. That was a continuation of the year-to-date negative trend in consumer spending. This would suggest that even if the data comes in as a surprise on the upside, it will still be lower than the prior quarter.
The Underlying Numbers
Projections indicate that core retail sales will grow by 1.5%, a substantial increase over the 0.7% in the prior quarter. There is a good explanation for the discrepancy between the two retail sales numbers. The core figure strips out expenditures on vehicles and car parts.
Most car purchases are made on credit and are of imported vehicles. With the expectation of economic underperformance, people are likely holding off on buying such expensive items. And with a weakening dollar, their price has been increasing ever since the RBNZ started taking action.
Vehicle purchases can be seen as a bellwether of future consumer and investment spending. If businesses, for example, are holding off on buying new vehicles, they are also likely to hold off on other forms of capital expenditure. Presumably, the easing in monetary policy is supposed to make credit more accessible, which would help vehicle sales. But if people don’t have confidence in the future of the economy, and in particular even lower rates are expected in the future, the policy might not have the desired effects.
For the annual retail figure, we can expect growth to slip slightly to 3.0% compared to the 3.3% reported in the prior quarter.
The Trends and Outlook
Another factor to have impacted consumer spending is the rise in gasoline prices. This implies consumers would have less disposable income. If you add the continuing weakness in the housing sector, there isn’t much additional disposable income for people to buy with.
Another set of analysts is strongly suggesting that the retail numbers won’t be so bleak. They project retail sales to stay flat, or maybe slightly positive. Their argument is that the RBNZ’s first rate cut should have helped the economy. In particular, they think it should have encouraged people to buy more things on credit. Just not with credit cards!
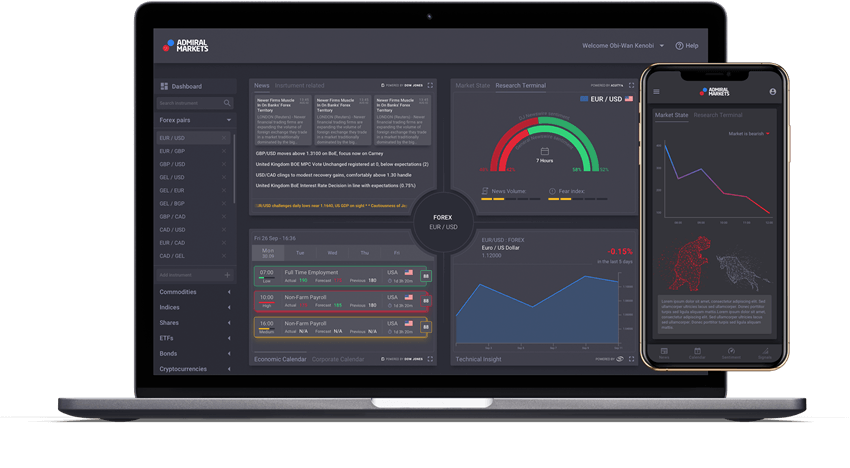
Admiral Markets has partnered with Trading Central, Acuity and Dow Jones Newswires to provide clients with an advanced trading and investing analytics portal, powered by trusted, high-quality content.
Available for free to all Admiral Markets clients, the Premium Analytics portal is designed to help traders and investors make informed decisions as well as find new opportunities.
With features including real-time news, professional market research, macroeconomic and corporate calendars, technical and fundamental analysis, pattern recognition and big-data-driven sentiment tools, Admiral Markets’ clients are now able to dive into the global markets through a convenient and user-friendly interface that works well on any device.
The enhanced news feature gives traders access to real-time multi-asset news, which covers up to 2,500 of the world’s most popular markets, including currencies, indices, commodities and stocks. Working in partnership with Dow Jones to provide a rich stream of news and data, Admiral Markets’ clients can easily navigate and customise the portal according to their interests.
Meanwhile, the Economic and Corporate calendars, powered by Dow Jones, show case market-impacting events in real-time across the political, economic and corporate sectors with enhanced functionality to allow traders and investors to follow their favourite companies.
The news sentiment widget, powered by Acuity, uses unique machine learning technology to reveal hidden insights from the text of millions of news articles, informing users through intuitive visualisations how positive the world is towards their favourite instruments. Whether traders use news sentiment to build their trading strategy or combine it with their current strategy, news sentiment can help all types of traders by freeing them from reading a range of information sources and providing an aggregated sentiment of the world’s financial media.
Another feature of the Premium Analytics portal is an award-winning professional widget – powered by Trading Central’s Technical Insight. This technical and fundamental analysis and trading signals tool was previously available only for professional traders and investors. Technical Insight empowers investors of all skill levels to optimise their trading strategies through a combination of actionable technical analysis, educational guidance and customisable alerts. Previously only available for Forex via MetaTrader Supreme Edition, the Admiral Markets’ Premium Analytics version will offer 24/7 coverage of all available markets.
Chairman of the Management Board of Admiral Markets Group, Sergei Bogatenkov, commented, “Admiral Markets is excited to be partnering with Dow Jones Newswires, Acuity and Trading Central to be offering our clients these advanced analytics features. Our mission is to provide our clients with the best trading experience, to ensure they have the best chances of success in their trading. Tools like Premium Analytics are an important step towards providing the best trading experience on the market.”
“The new research portal is the first stage of new developments by Admiral Markets aimed at giving their traders a far greater understanding of the markets and, in turn, more opportunities to trade,” says Andrew Lane, CEO of Acuity. “The visualisation of traditionally complex data sets in one portal combined with the embedded AI technology from Acuity exposes unique data correlations and previously undetected market insight. We worked closely with our partners at Dow Jones, utilising our detailed knowledge of news content and technology to deliver an exceptionally unique research portal for Admiral Markets.”
Meanwhile, Alain Pellier, CEO and co-founder of Trading Central commented, “At Trading Central, we’re dedicated to supporting investment decisions through innovation and we’re proud to partner with Admiral Markets to reach more traders and investors in the moments that matter. Their new Premium Analytics portal is blazing a path for modern experiences and holistic research. Technical Insight acts as a natural fit for this, with its premium, actionable technical analysis, educational commentary, and award-winning interface.”
About Admiral Markets Admiral Markets is a leading online trading and investing provider. In addition to a wide range of financial instruments, Admiral Markets offers free educational materials, including analytics, webinars and seminars. Admiral Markets is proud to announce being awarded the coveted “2019 CFD Broker of the Year” award by a customer survey conducted by Broker-Test.de, on the eve of celebrating 18 years of success in trading and client service.
About Acuity Acuity is a financial technology company specialising in the analysis and extraction of valuable data from financial news content. Founded in 2013, Acuity’s mission is to help traders to find and translate relevant news content into viable trading opportunities through the use of AI driven data tools and powerful visualisation techniques. Combining our team of academics, news specialists, proprietary technology and our partnership with Dow Jones, Acuity is harnessing the power of news and enriching the experience for Dow Jones clients worldwide.
About Trading Central Trading Central has been successfully supporting investment decisions through innovation since 1999. Our broad portfolio of market solutions combines award-winning analyst research and patented pattern recognition with 24H global multi-asset coverage. Collectively, these provide technical and fundamental analysis on 75,000+ instruments every market day to offer timely and actionable insight. Our tools empower today’s investors to participate in financial markets by helping them to generate trade ideas, validate investment decisions and manage risk- all at the point of action.
About Dow Jones Dow Jones is a global provider of news and business information, delivering content to consumers and organizations around the world across multiple formats, including print, digital, mobile and live events. Dow Jones has produced unrivaled quality content for more than 130 years and today has one of the world’s largest news-gathering operations globally. It produces leading publications and products including the flagship Wall Street Journal, America’s largest newspaper by paid circulation; Factiva, Barron’s, MarketWatch, Mansion Global, Financial News, Dow Jones Risk & Compliance and Dow Jones Newswires. Dow Jones is a division of News Corp (Nasdaq: NWS, NWSA; ASX: NWS, NWSLV).
*** Risk disclosure: CFDs are complex instruments and come with a high risk of losing money rapidly due to leverage. 77% of retail investor accounts lose money when trading CFDs with this provider. You should consider whether you understand how CFDs work and whether you can afford to take the high risk of losing your money. Read more at admiralmarkets.com
Dublin-based Medtronic reported Q1/20 earnings and revised its full-year earnings outlook upward sending shares up more than 5% today.
Medical device developer and manufacturer Medtronic Inc. (MDT:NYSE) today announced financial results for its first quarter of fiscal year 2020, which ended July 26, 2019.
In Q1/20, the company reported that worldwide revenue increased 1.5% to $7.493 billion versus $7.384 billion in Q1/19. GAAP net income and diluted EPS in Q1/20 were $864 million and $0.64, respectively, and Q1/20 non-GAAP net income and non-GAAP diluted EPS were $1.703 billion and $1.26, respectively, increases of 6% and 8%.
U.S. revenue in Q1/20 increased 1.4% over Q1/19 to $3.918 billion. Non-U.S. developed market revenue in Q1/20 decreased by 1.2% from Q1/19 to $2.377 billion. Emerging market revenue of $1.198 billion which represented 16% of company revenue increased 7.5% as reported and 12.5% percent on a constant currency basis.
Mr. Omar Ishrak, Medtronic’s chairman and CEO, stated, “Medtronic had a solid first quarter, delivering revenue growth, operating margin expansion, and adjusted EPS growth all ahead of expectations…It’s a good start to our fiscal year.”
Further breakdown by business segments shows that for Q1/20, the Cardiac and Vascular Group reported revenue of $2.790 billion, a 0.70% decrease from Q1/19. For the same corresponding periods the Minimally Invasive Therapies Group reported revenue of $2.100 billion, a 2.3% increase, the Restorative Therapies Group reported revenue of $2.012 billion, a 3.2 % increase, and the Diabetes Group posted revenue of $592 million, a 3.5 % increase.
The company reiterated its revenue growth guidance and raised its EPS guidance for FY/20. Medtronic stated it continues to expect revenue growth in FY/20 of approximately 4.0% on an organic basis and increased its FY/20 diluted non-GAAP EPS guidance to $5.545.60, up from the prior estimated range of $5.445.50.
Ishrak stated, “As a result of our first quarter outperformance and confidence in our outlook, we are raising our full year EPS guidance…We’re excited about what lies ahead, as we expect the investments we’ve made in our pipeline to begin to pay off with multiple pipeline catalysts, accelerating revenue growth, and value creation for our shareholders.”
Medtronic is headquartered in Dublin, Ireland, and indicates that it is among the world’s largest medical technology, services and solutions companies, focusing on alleviating pain, restoring health and extending life for millions of people globally. The company employs more than 90,000 people worldwide, serving physicians, hospitals and patients in more than 150 countries. The firm operates in four business segments: Cardiac and Vascular Group, Minimally Invasive Technologies Group, Restorative Therapies Group and Diabetes Group.
MDT shares opened today at $107.98 (+$3.80, +3.65%) over the previous day’s close of $104.18. This morning shares reached an all-time intraday high price of $109.70 and have traded between $106.82 and $109.70. At present, the stock is priced at $108.51 (+$4.33, +4.16%).
Disclosure: 1) Stephen Hytha compiled this article for Streetwise Reports LLC and provides services to Streetwise Reports as an independent contractor. He or members of his household own securities of the following companies mentioned in the article: None. He or members of his household are paid by the following companies mentioned in this article: None. 2) The following companies mentioned in this article are billboard sponsors of Streetwise Reports: None. Click here for important disclosures about sponsor fees. 3) Comments and opinions expressed are those of the specific experts and not of Streetwise Reports or its officers. The information provided above is for informational purposes only and is not a recommendation to buy or sell any security. 4) The article does not constitute investment advice. Each reader is encouraged to consult with his or her individual financial professional and any action a reader takes as a result of information presented here is his or her own responsibility. By opening this page, each reader accepts and agrees to Streetwise Reports’ terms of use and full legal disclaimer. This article is not a solicitation for investment. Streetwise Reports does not render general or specific investment advice and the information on Streetwise Reports should not be considered a recommendation to buy or sell any security. Streetwise Reports does not endorse or recommend the business, products, services or securities of any company mentioned on Streetwise Reports. 5) From time to time, Streetwise Reports LLC and its directors, officers, employees or members of their families, as well as persons interviewed for articles and interviews on the site, may have a long or short position in securities mentioned. Directors, officers, employees or members of their immediate families are prohibited from making purchases and/or sales of those securities in the open market or otherwise from the time of the interview or the decision to write an article until three business days after the publication of the interview or article. The foregoing prohibition does not apply to articles that in substance only restate previously published company releases.