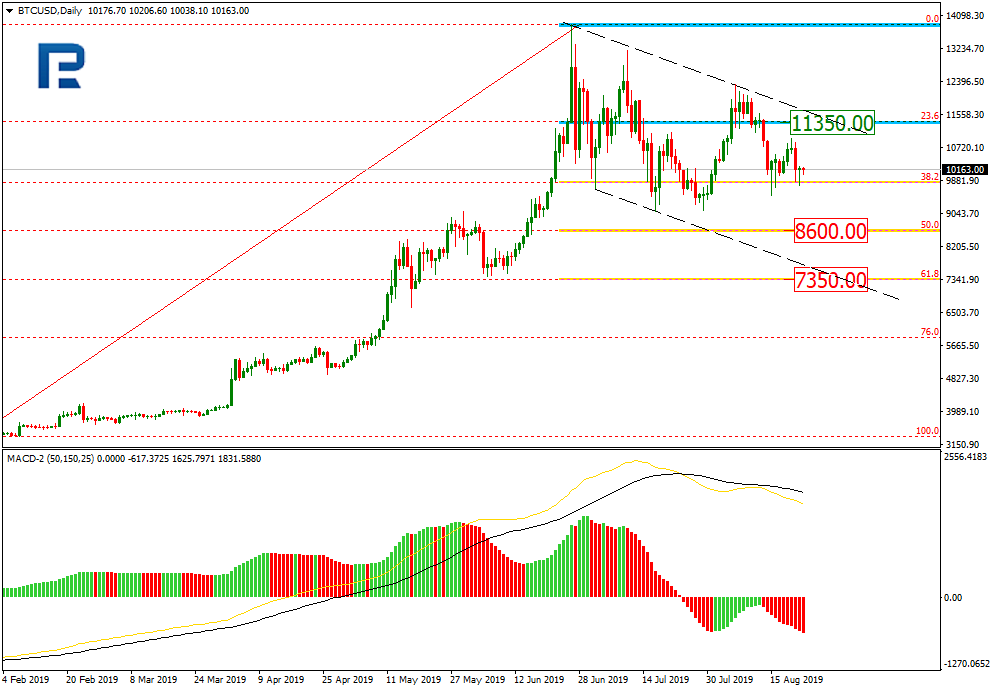
As we can see in the daily chart, BTCUSD has tested 38.2% fibo again. The previous rising impulse couldn’t continue moving towards the high. The resistance is 23.6% fibo at 11350.00. Judging by MACD, the current decline may continue, that’s why after breaking its local lows, the instrument may fall towards 50.0% and 61.8% fibo at 8600.00 and 7350.00 respectively.
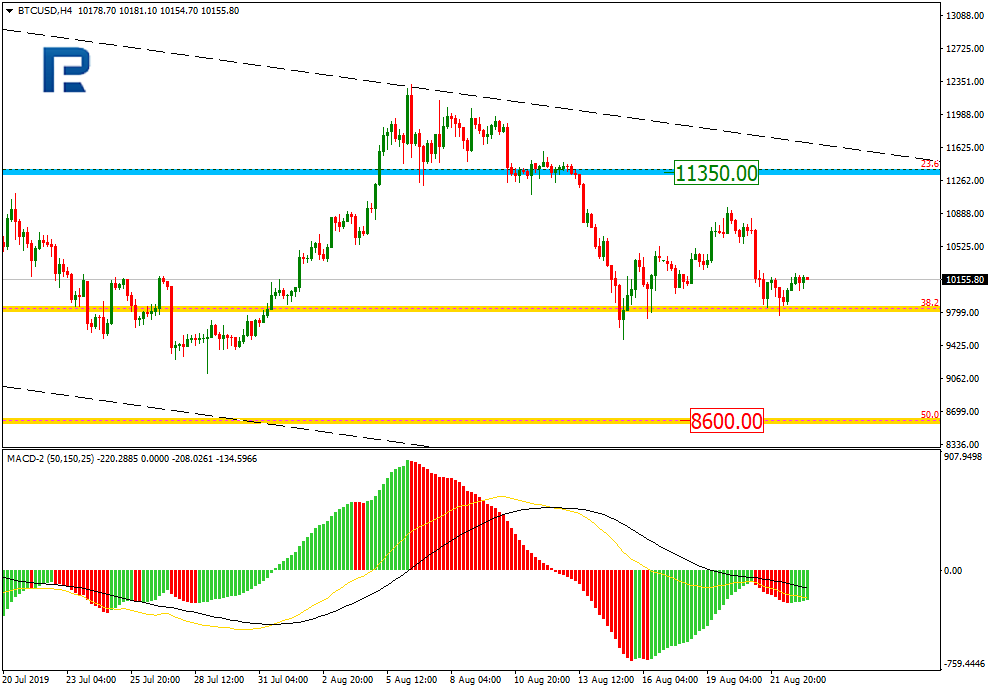
In the H4 chart, highs and lows are getting closer to each other, which means that the pair is consolidating. Possibly, the price may grow to reach 23.6% fibo at 11350.00 again in the nearest future. However, the major tendency remains descending.
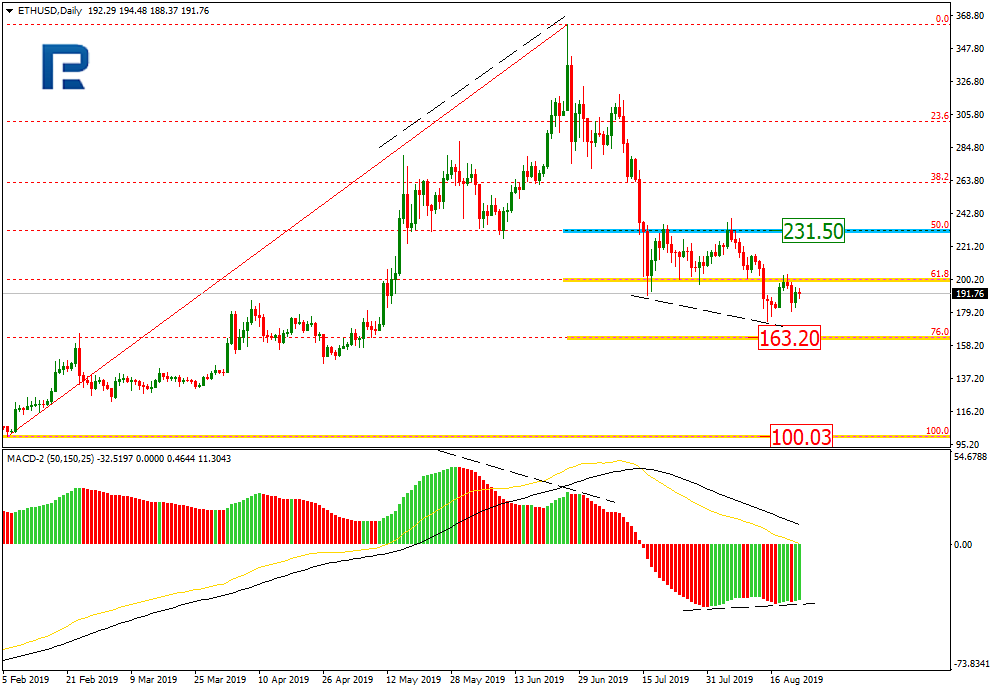
ETHUSD, “Ethereum vs. US Dollar”
As we can see in the daily chart, the convergence made the pair start a new pullback, which has quickly reached 61.8% and 76.0% fibo. The resistance is 50.0% fibo at 231.50, which may be the target of the correction. The target of the next impulse may be 76.0% fibo at 163.20).
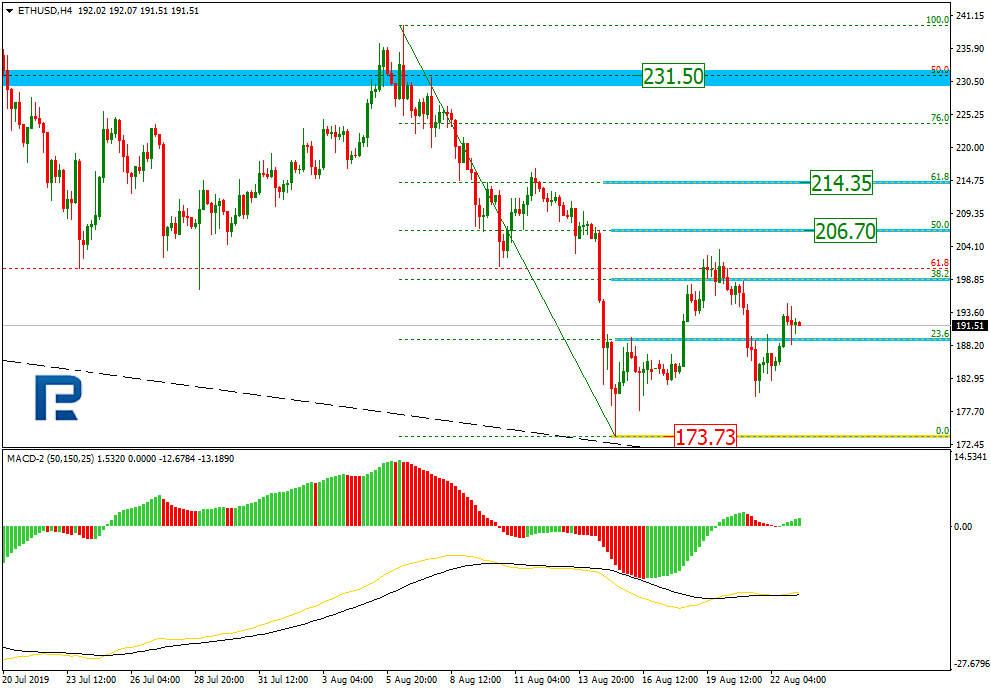
In the H4 chart, the instrument is being corrected to the upside; the first correctional wave has already reached 38.2% fibo. The next targets may be 50.0% and 61.8% fibo at 206.70 and 214.35 respectively.
Attention! Forecasts presented in this section only reflect the author’s private opinion and should not be considered as guidance for trading. RoboForex LP bears no responsibility for trading results based on trading recommendations described in these analytical reviews.
It was a lackluster week for the yellow metal this week. Sellers stepped in to take price lower from the 1522.75 level. Gold was weighed on over the week by the rise in USD which was lifted by the July FOMC minutes. The release was eagerly awaited by traders looking to gauge the likelihood of further rate cuts this year as well as how many potential cuts to expect.
However, the minutes’ release left the market disappointed. They failed to provide any new information. They also downplayed the potential for further cuts, referring to the rate cut as a “mid-cycle adjustment”.
The minutes noted:
“Most participants viewed a proposed quarter-point policy easing at this meeting as part of a recalibration of the stance of policy, or mid-cycle adjustment, in response to the evolution of the economic outlook over recent months. A number of participants suggested that the nature of many of the risks they judged to be weighing on the economy. The absence of clarity regarding when those risks might be resolved. Thus highlighting the need for policymakers to remain flexible and focused on the implications of incoming data for the outlook.”
In response to the release, pricing for a September rate cut came off slightly, which led USD higher, weighing on gold prices. An easing of tensions between the US and China has also allowed for some selling on gold. We have seen reduced safe-haven inflows this week. The two nations are due to meet in September for a further round of talks which looks set to happen at the moment.
However, the troubling situation in Hong Kong presents risks. While the US has warned that a trade deal could be difficult to do if China uses force on protestors, China has warned the US to stay out of the situation or risk the trade talks collapsing again. As such, the situation remains fragile and there is plenty of upside risk for gold.
Gold prices paused in their ascent this week with the major 1522.75 level remaining firm resistance for now. Gold prices remain firmly bullish, however. While above the 1433.58 level, focus is on a further push higher. The 1566.15 level is the next topside zone to watch.
Silver
Silver prices have been softer this week also. Prices have pulled back from recent highs, as a stronger US dollar has dampened upside for now. Silver had been tracking the recent rally in gold, breaking out to their highest levels since early 2018. Escalating trade tensions between the US and China fuelled the gains.
But, tensions have eased somewhat. This is due to the US having postponed a portion of the new 10% tariffs due September 1st until a later date. Markets are more optimistic that a deal will be reached.
Silver prices remain capped by the 17.3336 level for now, following a brief move above the level last week. The 16.5877 level underpinned the move lower. While above here, focus remains on a further grind higher with the 17.6936 level the next topside marker to watch.
The EUR/USD currency pair is still moving sideways. The technical picture remains ambiguous. Participants in financial markets took a wait-and-see attitude before today’s speech by Fed Chairman Jerome Powell at the Jackson Hole Symposium. The official may provide new information regarding the Central Bank’s monetary policy. Investors will also evaluate statistics on the real estate market in the United States. At the moment, the local support and resistance levels are: 1.10600 and 1.10850, respectively. Positions must be opened from these levels.
The Economic News Feed for 23.08.2019:
– speech by the head of the Federal Reserve, Mr. Powell (US) – 17:00 (GMT + 3: 00);
– sales of new housing in the United States (US) – 17:00 (GMT+3:00);
Indicators do not give accurate signals: 50 MA crossed 100 MA.
The MACD histogram is in the negative zone and below the signal line, which gives a strong signal to sell EUR/USD.
The Stochastic Oscillator is in the neutral zone, the %K line is above the %D line, which also indicates bullish sentiment.
Trading recommendations
Support levels: 1.10600, 1.10300, 1.10000
Resistance levels: 1.10850, 1.11100, 1.11300
If the price consolidates above 1.10850, expect a correction toward 1.11200-1.11400.
Alternatively, the quotes could decrease toward 1.10300-1.10000.
The GBP/USD currency pair
Technical indicators of the currency pair:
Prev Open: 1.21233
Open: 1.22533
% chg. over the last day: +1.02
Day’s range: 1.22190 – 1.22618
52 wk range: 1.2015 – 1.3385
Yesterday, aggressive purchases were observed on the GBP/USD currency pair. The quotes grew above 1%. The pound has updated key highs. The trading instrument is currently consolidating. The local support and resistance levels are 1.22150 and 1.22650. GBP can recover further. Today, investors will evaluate the speech of Fed Chairman Jerome Powell at the Jackson Hole Symposium. Positions must be opened from key levels.
The Economic News Feed for 23.08.2019 is calm.
Indicators point to the strength of buyers: the price has fixed above 50 MA and 100 MA.
The MACD histogram is in the positive zone, but below the signal line, which gives a weak signal to buy GBP/USD.
The Stochastic Oscillator started to go out of the oversold zone, the %K line is above the %D line, which also gives a signal to buy GBP/USD.
Trading recommendations
Support levels: 1.22150, 1.21750, 1.21450
Resistance levels: 1.22650, 1.23000
If the price consolidates above 1.22650, expect further growth toward 1.23000.
Alternatively, the quotes could decrease toward 1.21800-1.21600.
The USD/CAD currency pair
Technical indicators of the currency pair:
Prev Open: 1.32849
Open: 1.33025
% chg. over the last day: +0.04
Day’s range: 1.32926 – 1.33265
52 wk range: 1.2727 – 1.3664
The technical picture on the USD/CAD currency pair is still ambiguous. CAD continues to consolidate. The local support and resistance levels can be distinguished at 1.32900 and 1.33250, respectively. Financial market participants expect important economic releases from Canada. We also recommend that you pay attention to the dynamics of the oil prices. Positions must be opened from key levels.
At 15:30 (GMT+3:00 Canada will publish a report on retail sales.
Indicators do not give accurate signals, 50 MA crossed 100 MA.
The MACD histogram is in the positive zone, which points to a bullish mood.
The Stochastic Oscillator is in the overbought zone, the %K line crossed the %D line. There are no signals at this time.
Trading recommendations
Support levels: 1.32900, 1.32550, 1.32150
Resistance levels: 1.33250, 1.33450, 1.33700
If the price consolidates above 1.33250, expect further growth 1.33500-1.33700.
Alternatively, the quotes can drop toward 1.32600-1.32400.
The USD/JPY currency pair
Technical indicators of the currency pair:
Prev Open: 106.623
Open: 106.428
% chg. over the last day: -0.14
Day’s range: 106.388 – 106.655
52 wk range: 104.97 – 114.56
The USD/JPY currency pair is still in sideways movement. Unidirectional trends are not observed. The trading instrument continues to test the key support and resistance levels: 106.200 and 106.650, respectively. Today, investors will be focused on the Jackson Hall Symposium. We also recommend keeping track of up-to-date information regarding the US-China trade conflict. Positions must be opened from key levels.
Today, the news background on the Japanese economy is quite calm.
Indicators do not give accurate signals: 50 MA crossed 100 MA.
The MACD histogram is near the 0 mark.
The Stochastic Oscillator is near the overbought zone, the% K line crossed the% D line. There are no signals at the moment.
Trading recommendations
Support levels: 106.200, 105.750, 105.500
Resistance levels: 106.650, 107.000
If the price consolidates above 106.650, expect further growth toward 107.000-107.200.
Alternatively, the quotes can drop toward 105.850-105.700.
The US dollar has moved away from local highs against a basket of major currencies. US President Donald Trump has criticized the Fed’s actions on Twitter again. The President believes that the Fed does not provide adequate support to the US economy. Meanwhile, Kansas City Federal Reserve President, Esther George, said that the Fed aimed to promote maximum employment and price stability. That is why the regulator does not intend to reduce the interest rate sharply. Investors expect a speech by Fed’s Chairman, Jerome Powell, at the Jackson Hole Summit to be held today. The US dollar index (#DX) closed the trading session in the negative zone (-0.12%).
Quite optimistic economic data from the Eurozone and the US were published yesterday. Thus, German services PMI rose to 43.6 in August instead of 43.0. Manufacturing PMI in the Eurozone also grew by 47.0 in August, although experts forecasted 46.3. Initial jobless claims in the US fell to 209K instead of 216K. Today, we expect economic data from Canada and the US.
The “black gold” prices are consolidating. At the moment, futures for the WTI crude oil are testing the $55.30 mark per barrel.
Market Indicators
Yesterday, there was a variety of trends in the US stock markets: #SPY (-0.03%), #DIA (+ 0.20%), #QQQ (-0.32%).
The 10-year US government bonds yield has been recovering. At the moment, the indicator is at the level of 1.65-1.66%.
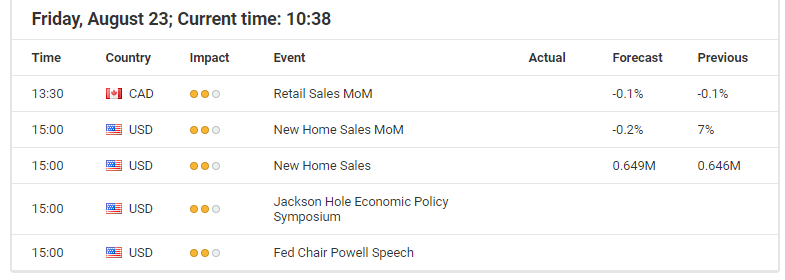
The news feed for 2019.08.23:
– Report on retail sales in Canada at 15:30 (GMT+3:00); – New home sales in the US at 17:00 (GMT+3:00).
At 17:00 (GMT+3:00), the Fed’s Chairman will speak at the Jackson Hole Symposium.
Since the economic calendar is quite thin into the weekly close, all eyes will likely be on Fed chairman Powell’s speech from the symposium in Jackson Hole.
This is particularly true in regards to the USD/JPY, after the BoJ confirmed on Wednesday that deputy governor Wakatabe attends the Jackson Hole symposium instead of Haruchiko Kuroda, meaning that no significant, market-moving news from Japan’s central bank should be expected.
While US-Treasury yields seem to find at least a short-term bottom over the last few days (going hand in hand with no further escalation in the trade dispute between the US and China), the JPY saw no significant gains against the US dollar.
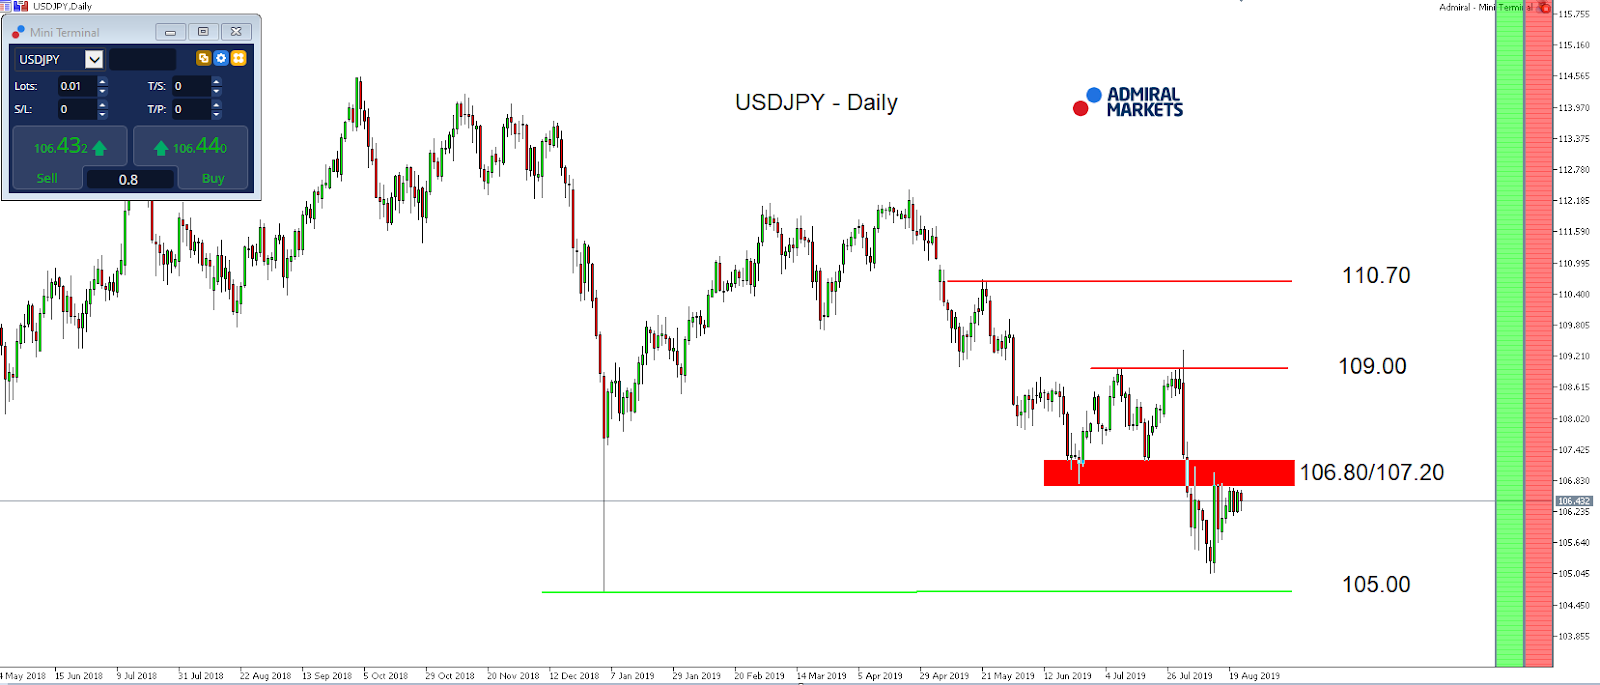
Still, the USD/JPY couldn’t recapture 106.80/107.00. The main reason is probably that market participants, with interest rates making historic moves globally, expect Fed chair Powell in Jackson Hole to clarify the intentions of the US central bank in regards to further rate cuts.
And in addition to that, the latest tweets from US president Trump last Monday, where he started to talk the first time about “some quantitative easing” from the Fed, one could probably also expect some hints from Powell in regards to extraordinary monetary policy measures like re-launching QE anytime soon and if further rate cuts aren’t working in case of an economic downturn.
With that in mind, we stay bullish for the JPY against the USD, technically as long as we trade below 106.80/107.00, where we expect another stint to 105.00 and even lower.
Recapturing 106.80/107, on the other hand, could trigger a deeper regressive move in the days to come to around 108.50/109:
Source: Admiral Markets MT5 with MT5-SE Add-on USD/JPY Daily chart (between May 24, 2018, to August 22, 2019). Accessed: August 22, 2019, at 10:00pm GMT – Please note: Past performance is not a reliable indicator of future results, or future performance.
In 2014, the value of USDJPY increased by 13.7%, in 2015, it increased by 0.5%, in 2016, it fell by 2.8%, in 2017, it fell by 3.6%, in 2018, it fell by 2.7%, meaning that after five years, it was up by 4.1%.
Discover the world’s #1 multi-asset platform
Admiral Markets offers professional traders the ability to trade with a custom, upgraded version of MetaTrader 5, allowing you to experience trading at a significantly higher, more rewarding level. Experience benefits such as the addition of the Market Heat Map, so you can compare various currency pairs to see which ones might be lucrative investments, access real-time trading data, and so much more. Click the banner below to start your FREE download of MT5 Supreme Edition!
Disclaimer: The given data provides additional information regarding all analysis, estimates, prognosis, forecasts or other similar assessments or information (hereinafter “Analysis”) published on the website of Admiral Markets. Before making any investment decisions please pay close attention to the following:
This is a marketing communication. The analysis is published for informative purposes only and are in no way to be construed as investment advice or recommendation. It has not been prepared in accordance with legal requirements designed to promote the independence of investment research, and that it is not subject to any prohibition on dealing ahead of the dissemination of investment research.
Any investment decision is made by each client alone whereas Admiral Markets shall not be responsible for any loss or damage arising from any such decision, whether or not based on the Analysis.
Each of the Analysis is prepared by an independent analyst (Jens Klatt, Professional Trader and Analyst, hereinafter “Author”) based on the Author’s personal estimations.
To ensure that the interests of the clients would be protected and objectivity of the Analysis would not be damaged Admiral Markets has established relevant internal procedures for prevention and management of conflicts of interest.
Whilst every reasonable effort is taken to ensure that all sources of the Analysis are reliable and that all information is presented, as much as possible, in an understandable, timely, precise and complete manner, Admiral Markets does not guarantee the accuracy or completeness of any information contained within the Analysis. The presented figures refer that refer to any past performance is not a reliable indicator of future results.
The contents of the Analysis should not be construed as an express or implied promise, guarantee or implication by Admiral Markets that the client shall profit from the strategies therein or that losses in connection therewith may or shall be limited.
Any kind of previous or modeled performance of financial instruments indicated within the Publication should not be construed as an express or implied promise, guarantee or implication by Admiral Markets for any future performance. The value of the financial instrument may both increase and decrease and the preservation of the asset value is not guaranteed.
The projections included in the Analysis may be subject to additional fees, taxes or other charges, depending on the subject of the Publication. The price list applicable to the services provided by Admiral Markets is publicly available from the website of Admiral Markets.
Leveraged products (including contracts for difference) are speculative in nature and may result in losses or profit. Before you start trading, you should make sure that you understand all the risks.
The US Census Bureau will be releasing the monthly statistics on new home sales for the month of July. The data is expected to show a 6% increase on a month over month basis, to 645k units.
In June, new home sales rose 7%, to 646k units on a monthly basis. The new home sales report has been in a steady upward trend since the mid-2008 period, reaching the current level of 646k units in June 2019.
The median price of new homes sold during June was at $310,400 while the average price of new homes was $368,000.
US New Home Sales, June 2019
The forecasts for July new home sales, although slightly lower than the June’s headline print, remains broadly in line with the trends.
The data underscores the fact that new home sales have been nudging steadily higher since the past decade. The current interest rate conditions and a strong labor market continue to support a steady increase in the new home sales report.
In July, the Federal Reserve lowered interest rates by a quarter basis point. This typically has an impact on mortgage rates. US mortgage rates are trending lower, which leads to renewed interest in sales of newly constructed homes.
However, we could expect to see some revisions to past data. For example, the new home sales report for May was revised to 604k, down from the 626k initially reported. We can expect to see revisions to the June data as well. This is because the new home sales report is based on a small sample survey. As a result, revisions are common to previous data.
Housing Markets Continue to Paint a Mixed Picture of the Economy
Various other indicators covering the housing markets remain mixed. The recently released housing starts, which measures the number of residential buildings that started construction fell to 1.19 million.
This was a 4% increase in the month of July and about 0.6% higher from July 2018’s measure of 1.184 million. The housing markets tend to see a boom during the summer months. The seasonality tends to fade away into the latter parts of the year.
Thus, we anticipate a potential increase into the July and August months before the housing data cools off from September onward.
While the lower interest rates are seen as a boom for new homeowners, the economic uncertainty casts a shadow. So far, the US labor markets have managed to underpin growth. But there is evidence that the momentum is fading.
Consumer spending is another indicator to watch out for. It measures the amount spent by US consumers at retail outlets. Consumer spending gives us a glimpse into consumer sentiment, which is high at the moment. However, this seems to be due to the lagging effect.
Quite recently, the threat of recession has once again reared its ugly head. Investors are concerned, especially after the 2-year and the 10-year treasury yields inverted. The Federal Reserve is likely to respond with another rate cut further down the line.
For the moment, the data on the housing sector which runs into the third quarter could remain in line with the current trends. But the fourth-quarter data could be dampened if the economic outlook continues to deteriorate.
One of the first indicators will, of course, be the wage growth report. On the supply side, the housing starts data will also give an early indication into the pace of construction of new residential units.
While the data for July could be in line with estimates, investors will be more focused on the outlook in the coming months.
The flash manufacturing data from the IHS Markit showed that manufacturing PMI contracted. This was the first contraction for the first time since 2009. The manufacturing PMI fell to 49.9 in August. This was below expectations of 50.5 and down from 50.4. The flash services PMI also fell to 50.9, down from 53.0 from the month before.
Eurozone Flash PMI’s Fare Better than Expected
The flash PMI’s from IHS Markit for the eurozone came out better than expected. Manufacturing, services PMI advanced to 47.0 and 53.4 for the month of August. The jump in the PMI’s, though, did not see a much reaction from the euro currency. However, the bond markets reacted favorably with yields accelerating after the release of the report. The data comes after weeks of downbeat data.
EURUSD Turns Flat
The currency pair has been consolidating within the levels of 1.1100 and 1.1065 for the past few days. The range established comes after the bearish flag pattern emerged. A breakdown below 1.1065 is required for the euro to extend declines. The minimum downside target is at 1.1008. However, in the event of an upside breakout from the range, the bearish pattern could be invalidated.
Sterling Jumps on Merkel’s Comments on Brexit
The pound sterling posted gains on Thursday. This came as the German chancellor, Angela Merkel said that the EU and the UK could reach a deal on the Irish backstop agreement before the Oct 30th deadline. However, the remarks were contradictory to the earlier statement where the EU said that the UK should find a solution within 30-days. The currency advanced on hopes that the UK could still manage a soft-Brexit.
Can the GBPUSD Sustain the Gains?
The gains in the cable come as expected, following the descending wedge pattern that was formed. The current gains could push GBPUSD towards at least the 1.2511 level. However, given that there is a strong hidden bearish divergence showing on the charts, there is a possibility for the currency to correct lower. The resistance level formed at 1.2170 will be likely tested as support ahead of further gains.
Gold Prices Continue to Hold Steady
The precious metal was seen making no major gains or declines on Thursday. Prices held steady as investors shunned the Fed meeting minutes. The markets were largely unmoved. Meanwhile, equity markets managed to post some modest gains on the day but retreated back from the intraday highs.
XAUUSD Could Soon Break Out From the Range
The precious metal is expected to break out from the range established. Gold has been trading within the 1508 and 1485 levels. This comes near the top end of the rally. The consolidation comes within the larger ascending triangle pattern near the highs. Price action could potentially see a breakout from this level. The bias currently remains to the upside, unless prices breakdown below the 1485 handle.
On Thursday the 22nd of August, trading on the euro closed slightly down. It was a volatile day for the single currency. We got some sharp fluctuations in response to Angela Merkel’s comments on Brexit, which pushed the pound up 150 pips against the US dollar. It later turned out that markets had misinterpreted her comments, and has opened long positions on the pound without verifying the information.
What Merkel said was that the EU and the UK may have time to find a solution by the 31st of October that would eliminate the need for the so-called Irish backstop. British media interpreted this as meaning that a solution would be found in time, although Merkel simply referenced the 31st of October as this is the date on which the UK intends to leave the EU.
The GBPUSD pair didn’t fall back. The correction on the pound gathered pace today as the dollar made gains across the board.
Day’s news (GMT+3):
15:30 Canada: retail sales (Jun).
17:00 US: new home sales (Jul).
20:00 US: Baker Hughes US oil rig count.
Current situation:
As expected, the pair remained within the sideways trend. The bears were held up by the 1.1066 support. Judging by the timing and the wave structure, there’s an increased risk of dropping to 1.1047. Given that trading has been flat for the last 6 days, it’s not worth considering a drop as far as 1.1020. It’s better to highlight 1.1047 as an intermediate level, from which we could get a bounce.
Markets are in wait-and-see mode ahead of US Fed Chair Jerome Powell’s speech in Jackson Hole. Nobody knows what he will say at the symposium, so if we don’t get any news from the UK or Italy, markets should be calm up until 17:00 (GMT+3). There’s a resistance level at 1.1088.
The U.S. could “drown the world in oil” over the next decade, which, according to Global Witness, would “spell disaster” for the world’s attempts to address climate change.
The U.S. is set to account for 61 percent of all new oil and gas production over the next decade. A recent report from this organization says that to avoid the worst effects of climate change, “we can’t afford to drill up any oil and gas from new fields anywhere in the world.” This, of course, would quickly cause a global deficit, as the world continues to consume around 100 million barrels per day (bpd) of oil.
Global Witness notes that the industry is not slowing down in the United States, notwithstanding recent spending cuts by independent and financially-strapped oil and gas firms. If anything, the consolidation in the Permian and other shale basins, increasingly led by the oil majors, ensures that drilling will continue at a steady pace for years to come.
It isn’t as if the rest of the world is slowing down either. The global oil industry is set to greenlight $123 billion worth of new offshore oil projects this year, nearly double the $69 billion that moved forward last year, according to Rystad Energy. In fact, while shale drilling has slowed a bit over the past year amid investor skepticism and poor financial returns, offshore projects have begun to pick up pace.
But that trend might turn out to be just a blip. The U.S. is still expected to account of the bulk of new drilling and the vast majority of new production, with much of that coming from shale. Already, the U.S. is the world’s largest producer of both oil and natural gas. And the pace has accelerated in recent years. In 2018, U.S. oil and gas production increased by 16 and 12 percent, respectively. According to the EIA, the U.S. surpassed Russia in terms of gas production in 2011, claiming the top spot, and it surpassed Saudi Arabia in oil production last year.
Going forward, new production from the U.S. will be eight times larger than the next largest source of growth, which is Canada. In fact, the U.S. will add 1.5 times more oil and gas than the rest of the world combined, according to Global Witness.
But because so much drilling in the U.S. is concentrated in a few areas, individual U.S. states on their own tower over the rest of the world. If Texas were a country, it would account for the most new oil and gas production in the world. Between 2020 and 2029, Texas could account for 28 percent of all additional output, Global Witness says.
Canada and Pennsylvania tie for second and third with 7 percent each. Then comes New Mexico at 5 percent of the growth and North Dakota at 4 percent. Oklahoma, Brazil, Colorado, Russia and Ohio are all tied at 3 percent a piece.
In other words, 7 out of the top 10 sources of new oil and gas production globally over the next decade are U.S. states.
“If things don’t change, by the end of the next decade, new oil and gas fields in the US will produce more than twice what Saudi Arabia produces today,” Global Witness said in its report.
This presents a massive challenge. “To avoid the worst impacts of climate change, our analysis shows that global oil and gas production needs to drop by 40% over the next decade. Yet, instead of declining, US oil and gas output is set to rise by 25% over this time, fueled by expansion in new fields,” the report warned.
Asian stocks are set to end the week on a mixed note after the S&P 500 ended little changed, as investors eagerly await potential policy signals by Fed chair Jerome Powell later today. Currently, markets fully expect US interest rates to be lowered again in September, while the Fed funds futures point to at least one more rate cut in the final quarter of 2019.
Although the latest US manufacturing PMI figures unexpectedly dipped into contraction territory, data related to the jobs markets as well as retail sales suggest that US consumers are able to keep economic growth momentum going. Unless the hard-economic data suggests a steep decline in the US economy’s trajectory, assuming that the Fed adheres to its data-dependent stance, then policymakers need not embark on a major easing cycle. Instead they can be contented with just some “insurance” rate cuts.
Still, policymakers and investors remain cognizant of the economic headwinds that are gathering force, given that the US-China trade conflict threatens to drag on. For now, it all comes down to Powell’s projected bias on Friday – does he insist on the robustness of the US economy, or does he highlight the growing downside risks? Investors’ interpretation of Powell’s policy bias is set to sway markets, whereby a less-dovish tone could encourage risk sentiment while pushing the Dollar higher.
GBPUSD punches above 1.220 amid renewed signs that Brexit deal remains on the table
The Pound rose one percent to climb above the 1.225 level against the US Dollar for the first time this month, amid reinvigorated hopes that a Brexit deal remains in play. Recent comments by French President Emmanuel Macron and German Chancellor Angela Merkel indicate that the desire to avert a no-deal Brexit remains evident among key EU members, despite the UK’s seemingly hardline stance under Prime Minister Boris Johnson.
Any optimism around the prospects of a Brexit deal has to be taken with a huge dose of caution, given that markets have been left sorely disappointed time and time again over the course of this drawn-out Brexit saga. It remains to be seen how the various stakeholders, from Westminster to the EU establishment, can navigate the complexities involved in the UK’s decision to quit the European Union, and whether there’s enough political will to reach a deal that is palatable to all sides.
Brent’s upside capped as demand-side uncertainties weigh on markets
Brent Oil is set to clinch a weekly gain of over two percent, despite its reluctance to stray too far away from the $60/bbl level this week. Even with risk sentiment edging higher this week, evidenced by the slight gains in global equities and Gold’s drop below the $1500 mark, concerns over a global recession continues to hover over the markets.
The outlook for worldwide demand could get gloomier if the US-China conflict remains intact, which should in turn cap Oil’s upside. Oil bulls will be hoping that the current OPEC+ supply cuts will be enough to put a floor below prices, although a rapid deterioration in global economic conditions would only trigger another slide in crude prices and could see Brent testing the $55/bbl support level.
Disclaimer: The content in this article comprises personal opinions and should not be construed as containing personal and/or other investment advice and/or an offer of and/or solicitation for any transactions in financial instruments and/or a guarantee and/or prediction of future performance. ForexTime (FXTM), its affiliates, agents, directors, officers or employees do not guarantee the accuracy, validity, timeliness or completeness, of any information or data made available and assume no liability as to any loss arising from any investment based on the same.