While the surging gold price has received most of the spotlight in the market, silver will outperform the king monetary metal over the longer term. Key fundamental factors make silver the more attractive asset and investment to own versus gold when we look closely at the data.
However, that doesn’t mean precious metals investors shouldn’t own gold. Investors need to own both precious metals, but I believe silver will provide better returns than gold in the future.
Now, there is this notion put forth by many precious metals analysts that central banks will be forced, at some point, to back their currencies by gold. Thus, the idea is that gold will reset at a much higher price.
While that is a possibility, backing debt-based currencies with gold will not solve our coming energy crisis. And, let me tell you, it’s an energy predicament that we have no real solution.
You see, it doesn’t really matter if we back fiat money with gold. The REAL ISSUE has always been ENERGY. The massive increase in debt and derivatives are a symptom of the Falling EROI (Energy Returned On Investment) of oil. Basically, while gold may solve certain issues in regards to “Confidence” in money, it doesn’t fix our energy problems.
I touched on this briefly in my newest video, Why Silver Is Better Than Gold. However, most of the video explains new charts that show fundamental factors on why silver is a better investment than gold as well as some key price levels for the short term.
One of the more important charts in the video shows the amount of “Identifiable” physical gold and silver investment stocks. Interestingly, according to the data from the World Gold Council and the World Silver Surveys, there is just about the same amount of physical gold investment as there is silver.
These official sources estimate there are about 2.4 billion ounces of gold and 2.45 billion ounces of silver held in public and private vaults, including central bank holdings. Yes, there is likely a great deal of physical gold and silver held by investors at home or in secret vaults that are not included in those figures. But, these amounts still wouldn’t change the values of these metals all that much.
For example, even if we assume, there might be another 2.5 billion oz of physical silver investment held by investors, that would only increase the value of the total physical silver investment to say, $100 billion. Still, a drop in the bucket compared to the over $465 trillion in Global Real Estate, Bonds and Stocks.
I have included several new fundamental charts in the video on why silver will outperform gold on the longer-term basis. Also, some updated silver price charts show where I believe are the next important levels for silver.
The Money Metals News Service provides market news and crisp commentary for investors following the precious metals markets.
Precious metals expert Michael Ballanger discusses trends in the market and his recent trades.
For those of you that have followed my raves and rants over the years, you are undisputedly aware of all of my biases when it comes to almost everything: bankers, politicians, invasive species, free market suppression, entitled Millennials, and finally, the utility of precious metals in a “financial order gone wild,” which is precisely where we reside today.
I sat on the stern platform of my boat looking at the moon you see rising in the photo above and over a number of well-oiled glasses of Pinot Grigio, I snapped the photo thinking that soon the sound of lamenting loons would be replaced by the torturous howl of timber wolves, a sound vivid in my memories from boyhood excursions in Algonquin Park. It is said that the most beautiful sound in all of nature is the final wail of the black swan in its dying moments, a sound so powerful that the ultra-famous rock band “Led Zeppelin” named their “Swan Song” record label after it.
Well, while financial events do not normally involve sounds, the haunting specter of seeing over 65% of all bonds issued around the world paying a negative return evokes memories of a “bad moon rising” of which ancient folklore of the lunar omen has filtered down through generation after generation. The problem here in 2019 is that NO generation has EVER encountered a financial instrument paying a negative yield because if you buy one, you have to pay the issuer to hold it. This absolute insanity is the nuclear torpedo in that is heading for the starboard side of the Good Ship “Modern Monetary Theory” as she steams headlong into the abyss becoming rapidly known as the “Japanification” of all things financial.
It began in Japan, where the deification of the American system of finance began shortly after Hiroshima and Nagasaki, whereby the lesson thereof taught a generation of Japanese investors that, when it comes to the Yanks, copy whatever they do but do it in triplicate. When the stock market crashed in 1987 and was rescued by the U.S. Fed and Treasury, those actions were absolutely revered by the Japanese such that five years later, they embarked on a market-rescue campaign that put the Greenspan/Reagan Working Group on Capital Markets to shame. In 2008, the Great Financial Crisis er bank bailout sanctioned by the U.S. Congress had such an astoundingly positive superficial effect that not only the Japanese took notice, but another lurking leviathan called the People’s Republic of China took the baton, increased its size by ten feet, weaponized it with a laser beam, and not only ran with it, they strapped jet engine turbines to their backs and rocketed into the ionosphere of unprecedented credit creation and monetary reflation.
So today, we not only have the Great American Military Machine kept alive by life support mechanisms designed to keep the U.S. dollar strong and in demand as the world’s reserve currency, we have the major global economic regions all run by governments that have a coordinated and comingled commitment to total currency debasement and the complete annihilation of the purchasing power of their respective currencies. Saving money is archaic and reckless; debt management is avant-garde and prudent. The beguiling dying moan of the swan is the sound reverberating through the walls of central banks and houses of parliament or congress because the global financial system is drowning, choking, asphyxiating on its regurgitant debt load and there is absolutely nothing that anyone can do to prevent its mortal demise. And you wonder why gold just hit a six-year high?
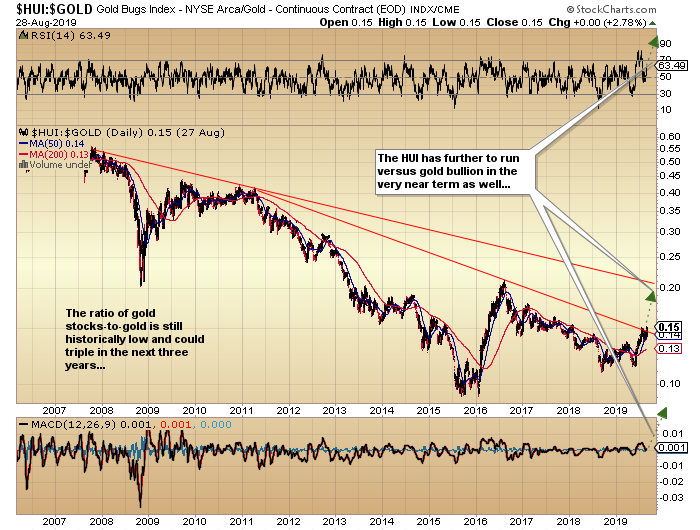
The gold miners smell better times ahead and for those of you too young (or too old) to remember the gold old days of 20022011, the HUI (NYSE Arca Gold BUGS Index)-to-gold ratio peaked in the 0.550.60 range in the 20062008 period, and that was with gold bullion under $1,000. Today at $1,548, the ratio is one quarter of that level, having risen since the late 2015 lows at 0.091 to the current 0.15 level. The point I make is that the gold miners that choose to live or die by the sword of unhedged production carry enormous leverage to rising gold (and silver) prices. Secondly, the gold miners as represented by the HUI, are leading, not lagging, indicators for gold and silver prices and are confirming indicators for the major trend in gold.
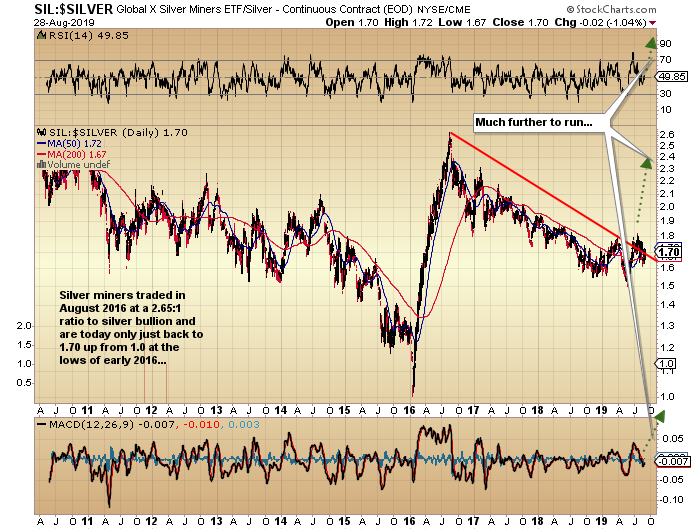
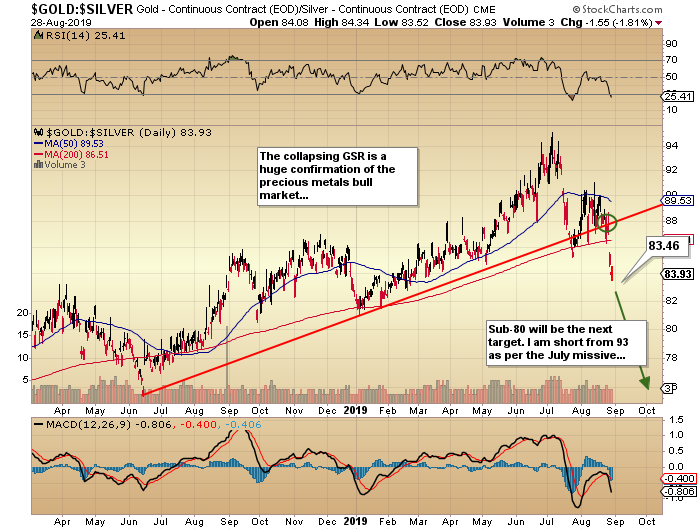
Looking to silver (the “divorcee-maker”), it is much the same story with silver stocks still well below the highs of August 2016. What is compelling is that the gold-to-silver ratio (GSR)(I used to call it the “GTSR” but have since shortened it because the really important gurus use only three letters ), it now carries an 83 handle down from 93 where I shorted it last July after taking profits (prematurely would be an understatement) on my leveraged gold miner ETFs, both Senior (NUGT [Direxion Daily Gold Miners]) and Junior (JNUG [Direxion Daily Junior Gold Miners]). These ratios of gold and silver stocks to their underlying metal prices as well as the GSR’s dramatic plunge to 83.64 are compelling testimonials to the power of this bull. GATA’s co-founder Bill Murphy and I are both in undaunted agreement that the action in the silver market is finally, after six years in the dentist’s chair undergoing root canal surgery sans Novocain, the kind of action that resembles, at the very least, a “normal” market, and at best, a very young but raging baby bull. I should point out that lemetropolecafe.com is my “GO-TO” site still after over ten years as a paid subscriber.
This morning I tweeted out a trading idea whereby, in total contradiction to the words printed above, I took profits on half of the SLV (iShares Sliver Trust) October $15.50 calls at $1.80 having paid $0.48 on July 23rd. 3.75 times your money is not to be sneezed at and far too many times have I failed to turn ring the register while in the throes of self-adulation and believing one’s own bullshit. I am also still sitting on only ½ positions in the GDX (VanEck Vectors Gold Miners ETF) and GDXJ (VanEck Vectors Junior Gold Miners ETF), having erred in not buying them back late last week when they were $2 and $4 lower into the pullback.
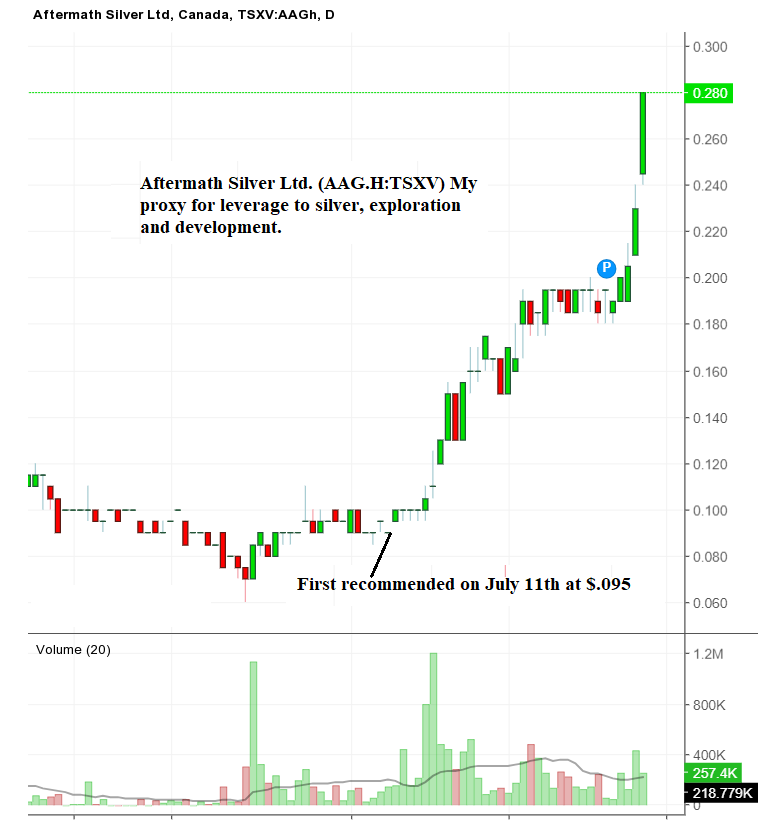
I also am delighted with the action in Aftermath Silver recommended here and on Twitter in the $0.095-$0.10 range on July 11th. That it has absolutely exploded to $0.28 is not surprising to me in the slightest; what is surprising is how quickly it has reacted, proving once again that those companies sitting on a gold or silver resource are perfectly correlated to any movement in the underlying commodity versus the grass roots explorcos that have yet to establish any type of resource. For those that acted on my suggestion back around July 11th, good on you. $30 per ounce silver by year-end could easily see AAG at $0.50 so trade smartly. Silver bull markets are ridiculous with the silver juniors acting like weed and cryptostocks a few years back; ten-baggers are not uncommon
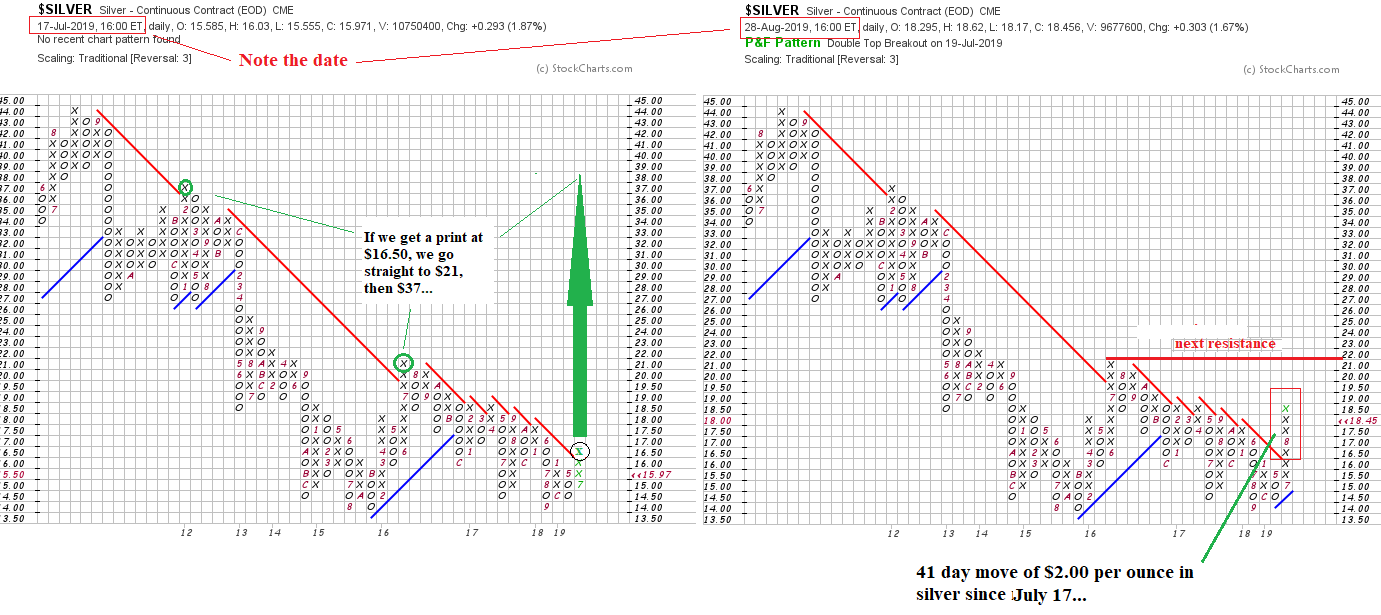
Lastly, I put out a point-and-figure diagram a few weeks ago (July 17th) and as the chart below displays, that $16.50 print did actually occur a day or two after it was posted and sure enough, you can see how silver popped almost as if shot out of a cannon. The P&F says “$21 is coming, then $37!” BUT, you have to understand that P&F’s involve rudimentary price analysis and have zero utility as to timing. So trade accordingly. (No short-term call options advised based on this study )
Finally, as we move forward into the final months of 2019, there will be corrections and there will be surprises but I am taking the approach that we are now officially ensconced in the biggest, wildest, scariest bull market EVER in the precious metals. If gold and silver prices were viewed as monetary beach balls being held underwater by the invisible hand of covert government suppression, they did so with the waters of monetary debasement rising around them such that by last June the waters were fifty meters deep and the upward pressure on those hands was at once both excruciating and unstoppable. At no time in history have so many invisible hands, operating in tandem and in urgency conspired to suppress the prices of gold and silver while at the same time through inverted yield curves, spiraling debt clocks, and negative yield financial instruments allowing the tidewaters of government and central bank incompetence to rise. This precious metals beach ball is exploding toward the surface with unparalleled force and momentum and when it finally reaches escape velocity, the public will be screaming to switch quadrillions of dollars of paper (stocks and bonds) into billions of dollars of physical gold and silver and the associated mining shares in a cacophony of panic and greed. And the sad thing for them and the wondrous thing for us is that there just won’t be enough “product” to go around when that occurs.
Disclosure: 1) Michael J. Ballanger: I, or members of my immediate household or family, own securities of the following companies mentioned in this article: Great Bear Resources, Aftermath Silver, Stakeholder Gold, Western Uranium & Vanadium, Getchell Gold. My company has a financial relationship with the following companies referred to in this article: Western Uranium & Vanadium, Getchell Gold. My firm no longer does consulting work for Stakeholder Gold. I determined which companies would be included in this article based on my research and understanding of the sector. Additional disclosures are below. 2) The following companies mentioned in this article are billboard sponsors of Streetwise Reports: None. Click here for important disclosures about sponsor fees. As of the date of this article, an affiliate of Streetwise Reports has a consulting relationship with Aftermath. Please click here for more information. 3) Statements and opinions expressed are the opinions of the author and not of Streetwise Reports or its officers. The author is wholly responsible for the validity of the statements. The author was not paid by Streetwise Reports for this article. Streetwise Reports was not paid by the author to publish or syndicate this article. Streetwise Reports requires contributing authors to disclose any shareholdings in, or economic relationships with, companies that they write about. Streetwise Reports relies upon the authors to accurately provide this information and Streetwise Reports has no means of verifying its accuracy. 4) This article does not constitute investment advice. Each reader is encouraged to consult with his or her individual financial professional and any action a reader takes as a result of information presented here is his or her own responsibility. By opening this page, each reader accepts and agrees to Streetwise Reports’ terms of use and full legal disclaimer. This article is not a solicitation for investment. Streetwise Reports does not render general or specific investment advice and the information on Streetwise Reports should not be considered a recommendation to buy or sell any security. Streetwise Reports does not endorse or recommend the business, products, services or securities of any company mentioned on Streetwise Reports. 5) From time to time, Streetwise Reports LLC and its directors, officers, employees or members of their families, as well as persons interviewed for articles and interviews on the site, may have a long or short position in securities mentioned. Directors, officers, employees or members of their immediate families are prohibited from making purchases and/or sales of those securities in the open market or otherwise from the time of the interview or the decision to write an article until three business days after the publication of the interview or article. The foregoing prohibition does not apply to articles that in substance only restate previously published company releases. As of the date of this article, officers and/or employees of Streetwise Reports LLC (including members of their household) own securities of Aftermath Silver, a company mentioned in this article.
Charts provided by the author.
Michael Ballanger Disclaimer: This letter makes no guarantee or warranty on the accuracy or completeness of the data provided. Nothing contained herein is intended or shall be deemed to be investment advice, implied or otherwise. This letter represents my views and replicates trades that I am making but nothing more than that. Always consult your registered advisor to assist you with your investments. I accept no liability for any loss arising from the use of the data contained on this letter. Options and junior mining stocks contain a high level of risk that may result in the loss of part or all invested capital and therefore are suitable for experienced and professional investors and traders only. One should be familiar with the risks involved in junior mining and options trading and we recommend consulting a financial adviser if you feel you do not understand the risks involved.
Just a few weeks ago, silver naysayers told us we’d have to wait months, or even years, before the market made a big move. Now they are eating their words!
The white-hot metal surged past $18.50/oz this morning to reach its highest level in more than two years.
Silver is up more than 13% in the month of August alone, a time when many precious metals analysts had expected summer doldrums. Even some long-term silver bulls became short-term bears.
The widespread pessimism toward silver is totally understandable given its performance characteristics over the past few years.
Like clockwork, rallies would stall out at resistance levels. Banks and other commercial traders playing the short side of the futures markets would always overpower the longs.
So when open interest on silver contracts on the COMEX rose significantly last month, it seemed that big institutional short sellers were set up to smash prices back down once again.
That’s certainly what long-term silver bull Craig Hemke of TF Metals Report expected. “JP Morgan and Citi [are] making sure there’s no breakout,” he said on the July 19th Money Metals podcast. “You’ve got to figure that trend is probably going to continue.”
Hemke didn’t think silver would get above the “tremendous amount of bank created and technical resistance” at the $17 level. “That’s why I think gold continues higher and silver continues mostly sideways maybe for another six to eight months,” he concluded.
Oops!
In fairness, nobody gets short-term to intermediate-term forecasts right 100% of the time. Our friend Craig Hemke has gotten a heck of a lot of things right over the years – and he most certainly wasn’t urging long-term investors to bail out of their positions.
I fully believe that what we’re seeing in gold, silver, and the mining shares is the beginning of what may evolve into the greatest metals’ bull market in which you and I have ever participated.
In the early 2000’s, I stated my belief that, before the public-mania phase had been completed a number of years hence, we would see silver prices over $150 an ounce.
This may sound hard to believe.
The reality is this: Trying to trade precious metals market day to day or week to week is almost always a mistake. The trends that really matter occur over periods of months to years.
If you missed the opportunity to buy silver while it was still on the ground floor because you worried prices might sink into the basement, there are a couple good reasons not to fret.
First, silver under $20/oz. is still an amazing bargain. It could double in price and still sit well below its all-time high of over $49/oz. Silver remains cheap versus stocks, bonds, and even gold.
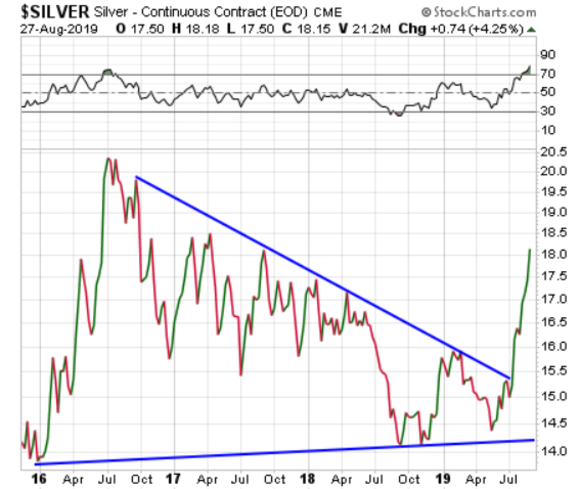
Second, the silver market may finally be due for a pause, if not a pullback. The weekly RSI momentum gauge is in extremely overextended territory, above 70, for the first time since 2016.
That doesn’t necessarily imply a heavy and prolonged pullback will follow like the one that occurred from 2016-2018. Having recently broken out from that consolidation phase and now exhibiting bull market characteristics, silver’s pullbacks are more likely to be sharp and short-lived.
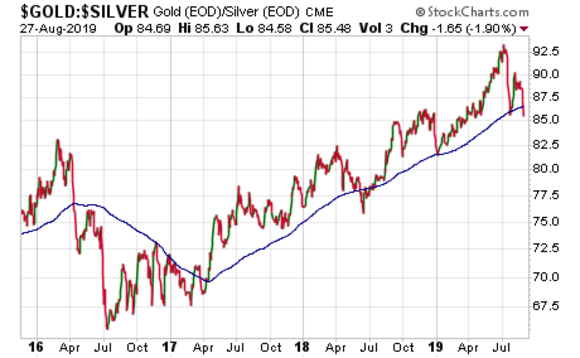
The next upleg in silver will probably coincide with a major trend change in the gold:silver ratio. That ratio hit a quarter-century high above 92:1 earlier this year but has retreated dramatically in favor of silver in recent weeks, today under 83:1.
The ratio seems to trend around its 200-day moving average (the blue line in the chart), which has been pointing up in favor of gold since April 2017.
With the ratio today now having fallen well below the trend line, a confirmed reversal of the major trend in the gold:silver ratio could portend big things ahead for silver prices.
Silver, being the more volatile of the two precious metals, usually outperforms during bull markets.
The naysayers harped on the fact that gold was outperforming through the first half of the year while some of the more virulent anti-silver bugs reiterated their misbegotten belief that silver isn’t money and won’t provide investors any safe-haven from trade wars or recession fears.
It’s true that silver’s biggest demand component is industrial. But in recent weeks the poor man’s gold has completely untethered from copper and other industrial metals that have continued to sink.
Unlike ordinary base metals, silver can move dramatically based on the wild card of physical demand from investors.
Not surprisingly, silver coin sales sank during the 2016-2018 basing out period that left some silver bugs feeling worn out and cynical about the prospects of prices breaking through ceilings in rigged futures markets.
As the legendary Sir John Templeton once said, “Bull markets are born on pessimism, grow on skepticism, mature on optimism, and die on euphoria.”
Fortunately for silver bulls, we’re a long way from euphoria.
The Money Metals News Service provides market news and crisp commentary for investors following the precious metals markets.
After a couple of weeks out of the headlines in terms of economic data, it’s time to check back on Australia.
Next week is likely to be busy Down Under, with a host of key data coming out. We should remember that it was the housing crisis that sparked the latest downturn in Australian expectations. So we naturally want to keep a close eye on what’s going on there.
So far, there hasn’t been any signs of a recovery, despite the back-to-back cuts in the cash rate. At the beginning of the year, as a matter of fact, mortgage rates had started to increase. However, the trend has since reversed, largely thanks to the RBA.
The question is, though, what does this mean for cash flows and the value of the AUD?
What We Are Expecting
Tomorrow we get two bits of interesting information that don’t usually move the markets immediately unless there is a big surprise in the data. However, they can drive trader sentiment and are useful for evaluating longer trends. Especially now that next week, major forex traders should be coming back to the markets after the holiday, and the trading ought to return to normal.
For Building Approvals, the consensus among analysts is that they will increase 2.8% over last month, a modest improvement over the prior drop of -1.8%. This series tends to bounce around a lot, but a result above 0 is helpful to imply that contractors are looking to increase construction in the near future. And, when coupled with other data, it can help support a positive trend.
Money Growth and Circulation
The other data coming out at the same time, and perhaps more directly relevant to the currency, is private sector credit. The expectation is for it to increase by 0.3% over last month, a substantial improvement over 0.1% of the prior two months. Since the beginning of the “housing recession” in Australia, this series has been trickling down, with some unfortunate implications.
On the one hand, lower credit issuance would indicate that the largest users of credit – businesses – are not borrowing to finance growth and investment. Or it could mean that the fiscal health of people isn’t enough to be granted loans. Both of those indicate less spending in the future, which would depress the economy, and slow inflation.
The RBA and the Future of Housing
On the flip side of lower rates is that banks become less profitable, and less willing to loan. This is the situation that the ECB has been battling for a while in Europe. In order to compensate for the loss in net interest income, banks usually raise commissions.
Meanwhile, the construction recession in Australia continues to deepen. There have been three quarters of negative growth so far, and no green shoots to suggest the current quarter will be any better.
It’s All the Big Players
With no sign of resolving the trade issue between the US and China, Chinese investors are still restricted from moving cash overseas to buy homes in Australia. That was one of the primary drivers of the construction boom in the last few years. With even the precipitous drop in prices, the number of sales hasn’t significantly improved.
With an increasing number of homes on the market, builders are less likely to initiate new contracts, which has a knock-on effect on the economy. The RBA cutting the cash rate isn’t going to help encourage Chinese investors return to buying. And this might explain why mortgage rates crept up even as the RBA was looking to cut rates!
The second reading of the Q2 US GDP of two percent was in line with market expectations, which allowed the Dollar Index (DXY) to edge higher, having erased most of Friday’s losses. Although investors are well aware of the slowdown in the US economy, the latest data underscored the strength of consumer spending (which makes up over 60 percent of US GDP), and shows that the primary growth driver in the world’s largest economy is still resilient.
Still, the headline figure suggests that the protracted US-China trade tensions are weighing on other sectors of the US economy, such as exports and investments. Faced with slowing growth prospects in the second half of 2019, the Federal Reserve’s decision to lower US interest rates appears justified, with another Fed rate cut widely expected at the September FOMC meeting.
Moving forward, shifting market expectations surrounding the Fed’s policy path are set to sway DXY, as the Fed’s data dependence continues being tested in the interim.
Sterling’s politically-driven slump buoys DXY
The Dollar Index has also been able to preserve its gains, due in some part to the weaker Pound, which accounts for 11.9 percent of DXY. Given the rising prospects of a no-deal Brexit, in light of the suspension of the UK parliament beginning September 9, Sterling should find itself bogged down by the political uncertainties.
EU’s economic woes continue to drag EURUSD lower
The bright spot in the US economy, namely domestic consumers, stands in stark contrast to the EU’s overall economic outlook, with such disparity weighing on the Euro. The bloc’s currency is also contending with the fallout from protracted US-China trade tensions, along with Brexit uncertainties and Italy’s political turmoil, which makes for an overall dismal outlook on EURUSD.
Disclaimer: The content in this article comprises personal opinions and should not be construed as containing personal and/or other investment advice and/or an offer of and/or solicitation for any transactions in financial instruments and/or a guarantee and/or prediction of future performance. ForexTime (FXTM), its affiliates, agents, directors, officers or employees do not guarantee the accuracy, validity, timeliness or completeness, of any information or data made available and assume no liability as to any loss arising from any investment based on the same.
We’ve all heard about how trading the forex markets can offer a wide range of opportunities for anyone with a laptop and an internet connection. But, despite being available to everyone, entering this $5.3 trillion dollar a day industry can be quite intimidating.
So, if you’ve been considering entering the forex markets, but don’t know how and where to start, don’t fret! We’ve put together a 5-step checklist that’ll get you good and prepared to venture into the world of online trading!
1. Research Forex
As with most things in life, education is key. No one should enter the FX markets without having done some extensive research, starting from what forex trading is, all the way to how to analyze charts, use indicators and follow fundamentals. The internet is filled with FREE, well-structured and easy-to-follow forex courses/quizzes that take you from beginner to pro before you risk any of your money! You can even research other forex traders whose instruments and trading style suit your preference and copy what they’re doing! Start slow, then work your way up through the difficulty levels at a pace you are comfortable with. And above all, make sure you never stop learning!
2. Manage your trading expectations
While some might want to enter the FX markets just to see what they’re about, most people enter with the aim of making money – and quickly! The number one step you can take to ensure you are setting yourself up for success is to be aware of what you’re getting into. While FX trading can make you money from the comfort of your own couch, that certainly doesn’t mean it is easy! And just like any other profession or business venture, it requires hard work and dedication. So, don’t be discouraged by the inevitable long and challenging learning curve. Everyone goes through it and by knowing that, you are already a step ahead of your peers!
3. Get an FX demo account
Forex demo accounts are the single best way to get acquainted with the markets. They allow you to experience real-time market moves and conditions and their impact on your hypothetical trades, without risking any collateral! They’re essentially a sort of flight simulator for beginner traders. In fact, even as you progress and get better, they are a fantastic way to test out a new FX trading strategy before investing real capital in it. And they’re free! If there’s one thing you take from this article it’s that you should rinse your demo account for all that it’s worth before you risk a single penny!
4. Pick a trading instrument
To start with, it’s always best to focus on one instrument. This could be a currency pair, an energy, a metal or an index. Familiarize yourself with how it moves and what factors impact it. By doing this, you’re simplifying the markets and getting used to both the technical and fundamental side of FX trading, without getting overwhelmed with all the variables. As you get better, you can add more instruments, more charts, and more risk. And you’ll be well equipped to handle it!
5. Allocate capital you’re willing to risk
As we mentioned, FX trading is no different from any standard business or investment venture. It offers just as much risk as it does opportunity. So, you must never enter the forex markets with money you cannot afford to lose. And yes, this applies even after you’ve tested and optimized your trading strategy on the demo account! The markets are unpredictable, and nothing is ever for certain. So, allocating a specific amount of money that you are prepared to lose is very important to the trajectory of your FX trading journey. It’s also a great way of practicing discipline and control.
The main thing to remember is that, as with anything new, you will stumble and fall as so many traders have done before you. And that’s OK! As long as you follow these 5 steps, you can make sure you are as prepared as possible for anything the forex markets could throw at you!
Accomplishments and revised estimates are reviewed in a ROTH Capital Partners report.
In an Aug. 22 research note, analyst John White reported changes to ROTH Capital Partners’ model on Ring Energy Inc. (REI:NYSE).
ROTH lowered its target price on the company to $8 per share from $12 to reflect its revised oil and gas price deck for West Texas Intermediate (WTI) and Henry Hub from Q3/19 to beyond 2021. Shares are currently trading at around $1.37.
For 2020, the investment banking firm lowered its WTI crude oil price forecast to $52.25 a barrel (52.25/bbl) from $54.75/bbl and reduced its Henry Hub natural gas price projection to $2.40 per million British thermal units ($2.49/MMBtu) from $2.49/MMBtu.
However, despite the projected lower oil and gas prices, ROTH modestly increased its Q3/19 earnings per share/cash flow per share/EBITDA forecasts on Ring Energy to $0.15/$0.38/$30.5 million due to slightly higher estimated Q3/19 production.
According to Ring Energy’s mid-Q3/19 operations update, it drilled six new, one-mile, horizontal San Andres wells on its Northwest Shelf (NWS) property. Of those, two were awaiting completion. The other four were drilled, completed and being tested. “Initial test results are indicating rates ranging between 400 and 500 barrels of oil equivalent per day (400 and 500 bboe/day), which we view as positive,” noted White.
Between its Northwest Shelf and Central Basin Platform (CBP), Ring Energy drilled 11 unreported wells. Four, two CBP and two NWS, were awaiting completion. Of those, one CBP and one NWS, were completed and showing about 360 boe/d and 320 boe/d, respectively. The other two, one CBP and one NWS, are newly completed and being tested.
The remaining seven out of the total 11, five CBP and two NWS, were drilled, completed and being tested. Those were showing 265528 boe/d with an average of about 400 boe/d. “We view this average figure as positive,” White commented.
Disclosure: 1) Doresa Banning compiled this article for Streetwise Reports LLC and provides services to Streetwise Reports as an independent contractor. She or members of her household own securities of the following companies mentioned in the article: None. She or members of her household are paid by the following companies mentioned in this article: None. 2) The following companies mentioned in this article are billboard sponsors of Streetwise Reports: None. Click here for important disclosures about sponsor fees. 3) Comments and opinions expressed are those of the specific experts and not of Streetwise Reports or its officers. The information provided above is for informational purposes only and is not a recommendation to buy or sell any security. 4) The article does not constitute investment advice. Each reader is encouraged to consult with his or her individual financial professional and any action a reader takes as a result of information presented here is his or her own responsibility. By opening this page, each reader accepts and agrees to Streetwise Reports’ terms of use and full legal disclaimer. This article is not a solicitation for investment. Streetwise Reports does not render general or specific investment advice and the information on Streetwise Reports should not be considered a recommendation to buy or sell any security. Streetwise Reports does not endorse or recommend the business, products, services or securities of any company mentioned on Streetwise Reports. 5) From time to time, Streetwise Reports LLC and its directors, officers, employees or members of their families, as well as persons interviewed for articles and interviews on the site, may have a long or short position in securities mentioned. Directors, officers, employees or members of their immediate families are prohibited from making purchases and/or sales of those securities in the open market or otherwise from the time of the interview or the decision to write an article until three business days after the publication of the interview or article. The foregoing prohibition does not apply to articles that in substance only restate previously published company releases.
Disclosures from ROTH Capital Partners, Ring Energy Inc., Company Note, August 22, 2019
Regulation Analyst Certification (“Reg AC”): The research analyst primarily responsible for the content of this report certifies the following under Reg AC: I hereby certify that all views expressed in this report accurately reflect my personal views about the subject company or companies and its or their securities. I also certify that no part of my compensation was, is or will be, directly or indirectly, related to the specific recommendations or views expressed in this report.
ROTH makes a market in shares of Ring Energy, Inc. and as such, buys and sells from customers on a principal basis.
Shares of Ring Energy, Inc. may be subject to the Securities and Exchange Commission’s Penny Stock Rules, which may set forth sales practice requirements for certain low-priced securities.
ROTH Capital Partners, LLC expects to receive or intends to seek compensation for investment banking or other business relationships with the covered companies mentioned in this report in the next three months.
Higher production and weak exports bearish for wheat
US wheat production estimate was increased while export inspections slipped. Will the wheat prices continue declining?
The US Department of Agriculture reported a 60-million-bushel revision upward of 2019/20 all-wheat production estimate in its monthly Wheat Outlook released August 14. Based on that expansion of projected wheat production USDA lowered season-average farm price (SAFP) forecast for 2019/20 20 cents per bushel on lower wheat price expectations for the remainder of the market year. At the same time it upgraded US wheat export prospects citing lower wheat prices as opportunity to expand U.S. sales in the new marketing year. However last week wheat export inspections came at 18.1 million bushels, lower than the prior week’s 20.8 million bushels. Weak demand and higher supply estimates are bearish for wheat.
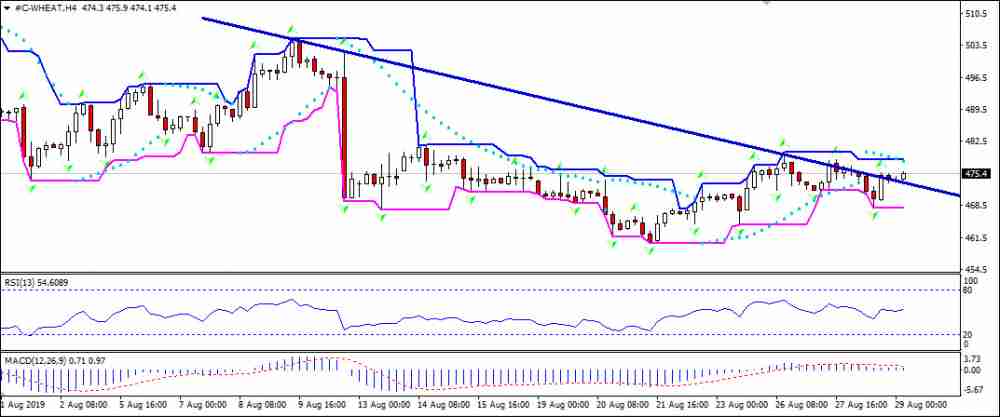
On the 4-hour timeframe the WEHAT: H4 is testing the resistance line.
The Parabolic indicator gives a sell signal.
The Donchian channel indicates no trend yet: it is flat.
The MACD indicator gives a bearish signal: it is above the signal line and the gap is narrowing.
The RSI oscillator has levelled off and is not in overbought zone yet.
We believe the bearish momentum will continue after the price breaches below the lower boundary of Donchian channel at 468. This level can be used as an entry point for placing a pending order to sell. The stop loss can be placed above the upper Donchian boundary at 478.5. After placing the order, the stop loss is to be moved every day to the next fractal high, following Parabolic signals. Thus, we are changing the expected profit/loss ratio to the breakeven point. If the price meets the stop loss level (478.5) without reaching the order (468), we recommend cancelling the order: the market has undergone internal changes which were not taken into account.
The US dollar was seen rising strongly on Wednesday. The gains came after price turned flat the day before.
Economic data remains sparse, and a lack of any new developments in the trade war also helped to improve risk appetite. However, today’s revised GDP figures will provide a catalyst for investors. The second-quarter GDP is expected to be revised lower to 2.0% from the 2.1% initially reported.
German Gfk Consumer Climate Slows
The Gfk consumer climate report from Germany showed that the consumer sector pointed to a slowdown. The data comes amid a stretch of weak economic reports from Germany. Earlier this week, reports showed that German GDP contracted 0.1% in the second quarter of the year. European indices were trading weaker on the data.
EURUSD Continues to Extend Declines
The currency pair has been seen extending declines. This confirms the downside bias after the EURUSD failed to clear the resistance area at 1.1140. The downside is likely to stall near the previously formed lows of 1.1065. A breakout below this level will probably see further declines lower.
Sterling Falls as the Queen Agrees to Suspend Parliament
The pound sterling was in for a shock yesterday falling over 1% on the day. The currency fell as PM Johnson said that he would ask the Queen to suspend the British Parliament for a month leading up to Brexit. Later in the evening, news broke that the Queen approved the suspension of the parliament. This raises the prospects that the UK could be leaving the EU without a Brexit deal in hand. The sterling erased gains made from the previous days earlier in the week.
GBPUSD Upside Prevails
Despite the declines, GBPUSD looks bullish to the upside. The currency pair fell to the support area of 1.2170 and is promptly pushing higher. However, it will have to break past the previously established highs of 1.2295. A breakout above this level is required for the currency pair to push higher. In the near term, however, watch for GBPUSD to make a firm retest of the support area at 1.2170 ahead of further gains.
Gold Holds Firm Near the Top
The precious metal hovered near the top end of the rally, despite posting a modest intraday low. Gold now remains close to a six-year high. Trade tensions and uncertainty across various economies keep the safe-haven asset in demand. While there has been some improvement in the equity markets, gold has managed to hold its ground so far.
XAUUSD Holds Steady
The precious metal has been holding steady near the top. Price action remains muted for the moment. Price is trading within the range that was established on Monday. Any near-term gains need to come only on a breakout above 1544 level. In the near term, the outlook in gold remains to the downside. The initial support at 1508 is likely to be tested.
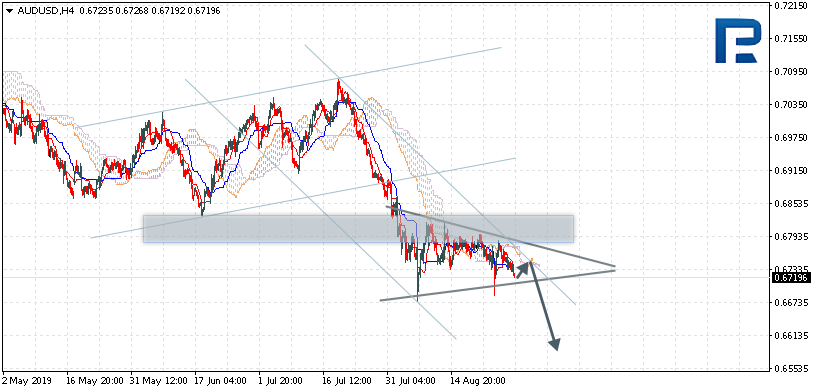
AUDUSD is trading at 0.6719; the instrument is moving below Ichimoku Cloud, thus indicating a descending tendency. The markets could indicate that the price may test the cloud’s downside border at 0.6735 and then resume moving downwards to reach 0.6590. Another signal to confirm further descending movement is the price’s rebounding from the descending channel’s upside border. However, the scenario that implies further decline may be canceled if the price breaks the cloud’s upside border and fixes above 0.6785. In this case, the pair may continue growing towards 0.6905. After breaking Triangle’s downside border and fixing below 0.6675, the price may continue moving downwards.
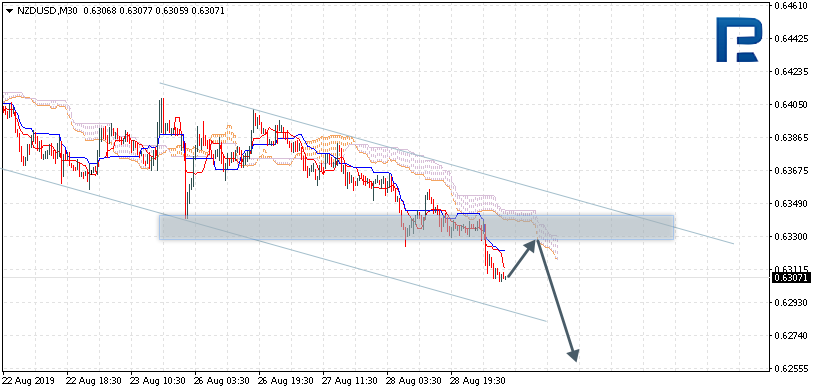
NZDUSD, “New Zealand Dollar vs US Dollar”
NZDUSD is trading at 0.6307; the instrument is moving below Ichimoku Cloud, thus indicating a descending tendency. The markets could indicate that the price may test the cloud’s downside border at 0.6315 and then resume moving downwards to reach 0.6175. Another signal to confirm further descending movement is the price’s rebounding from the resistance level. However, the scenario that implies further decline may be canceled if the price breaks the cloud’s upside border and fixes above 0.6355. In this case, the pair may continue growing towards 0.6425.
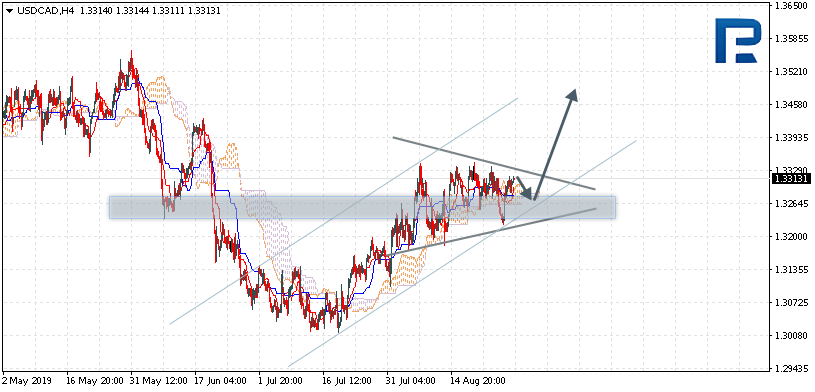
USDCAD, “US Dollar vs Canadian Dollar”
USDCAD is trading at 1.3313; the instrument is moving above Ichimoku Cloud, thus indicating an ascending tendency. The markets could indicate that the price may test the cloud’s downside border at 1.3270 and then resume moving upwards to reach 1.3465. Another signal to confirm further ascending movement is the price’s rebounding from the rising channel’s downside border. However, the scenario that implies further growth may be canceled if the price breaks the cloud’s downside border and fixes below 1.3245. In this case, the pair may continue falling towards 1.3140. After breaking Triangle’s upside border and fixing above 1.3350, the price may continue moving upwards.
Attention! Forecasts presented in this section only reflect the author’s private opinion and should not be considered as guidance for trading. RoboForex LP bears no responsibility for trading results based on trading recommendations described in these analytical reviews.