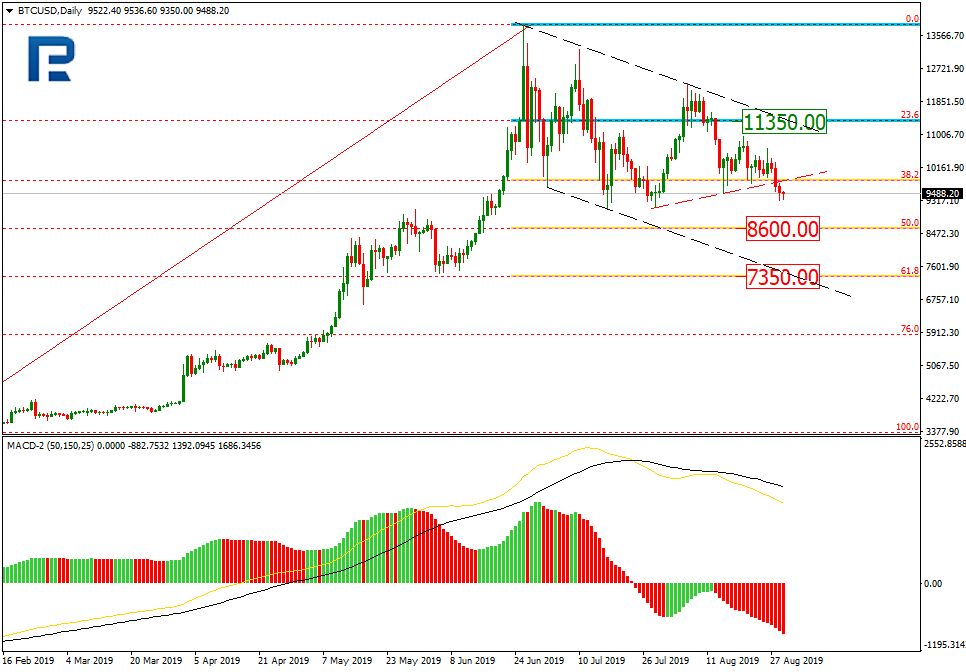
As we can see in the daily chart, after testing 38.2% fibo, BTCUSD has formed a new descending impulse and broken its local lows. In the future, the instrument may continue falling towards 50.0% and 61.8% fibo at 8600.00 and 7350.00 respectively. The resistance is 23.6% fibo at 11350.00.
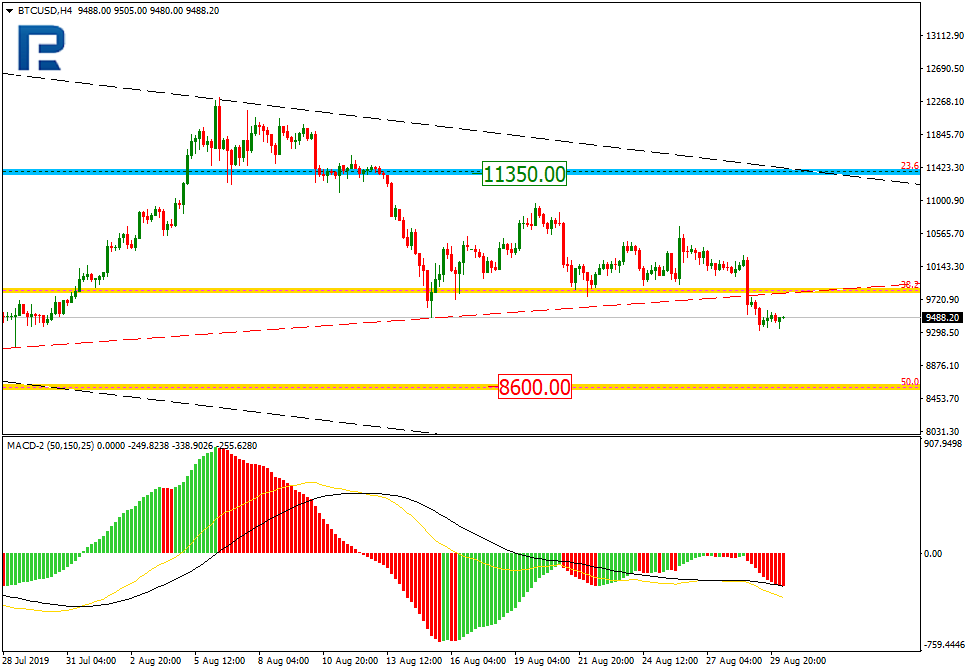
In the H4 chart, the pair is trading towards 50.0% fibo. At the same time, there is a local convergence on MACD Oscillator, which may indicate a possible pullback.
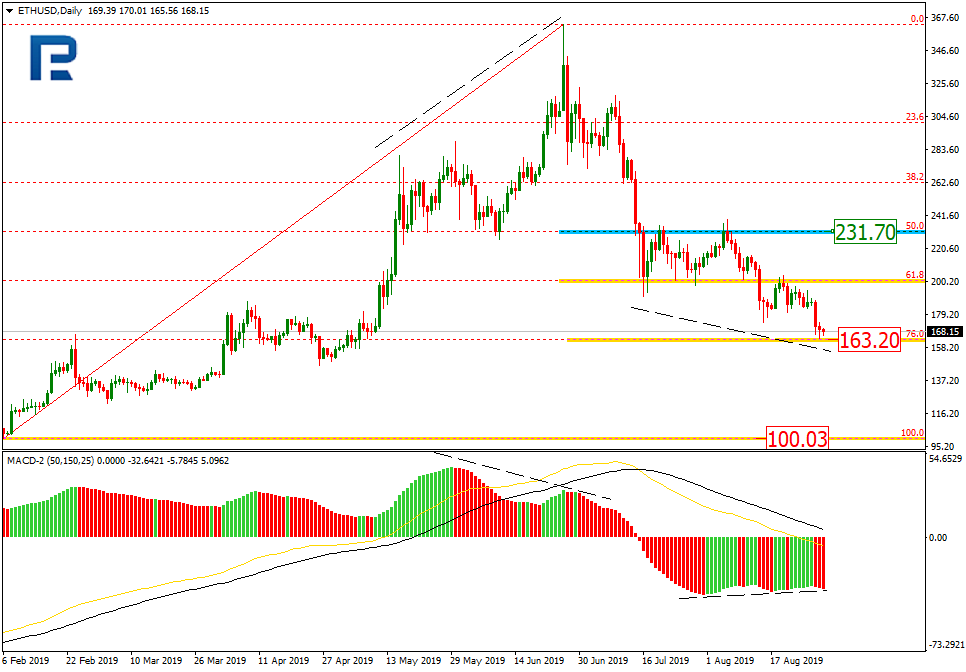
ETHUSD, “Ethereum vs. US Dollar”
As we can see in the daily chart, ETHUSD has completed another descending impulse and reached 76.0% fibo. After breaking this level and fixing below it, the pair may continue falling towards 100.03. At the same time, there is a convergence on MACD, which may indicate a new pullback. The resistance is 50.0% fibo at 231.50, which may be the target of the correction.
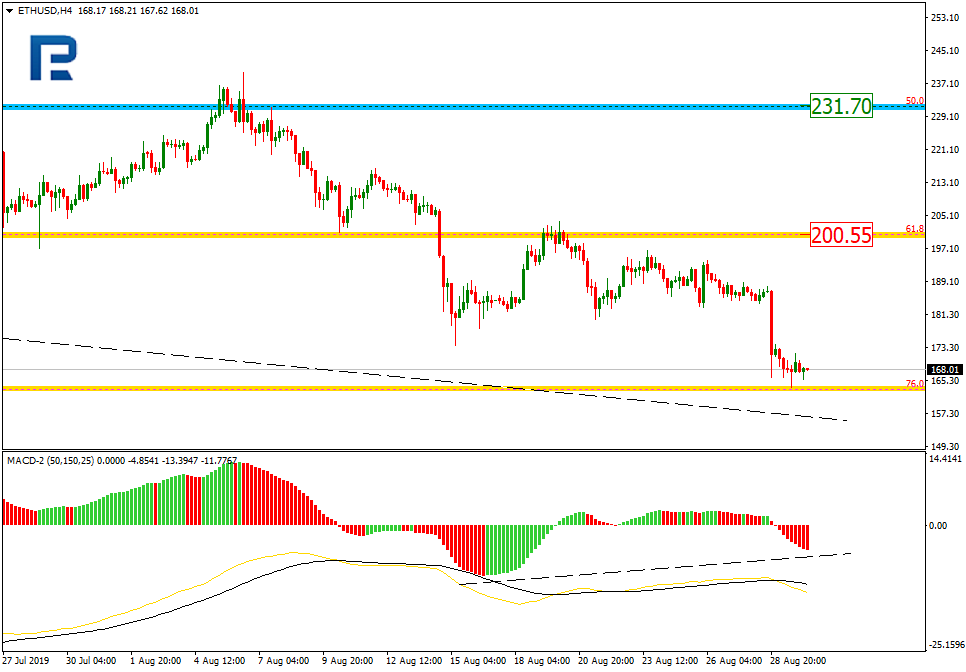
In the H4 chart, the instrument is heading towards 76.0% fibo to test it. At the same time, there is a convergence, which may indicate a short-term correction towards the local resistance at 61.8% fibo at 200.55.
Attention! Forecasts presented in this section only reflect the author’s private opinion and should not be considered as guidance for trading. RoboForex LP bears no responsibility for trading results based on trading recommendations described in these analytical reviews.
In the coming months, some of the worst collateral damage of US tariff wars will occur in sub-Saharan Africa. The adverse impact is likely to be aggravated by US protectionism, which shuns economic integration in Africa.
After US tariff wars undermined the global recovery momentum in 2018, the World Bank projected in June that the world economy would only expand by 2.6 percent. The International Monetary Fund (IMF) has affirmed the trade wars could wipe $455 billion off global GDP in 2020.
The adverse impact on sub-Saharan Africa is reflected by downgraded projections. In April, the World Bank cut the 2019 growth forecast for the region to 2.8 percent from 3.3 percent.
Until the commodity price slump of 2015, Africa enjoyed a decade of rapid growth. The recovery of those growth levels could take long, due to the decline in industrial production and particularly as the US-Sino trade war is taking its toll.
Indeed, the collateral damage in Africa is about to begin.
Trade wars’ impact on Africa
Recently, Akinwumi Adesina, president of the African Development Bank (AfDB) warned that the US-China trade war and uncertainty over Brexit pose risks to Africa’s economic prospects that are “increasing by the day.”Such prospects are also fueled by a recession in Germany.
Indirectly, the diminished prospects are reflected by three major economies – Nigeria, South Africa and Angola – that make up about 60% of sub-Saharan Africa’s annual economic output. At the moment, all are coping with various challenges, curbing their contribution to the growth momentum.
Although Africa is not the direct target of the US-Sino trade war, US tariffs have typically heralded plunging commodity prices, local currencies and major equity exchanges. Earlier in the year, AfDB warned that the trade conflicts could result in a 2.5 percent reduction in the GDP of resource-intensive African countries and 1.0 percent reduction for oil exporters in the next two years.
As US tariffs and diminishing global prospects slow down Chinese production and thus reduce Beijing’s demand for raw materials from Africa, the prospect of slowing Chinese demand could further reduce annual exports from Africa.
The largest regional exporters to China – South Africa and Angola, but also the Republic of Congo, Democratic Republic of Congo, Ghana and Gabon, and Nigeria which rely on China’s need for resources for a significant chunk of their exports – are said to be vulnerable. And so are other African countries with more than 40 percent of their exports going to China, such as South Sudan, Eritrea, Gambia, Guinea and Zimbadwe. Conversely, Africa’s biggest exporters to the US – particularly Angola and South Africa, the Republic of Congo and Democratic Republic of Congo, Gabon and Ghana, Guinea and Nigeria which are dependent on US absorption capacity – remain particularly vulnerable.
Recently, international spotlight has lingered on those African countries that rely on Chinese trade and investment. The highlight should be extended to those countries that depend on US trade and investment, due to the dramatic shifts in US economic presence in Africa in the past two to three decades.
Disruptive changes in US and Chinese trade and FDI
Since December 2018, the Trump administration’s new “Africa strategy” has stressed three priorities: advancing U.S. trade across the region, combating terrorism and aid reduction in the name of efficiency. The first tenet is reflected by the ‘Prosper Africa’ initiative, whose stated goal is to substantially increase trade and investment between the U.S. and Africa.
Yet, to understand the real economic role of the United States and China in Africa, it is instructive to take a long view. Let’s start with trade. Between the end of the Cold War and the onset of the Bush era, US exports to and imports from Africa were less than $1 billion annually. Africa was non-existent to Washington. In the same time period, Chinese exports to Africa more than quintupled to $6 billion, whereas imports from Africa increased even faster, almost 10-fold to over $4 billion.
Prior to global crisis, U.S. trade soared to $100 billion, falling only $2 billion behind that of China. While Chinese trade with Africa was balanced, U.S. trade wasn’t. America imported 2.5 times more from Africa than it exported to Africa.
Until the end of the commodity super-cycle and the collapse of energy prices, Chinese trade soared to more than $200 billion in 2015. After the subsequent plunge, it returned to $155 billion in 2017. Meanwhile, US trade plunged to $50 billion and remains only $55 billion annually. China’s trade surplus with Africa is about $35 billion, whereas U.S. trade deficit with Africa is almost $13 billion. The former has led to some discontent in Africa; the latter is unacceptable to Trump’s trade hawks (Figure 1).
Figure 1US and Chinese Trade with Africa, 1992-2017
Sources: Data UN Comtrade; Chinese Customs
What about the foreign direct investment (FDI) flows? US FDI into Africa peaked at more than $9 billion in 2009. At the same time, Chinese FDI into Africa soared from less than $0.1 billion to $5.5 billion annually. Following the global crisis, the Obama administration pledged greater investments in Africa. In reality, the era saw a dramatic fall of US FDI into Africa, as it plunged to a negative of $2 billion in 2016. Concurrently, Chinese investment in Africa took a hit as well, decreasing to $2.5 billion in 2012. In 2017, US investment rose to only $0.3 billion; while Chinese FDI exceeded $4.1 billion annually (Figure 2).
Figure 2US and Chinese FDI into Africa, 2003-2017
Sources: Data from UNCTAD, BEA
In the 2018 Forum on China Africa Cooperation (FOCAC), President Xi Jinping pledged $60 billion to the continent in loans, grants, and development financing. That’s when the Trump administration developed its “new Africa strategy,” which is constrained by trade protectionism and longer-standing U.S. geopolitical goals.
Differences of US and Chinese presence in Africa
Initially, the Bush administration did push for Africa’s economic self-reliance, but its “war on terror” offset that goal.
The Obama administration’s rhetoric failed to disguise the dramatic collapse of US trade and investment in Africa in the mid-2010s.
In 2014, the US pledged to invest $14 billion in Africa over the next decade. With the most protectionist administration since the 1930s, this may prove unlikely. The Trump administration’s penchant for trade wars shuns efforts to contain collateral damage in Africa. Remedies simply aren’t viable as long as protectionism remains the White House’s primary weapon.
Moreover, the $252 million funding cuts to Ebola response efforts in early 2018 illustrate the gap between the stated goals and effective actions. Finally, expectations should also be cautioned by the Trump administration’s racial bias.
For all practical purposes, the U.S. Africa strategy is largely dictated by the concern that China has become Africa’s largest economic partner. That’s why Washington misrepresents China’s Belt and Road Initiative (BRI) in Africa and elsewhere.
In the postwar era, US-led globalization did not occur without significant mistakes. In the early 21st century, the BRI is going through its own birth pains. But unlike past globalization, the BRI seeks to boost industrialization in emerging and developing countries – that is, countries that have been largely ignored by the advanced West.
In the final analysis, economic development is a win-win game; geopolitics isn’t. Africa is a case in point.
About the Author:
Dan Steinbock is the founder of Difference Group and has served at the India, China and America Institute (US), Shanghai Institute for International Studies (China) and the EU Center (Singapore). For more, see http://www.differencegroup.net/
This commentary was originally published by China-US Focus on August 29, 2019
USD once again strengthened against a basket of world currencies. EUR/USD quotes updated the key lows. Participants in the financial markets continue to monitor the situation in the international trade. The Chinese Ministry of Commerce confirmed that the parties are discussing and scheduling meetings of trade delegations scheduled for September. The trading instrument is currently consolidating. The local support and resistance levels are: 1.10400 and 1.10700, respectively. The EUR/USD currency pair can decline further. We recommend opening positions from the key levels.
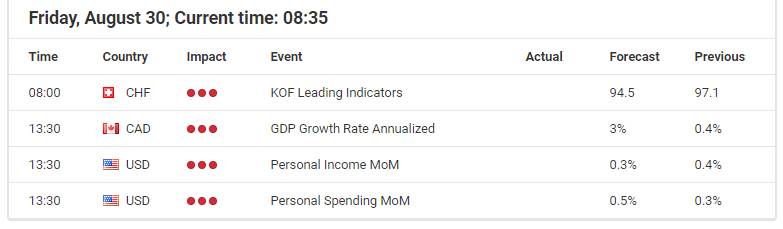
The Economic News Feed for 30.08.2019:
– The consumer price index (EU) – 12:00 (GMT+3:00);
Indicators point to the strength of sellers: the price has fixed below 50 MA and 100 MA.
The MACD histogram is in the negative zone and continues to decline, which signals a bearish sentiment.
Stochastic Oscillator has started to leave the oversold zone, the %K line is above the %D line, which gives a signal to buy EUR/USD.
Trading recommendations
Support levels: 1.10400, 1.10000
Resistance levels: 1.10700, 1.10900, 1.11150
If the price consolidates below 1.10400, expect a further descend to 1.10000.
Alternatively, the quotes could recover toward 1.10850-1.11100.
The GBP/USD currency pair
Technical indicators of the currency pair:
Prev Open: 1.22049
Open: 1.21803
% chg. over the last day: -0.23
Day’s range: 1.21747 – 1.21918
52 wk range: 1.2015 – 1.3385
The GBP/USD currency pair stabilized after a sharp decline since the beginning of this week. GBP is currently consolidating without a single common trend. The key support and resistance levels are 1.21600 and 1.22000, respectively. Investors expect up-to-date information regarding the Brexit process. Today we recommend paying attention to statistics from the United States. Positions must be opened from the key levels.
The Economic News Feed for 30.08.2019 is calm.
The price fixed below 50 MA and 100 MA, which signals the strength of sellers.
The MACD histogram is in the negative zone, but above the signal line, which gives a weak signal to sell GBP/USD.
The Stochastic Oscillator is in the neutral zone, the %K line is above the %D line, which indicates bullish sentiment.
Trading recommendations
Support levels: 1.21600, 1.21100, 1.20700
Resistance levels: 1.22000, 1.22500, 1.23000
If the price consolidates above 1.22000, expect the quotes to rise toward 1.22400-1.22600.
Alternatively, the quotes can decrease toward 1.21300-1.21100.
The USD/CAD currency pair
Technical indicators of the currency pair:
Prev Open: 1.33063
Open: 1.32897
% chg. over the last day: -0.18
Day’s range: 1.32774 – 1.33111
52 wk range: 1.2727 – 1.3664
CAD is in lateral movement. There is no defined trend. At the moment, USD/CAD quotes are testing the key support and resistance levels at 1.32800 and 1.33150, respectively. Investors took a wait and see attitude before the release of important statistics on the Canadian economy. We also recommend paying attention to the dynamics of oil quotes. Positions must be opened from key levels.
At 15:30 (GMT+3:00), Canada will publish a GDP report.
Indicators do not give accurate signals: the price crossed 50 MA and 100 MA.
The MACD histogram is close to 0.
The Stochastic Oscillator is in the overbought zone, the %K line crossed the %D line. There are no signals at the moment.
Trading recommendations
Support levels: 1.32800, 1.32550, 1.32300
Resistance levels: 1.33150, 1.33400
If the price consolidates above 1.33150, expect an increase toward 1.33400-1.33600.
Alternatively, the quotes could drop toward 1.32600-1.32450.
The USD/JPY currency pair
Technical indicators of the currency pair:
Prev Open: 106.103
Open: 106.517
% chg. over the last day: +0.31
Day’s range: 106.286 – 106.543
52 wk range: 104.97 – 114.56
On the USD/JPY currency pair, bullish sentiment prevails. The trading tool has reached key extremes. Demand for “safe” assets has weakened amid optimism in international trade. At the moment, USD/JPY quotes are consolidating in the range 106.200-106.700. We do not exclude further growth of the trading instrument. We recommend that you pay attention to the dynamics of yield on US government bonds. Positions must be opened from key levels.
A number of controversial economic releases from Japan were published in the Asian trading session.
Indicators indicate the strength of buyers: the price has fixed above 50 MA and 100 MA.
The MACD histogram is in the positive zone, but below the signal line, which gives a weak signal to buy USD/JPY.
The Stochastic Oscillator is in the neutral zone, the %K line is below the %D line, which indicates a bearish sentiment.
Trading recommendations
Support levels: 106.200, 105.850, 105.500
Resistance levels: 106.700, 107.000
If the price consolidates above 106.700, expect further growth toward 107,000.
Alternatively, the quotes could drop toward 105.850-105.600.
Yesterday, the US dollar strengthened against a basket of major currencies despite the release of mixed economic data. Yesterday, preliminary data on the US GDP were published, according to which GDP (q/q) counted to 2.0% in the second quarter, as experts forecasted. Pending home sales index was published, which fell by 2.5% in July, although investors expected growth by 0.1%. The US dollar index (#DX) closed in the positive zone (+0.34%).
The trade war between the US and China is still in the focus of attention. Yesterday, spokesman for China’s Ministry of Commerce, Gao Feng, said that China would not immediately respond to new threats from the US President, Donald Trump, to impose new tariffs on Chinese goods. According to the official, China intends to prevent the escalation of the trade war, and not accelerate it.
Meanwhile, the Australian and New Zealand dollars are getting cheaper amid falling demand for commodity currencies due to a continuous trade dispute between the US and China, as well as a slowdown in global economic growth. Investors expect additional signals regarding US-China trade relations.
The “black gold” prices are consolidating. Currently, futures for the WTI crude oil are testing the $56.25 mark per barrel.
Market Indicators
Yesterday, the bullish sentiment was observed in the US stock markets: #SPY (+1.28%), #DIA (+1.35%), #QQQ (+1.53%).
The 10-year US government bonds yield is recovering. At the moment, the indicator is at the level of 1.53-1.54%.
The News Feed on 2019.08.30:
– Consumer price index in the Eurozone at 12:00 (GMT+3:00); – Canada’s GDP data at 15:30 (GMT+3:00); – Personal spending in the US at 15:30 (GMT+3:00); – Michigan consumer expectations and sentiment at 17:00 (GMT+3:00).
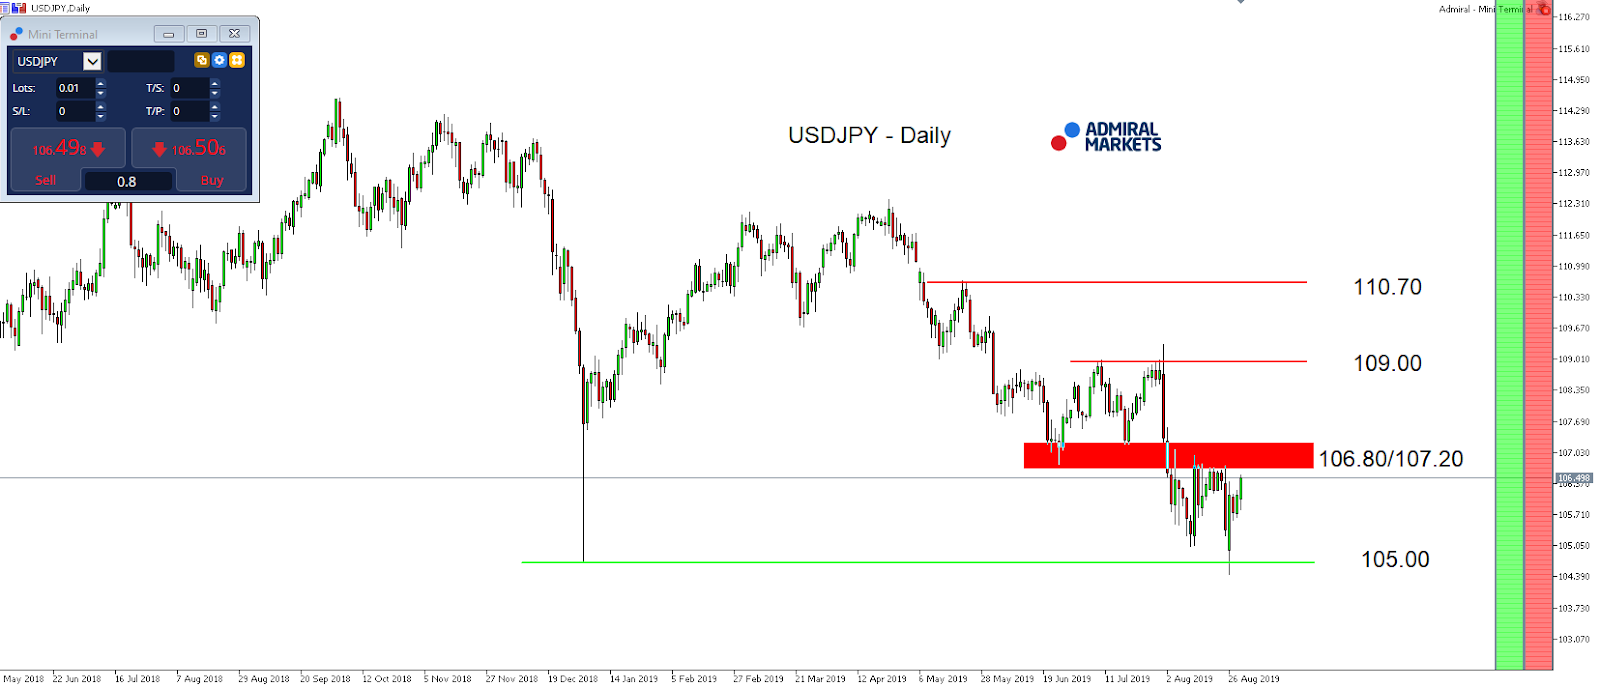
After the currency pair opened below 105.00 last Monday, and briefly traded at its lowest levels since November 2016, the JPY gave back some of its gains while financial markets stabilised a bit.
One major reason was surely a comment from US President Trump who said at the G7 meeting on Monday, that China called over the weekend and started an attempt to get at a table with the US again which was not confirmed by the Chinese.
With rising scepticism that Trump probably “reinvented the truth” a little here, and the USD/JPY still trading below 106.80/107.00, the advantage clearly stays on the short-side in the coming days with uncertainty remaining high among market participants.
In general, USD/JPY traders should remain cautious and expect potential volatility, not only because of a packed economic calendar (ISM Manufacturing (Mo), ISM Non-Manufacturing, ADP (Wed), NFPs (Fri), but also with the still existing speculation of an outright currency market intervention from the US.
That said, a sooner-rather-than-later attack of the region around 105.00 and sustainable break lower should definitely be expected in the USD/JPY, while only recapturing 106.80/107 will brighten the technical picture a little:
Source: Admiral Markets MT5 with MT5-SE Add-on USD/JPY Daily chart (between May 31, 2018, to August 29, 2019). Accessed: August 29, 2019, at 10:00pm GMT – Please note: Past performance is not a reliable indicator of future results, or future performance.
In 2014, the value of the USD/JPY increased by 13.7%, in 2015, it increased by 0.5%, in 2016, it fell by 2.8%, in 2017, it fell by 3.6%, in 2018, it fell by 2.7%, meaning that after five years, it was up by 4.1%.
Discover the world’s #1 multi-asset platform
Admiral Markets offers professional traders the ability to trade with a custom, upgraded version of MetaTrader 5, allowing you to experience trading at a significantly higher, more rewarding level. Experience benefits such as the addition of the Market Heat Map, so you can compare various currency pairs to see which ones might be lucrative investments, access real-time trading data, and so much more. Click the banner below to start your FREE download of MT5 Supreme Edition!
Disclaimer: The given data provides additional information regarding all analysis, estimates, prognosis, forecasts or other similar assessments or information (hereinafter “Analysis”) published on the website of Admiral Markets. Before making any investment decisions please pay close attention to the following:
This is a marketing communication. The analysis is published for informative purposes only and are in no way to be construed as investment advice or recommendation. It has not been prepared in accordance with legal requirements designed to promote the independence of investment research, and that it is not subject to any prohibition on dealing ahead of the dissemination of investment research.
Any investment decision is made by each client alone whereas Admiral Markets shall not be responsible for any loss or damage arising from any such decision, whether or not based on the Analysis.
Each of the Analysis is prepared by an independent analyst (Jens Klatt, Professional Trader and Analyst, hereinafter “Author”) based on the Author’s personal estimations.
To ensure that the interests of the clients would be protected and objectivity of the Analysis would not be damaged Admiral Markets has established relevant internal procedures for prevention and management of conflicts of interest.
Whilst every reasonable effort is taken to ensure that all sources of the Analysis are reliable and that all information is presented, as much as possible, in an understandable, timely, precise and complete manner, Admiral Markets does not guarantee the accuracy or completeness of any information contained within the Analysis. The presented figures refer that refer to any past performance is not a reliable indicator of future results.
The contents of the Analysis should not be construed as an express or implied promise, guarantee or implication by Admiral Markets that the client shall profit from the strategies therein or that losses in connection therewith may or shall be limited.
Any kind of previous or modeled performance of financial instruments indicated within the Publication should not be construed as an express or implied promise, guarantee or implication by Admiral Markets for any future performance. The value of the financial instrument may both increase and decrease and the preservation of the asset value is not guaranteed.
The projections included in the Analysis may be subject to additional fees, taxes or other charges, depending on the subject of the Publication. The price list applicable to the services provided by Admiral Markets is publicly available from the website of Admiral Markets.
Leveraged products (including contracts for difference) are speculative in nature and may result in losses or profit. Before you start trading, you should make sure that you understand all the risks.
On Thursday the 29th of August, trading on the EURUSD pair closed down. The pair rose to 1.1093 during the US session following comments from ECB Governing Council member Klaas Knot, who said that the ECB currently has no need for a renewed QE program (according to a report by Bloomberg).
US data sent the euro down to new intraday lows. US GDP data showed a 2% rise in line with expectations. Germany’s inflation report ensured that pressure on the euro remained, which posted a worse-than-expected reading for August.
Markets were boosted by reports that the US and China are discussing the possibility of continuing trade negotiations in September. China’s Commerce Ministry spokesman Gao Feng told reporters that China will hold off on introducing any countermeasures to newly imposed tariffs from the US as they look to set the conditions necessary for both sides to continue negotiations.
This increased the appetite for risk among market participants, while safe haven assets such as the yen, franc, and gold, went into decline.
Day’s news (GMT+3):
11:30 UK: net lending to individuals (Jul), M4 money supply (Jul), mortgage approvals (Jul).
15:30 Canada: GDP (Jun), industrial product price (Jul).
15:30 US: personal spending (Jul), personal income (Jul), personal consumption expenditures – price index (Jul).
16:45 US: Chicago PMI (Aug).
17:00 US: Michigan Consumer Sentiment Index (Aug).
23:00 US: Baker Hughes US oil rig count.
Current situation:
Yesterday’s expectations were met in full; a drop to the 1.1065 support followed by a rebound. This was helped along by Klaas Knot. The drop below the support was not foreseen. The day closed below 1.1065.
The pair has hit fresh lows in today’s Asian session. Despite an easing of tensions in the US-Sino trade conflict, the majors are trading down against the dollar. The safe havens have moved into positive territory (gold, yen). Markets are likely nervous given that the monthly candlestick is set to close, which is expected to bring with it high volatility. Be ready for some sharp fluctuations ahead of the weekend. In order for the bulls to gather their strength, they need to bring the rate back up to 1.1065. The technical picture doesn’t look good for them as it stands. Don’t be surprised if the pair drops as far as 1.10.
Asia stocks are on course for a positive end to what has been a volatile month, after major US stock indices gained over 1.2 percent each overnight on signs that US-China trade tensions will not further escalate in the near-term.
Nevertheless, the US-China trade conflict is still expected to have a major say over market sentiment in September. Despite US tariffs on $300 billion worth of Chinese goods set to be raised beginning September 1, another round of trade talks could take place in the month ahead. Such a possibility allows markets to continue clinging on to hope that a resolution to this protracted impasse is not dead in the water, with traders using this as an excuse to push further into risk-on territory at any given opportunity.
Dollar index on quest to erase all of August losses
The Dollar index (DXY) breached the 98.5 level before moderating, with Asian currencies showing mixed results at the time of writing. The second reading of the Q2 US GDP of two percent was in line with market expectations, which allowed DXY to edge higher, in an attempt to erase all of its losses this month.
Although investors are well aware of the slowdown in the US economy, the latest data underscored the strength of consumer spending (which makes up over 60 percent of US GDP), and shows that the primary growth driver in the world’s largest economy is still resilient.
Still, the headline figure suggests that the protracted US-China trade tensions are weighing on other components of the US economy, such as exports and investments. Faced with slowing growth prospects in the second half of 2019, the Federal Reserve’s decision to lower US interest rates appears justified, with markets pricing in two more Fed rate cuts in 2019.
Moving forward, shifting market expectations surrounding the Fed’s policy path are set to sway DXY, as the Fed’s data dependence continues to be tested in the interim. Given the resilience of the US Dollar, along with growing concerns over the state of the global economy, the risks for most Asian currencies are currently tilted to the downside.
Sterling in September: Brexit-driven volatility
September will also see the suspension of the UK parliament, while Brexit talks press ahead with UK and EU officials set to meet twice weekly. Even with the prospects of more engagement between the UK and EU over Brexit, the Pound has returned into sub-1.22 territory against the US Dollar.
Pound traders are well aware of the politically-treacherous path that lies ahead in the quest to find a Brexit deal ahead of the October 31 deadline. Still, Sterling’s outlook remains dismal at this point in time which is keeping GBPUSD on a slippery slope, with a likelier path towards 1.20.
Disclaimer: The content in this article comprises personal opinions and should not be construed as containing personal and/or other investment advice and/or an offer of and/or solicitation for any transactions in financial instruments and/or a guarantee and/or prediction of future performance. ForexTime (FXTM), its affiliates, agents, directors, officers or employees do not guarantee the accuracy, validity, timeliness or completeness, of any information or data made available and assume no liability as to any loss arising from any investment based on the same.
Dollar strengthens as US goods trade deficit narrows
US stock indexes advance accelerated on Friday after reports China’s commerce ministry official said Beijing wouldn’t immediately respond to the latest round of tariff increases announced by President Donald Trump last Friday. The S&P 500 gained 1.27% to 2924.58. The Dow Jones industrial average rose 1.25% to 26362.25. Nasdaq composite index advanced 1.5% to 7973.39. The dollar strengthening proceeded at previous session pace supported by report the July goods trade deficit shrunk to below expected $72.3 billion from $74.2 billion a month earlier: the live dollar index data show the ICE US Dollar index, a measure of the dollar’s strength against a basket of six rival currencies, rose 0.2% to 98.43 and is higher currently. Stock index futures point to higher market openings today.
CAC 40 paces European indexes rebound
European stocks bounced back on Thursday after China said it wanted to resolve the trade dispute with a “calm attitude.” Both EUR/USD and GBP/USD continued declining yesterday with both pairs moving lower currently . The Stoxx Europe 600 index ended 1.0% higher. Germany’s DAX 30 advanced 1.2% to 11838.88 while reports indicated inflation in six German states slowed in August. France’s CAC 40 rose 1.5% and UK’s FTSE 100 gained 0.9% to 7184.32.
Australia’s All Ordinaries Index leads Asian indexes gains
Asian stock indices are still mixed today after a Beijing statement Thursday that China’s additional levies on US imports are adequate. Nikkei rebounded 1.2% to 20704.37 with yen little changed against the dollar. Chinese shares are falling: the Shanghai Composite Index is down 0.2% and Hong Kong’s Hang Seng Index is 0.1% lower. Australia’s All Ordinaries Index extended gains 1.5% as Australian dollar continued its slide against the greenback.
Brent futures prices are edging lower today underpinned by easing of global slowdown concerns after easing of US-China trade dispute escalation fears. Prices advanced yesterday: October Brent crude rose 1% to $61.08 a barrel on Thursday.
Note: This overview has an informative and tutorial character and is published for free. All the data, included in the overview, are received from public sources, recognized as more or less reliable. Moreover, there is no guarantee that the indicated information is full and precise. Overviews are not updated. The whole information in each overview, including opinion, indicators, charts and anything else, is provided only for familiarization purposes and is not financial advice or а recommendation. The whole text and its any part, as well as the charts cannot be considered as an offer to make a deal with any asset. IFC Markets and its employees under any circumstances are not liable for any action taken by someone else during or after reading the overview.
In this interview with Bill Powers of Mining Stock Education, Osino Resources CEO and cofounder Heye Daun discusses the company’s recently announced gold discovery, explains the significance of the initial diamond drill core results and shares how Osino Resources plans to continue to advance the project to maximize shareholder value.
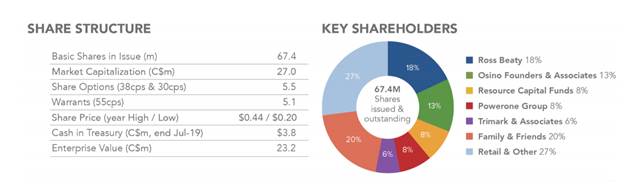
One of Osino Resources Corp.’s (OSI:TSX.V) key founders and financiers is mining entrepreneur Ross Beaty (18% owner). About a month ago, Ross shared with me why he invested in Osino Resources and entrusted his investment with CEO Heye Daun:
“Well, actually Osino is a good example of the things that I actually like and therefore invest in. So I’ve got a handful of investments like Osino, but the very first thing that Osino impressed me with is the CEO. Heye Daun is just a super guy. He’s smart, he’s pleasant, he’s honest, he’s hardworking. All of those things are really, really important. And he’s got lots of experience in the area that not a lot of people know about. It’s an under-explored area, Namibia. Heye lives there. He just lives and breathes and dreams that region. So he’s smart. He’s experienced. It’s really hard to beat that formula.”
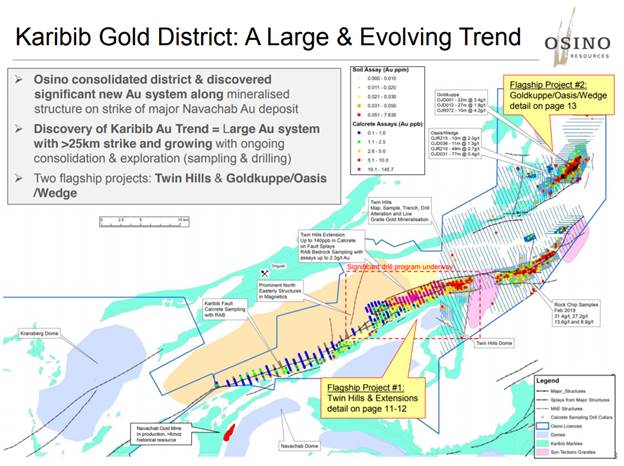
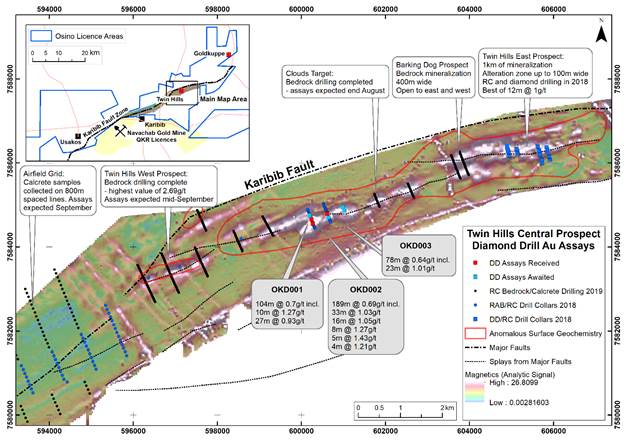
Bill Powers: So to properly understand these drill results, we need to set it in context. Heye, when we talked several months ago over the phone, you set my expectation for what would be successful results for the drill program. And so when I saw the results which just came out, based on my previous conversation with you, I knew they were significant. Let’s begin with you sharing about the simple business plan that you had when you launched Osino and why specifically did you focus on the Karibib trend in central Namibia?
Heye Daun: The business plan was sort of two or three steps. The first one was consolidation, as in putting a sizable land package together, something that has scale just on the map and that gets noticed by majors and mid-tiers. But not just scale on a map, but secondarily also geological scale. Having these pieces in the right places, geologically speaking. We’ve done the first step, we’ve done the second step and the third and I’ll add a fourth step, which is to now prove that we have something real over there and then to find a big brother. And I guess we are somewhere along step three on the way to step four.
Bill Powers: The exit plan as you articulated to me when we first spoke was you plan on defining and then selling this project, not bringing it into production yourself?
Heye Daun: Yes, I would say so. Although I wouldn’t exclude anything. We have to decide when that time arises, but in principle I do believe in that approach. I think there are other companies and entities that are better at building mines than us, even though I’ve done it before. But our key strength is to be entrepreneurial, to raise money, to be flexible, nimble, put these things together, find these things. And I think we’ve proven that and that’s our sweet spot so that’s what we’re going to concentrate on. I think once it gets into construction of mines and stuff, there’s a whole host of other risks that come into play and I think it is appropriate at that time to consider a sales process. Yes, we are working towards that.
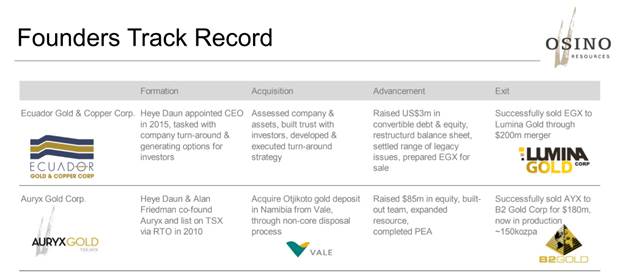
Bill Powers: And you and the key leadership of Osino have done this twice in the last seven years already.
Heye Daun: Yes. One in Namibia. I’m a Namibian citizen and we sold the Otjikoto project to B2Gold Corp. and they built a very successful mine there. That was great for us. It kind of set the scene and it’s our model really. We’re trying do that again and then subsequently with equal gold and copper, which was slightly different, it was also a development asset that got merged into the Ross Beaty company. But that was also absolutely key for us because it was my introduction to Ross Beaty and his group of investors.
Bill Powers: Regarding the geological setting on the Karibib trend in central Namibia, why did you choose this specific geological setting?
Heye Daun: In Namibia or anywhere in the world, you have to work with what you have and the geology is there. Namibia has the Damara orogenic belt, it’s orogenic implying it’s structurally controlled. And that means that there’s a certain exploration approach that you need to take. And it also means that there’s certain areas where you need to look. And that’s how we started off. We tried to consolidate significant ground in the prospective parts of this belt, which is what we’ve done.
Bill Powers: Let’s talk about some of the comparables that you’re looking at to determine a success for your current projects. There’re two gold mines nearby. Talk about those gold mines. What are the size and annual production rates?
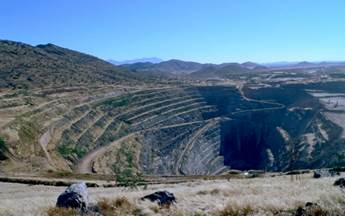
Heye Daun: There’s the Otjikoto gold mine, which I’ve mentioned, which is owned by B2Gold Corp. and it produces around 170,000 to 200,000 gold ounces a year. It’s highly profitable and a very important mine to B2Gold that’s in the northeast.
Figure 1: Otjikoto Gold Mine
And then on the other end of the trend is the Navachab gold mine, which used to be owned by Anglo. It’s got a long and distinguished history, it produces a little bit less, mainly because it is a limited by throughput capacity. We are book-ended by these two mines.
Figure 2: Navachab Gold Mine
You asked me earlier why in this area? Well, clearly, even though we have good technical justification for being where we are, but they are near-ology too, there are these two successful gold mines in Namibia, but they always seemed to be oddities. People didn’t kind of look at Namibia as an emerging gold belt. Geologically, the model was not well understood. Now that has changed in the last few years and so we’ve brought very strongly this orogenic approach, the structural approach, which has resulted in some good to exploration success that we’ve been having.
Bill Powers: So it was a new set of eyes with a different approach that has allowed you to even bring the project to the place it’s at now.
Heye Daun: Absolutely. That’s actually what I’m the most proud about because, where we discovered Twin Hills, and where we’ve made this very recent discovery is 20 kilometers from a six to eight million ounce existing mine that’s been mining for 30 years, had exploration by the likes of Anglo, Goldfields and others. And we’ve discovered this undercover. I’m really proud of that. That’s a real achievement. And as it goes worldwide, most significant gold deposits these days are discovered undercover because most of the stuff that’s open has already been found. There are certain techniques that we’ve adapted that are very important that have resulted in this success.
Bill Powers: With the two nearby mines, what type of gold grades are being produced? And what type of widths of intercepts are there?
Heye Daun: Generally, as you know, we are in a sedimentary belt. The type of deposit that we have is a hydrothermal deposit as opposed to epithermal. Generally these deposits are known to be lower grade but have bigger scale. Epithermal typically is smaller, more veiny, higher grade, but less continuous. These deposits lend themselves to big scale. Navachab has as a historical resource of between six and eight million ounces, that’s 20 kilometers away from us and Otjikoto is also a multi-million ounce deposit. That has been our target. Regarding grades, these mines have generally been between 1 g/t to 1.5 g/t resource grade, but the production rate is always higher because they employ selective mining. There’s an element of upgrading.
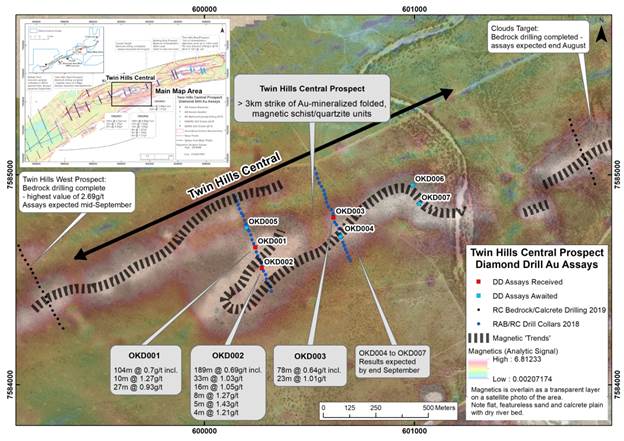
If you relate that back to the intersections we’ve just announced in this discovery, the grades are still lower, but that’s entirely okay because we haven’t discovered the high grade shoots yet that usually form part of these systems and we’ll get there. But what’s different, which is highly encouraging for us, is the fact that our intersections are so long, 189 meters. The average intersection length at Otjikoto’s probably around 50 meters, so it’s very significant and I think especially technical groups who understand this will take note.
Bill Powers: Heye, what I recalled from our conversation months ago was that you told me, “Bill, if you see in the first initial results about 50 meters of anything around 1 g/t or a little less, that would be considered a success.” And so when I saw you put out 104 meters at 0.7 g/t, 189 meters at 0.69 g/t and 78 meters at 0.64 g/t, I knew that that was very positive.
Heye Daun: Yeah. That’s just the intersections for the central part of the system. I’m just reminding you and your readers that we, the Twin Hills system, the entire gold system is about 11 kilometers long as expressed by its surface anomaly and by some bedrock targets that we’ve identified along this trend. Now, the drilling that we announced yesterday applies only to Twin Hills central, which is sort of the heart of the anomaly. But Twin Hills central in itself has significant potential, but so do the other targets along the rest of the trend. I think it’s clear to us at least, it’s very clear that Twin Hills as a camp, or as a system overall has a lot of legs still. We really do believe that we’ve got the dragon by the tail and now we need to slay it. It’s going to take a lot of drilling and we are already gearing up for that.
Bill Powers: You saw some high grades within your highest individual meter assays were 5.7 g/t and 4.76 g/t, 3.08 g/t, 2.84 g/t and 4.29 g/t over a meter. Could that potentially indicate a high grade shoot nearby? Or what type of widths and grade would you want to be seeing to determine if you’ve hit a high grade shoot?
Heye Daun: They may or may not be a high grade shoot, but it doesn’t really matter at this stage. The reason we included them in the press release is just to indicate to mostly the North American Canadian audience that this project has the potential for higher grades. Now when you ask me what kind of high grade shoot would we like to see? Of course as high as possible, but that’s maybe wishful thinking. We need to be realistic. We’re looking at analogs, for example, the Otjikoto mine, which is to the northeast, the B2Gold mine has some high grade shoots that go significantly higher, up to 10 g/t, 5 g/t, 3 g/t. Basically my low water mark here is I need to deliver a gold resource that has a million ounces plus at a resource grade of 1 g/t to 1.5 g/t.
If I can deliver that, then I think we could say that we have a potential mine. I think we’re still some way off that. But certainly what we’re seeing now indicates that that’s very much possible if not probable that we’re going to find that. What the actual grade of the shoots will be, we have no idea. It could be anything. And with this drilling we didn’t specifically target high grade shoots. We understand that these deposits are structurally controlled. We are gaining a better and better understanding of the structure of this deposit. And as that happens, our targeting ability will improve. The next steps certainly will include specifically targeting higher grade shoots. But that was not the intent of this initial drilling. Initial drilling was to just prove significant mineralization in general and that we’ve achieved
Bill Powers: What type of assay results should investors expect from the company over the next few months? And what about our drill program for Q4?
Heye Daun: Of course, I cannot predict assay results just because there’s a geological endowment and I can’t influence that. But I would certainly say that investors should expect similar results to these going forward. Although the length of these intersections is quite exceptional, I think if we match them again that would be, as I say, exceptional, but certainly they should be interspersed with higher grades. I want to see some 2 g/t, some 3 g/t, some 4 g/t in shorter intersections where it’s within a wider halo of low grades. That will ultimately constitute a mineable resource.
Bill Powers: There are some assay results pending and what is the time frame for their release?
Heye Daun: The timeframe is short; within the next two weeks to three months. And just to remind your readers and you, we are doing different types of drilling in the sort of integrated program that we’re running. We’re doing percussion drilling, RC drilling and diamond drilling. The percussion drilling is there to prove up mineralization at bedrock to determine when we are through the cover. And the RC and diamond drilling are to then convert that bedrock mineralization into real intercepts.
The results we just announced are the real intercepts. We announced three out of seven, so another four are expected. There will be one hole hopefully in the next week or two and the remaining three holes will be middle of September. That’s for the diamond drilling, which will further confirm or enhance the current discovery already announced. In addition to that, there will be further bedrock percussion drill results, which will prove additional targets along the Twin Hills trend. Basically making the whole Twin Hills system better, those are also expected in the next four weeks.
And then we are now already planning a follow-up drill program to do infill drilling, step out drilling, extensions on strike and also to look for high grade shoots. Now that drilling will probably commence around about middle of September after we’ve received all the current results. And the results will be incoming during October and November. Fairly constant stream of exciting news coming up basically until the end of the year.
Bill Powers: This is exactly what mining stock speculators want to hear with this steady flow of drill results. But it takes cash to do it. Talk to us about the cash in the treasury, your burn rate and what it costs to drill in Namibia.
Heye Daun: We have about CAD$4 million in the bank right now. We’re going to spend $4.3 million this year, which is if you go on our website presentation, that’s the number that is always mentioned. Of course around three of that has already been spent. We got another $2 million to go between now and the end of the year, which enables us to conclude what I’ve just told you, which is a range of drilling between now and the end of the year. And then we’ll end the year with about two and a half million dollars. That is not a huge amount. But remember we are Namibia and we’ve got a very significant exchange rate kicker, so we can do a lot of damage with $2 million.
But having said that, that’s not where I want to be. My ideal sweet spot is to do a significant additional premium financing in the foreseeable future to cash us up so that we can rev up our program because these results very clearly tell us we need to do a lot more drilling. Even over and above what I’ve just told you. That’s what we’re planning to do.
There are different ways of raising that money. Of course, the market is much more receptive these days. We’ve got very good shareholders who stand behind us. But also I’m interested to talk to strategic investors because I think for a company like ours, we have such a big land position, so many projects, a lot of stuff I haven’t even mentioned, which we are advancing. All of that takes cash. I would be quite happy with a strategic partner at the 10% to 20% level at this stage. And we are actively working on that. We’re talking to a couple of entities who could come in and be the anchor for a significant premium financing.
Bill Powers: And that, of course, will protect shareholders against dilution.
Heye Daun: Yes, although in this regard, we are not a prospect generator. In all of the projects that we have, there’s always the risks of dilution because, of course, we need to raise equity and issue shares in order to keep going. That’s what we’ve done so far. And because we have such a diversified portfolio of assets, there’s quite a strong argument to be made that we could farm out some of those. Let’s say the non-core ones we could farm out to others and we will consider that going forward but we still need to add a bit of value to what we have in order to make these projects real.
That would be one way of minimizing dilution but at the same time if you have success and you own your projects 100%, I argue that being as we are, which is 100% owners and operators of our projects, I think is a better place to be than if we were a prospect generator now, where we would be dependent on other people’s drive and determination. I’m quite happy where I am but of course it does mean some dilution, but I think dilution doesn’t have to be a dirty word. If the dilution happens at higher prices and you generate value that way, then I think it is more acceptable.
Bill Powers: Let’s talk about Namibia. When I spoke with you on the phone for the first time you referred to Namibia as the Switzerland of Africa and you also compared it to Texas, which as an American I’m familiar with. Why do you use those two analogies?
Heye Daun: Well, when we’re looking at jurisdictions, I think there are a couple of things you need to take into account, but the key ones for mining speculators or minings investor are riskiness and ease of doing business. Riskiness refers mainly to political risk, which is uncertainty, political uncertainty, change of regulations, maybe losing your licenses, that sort of stuff. In that regard, Namibia can easily be compared to Texas or Switzerland even to some extent, in that mining regulations are very stable, have been very stable for a long time and appear to continue to be stable going forward. Another important consideration is, of course, ease of doing business. Can you find services, goods and services? Can you access your sites? What is the weather like? In that regard, Texas is probably a better comparable because, yes, Namibia is great. We don’t even have snow.
We can access our drill sites all year round. We have a weak currency at the moment, which is good because it keeps our costs down as we raise our money in Canadian dollars. We get a lot more bang for our buck. Yes, I still maintain that Namibia’s a great place to operate. We are very happy there and it’s definitely one of the top exploration jurisdictions or mining jurisdictions, I would say. Of course, I have to say, there are always some issues, there are always some elements that could be improved and we are working with the government to do so through the Namibian chamber of mines. But that’s just in the normal course of business.
Bill Powers: As you progress the company forward, what would be some of the key things that would hinder your progress?
Heye Daun: Of course, sentiment, externally speaking, I cannot influence that. To a large extent we are dependent on, I guess, President Xi and President Trump. What happens with the trade war and there are other commentators that can put that into perspective much better than I can. At the moment, we have positive sentiment and improving sentiment and that’s good for us. But ultimately we are dependent on that sentiment, especially when it comes to financing because financing is driven by share price. Share price is driven by sentiments. I would say that’s a key outside factor.
Internally, I guess, one of the things we will be working towards is this company is very intimately linked to me as a person because I have track record in Namibia. I’ve done this before, I’ve raised money, sold companies, etc. And so a lot of people associate Osino with me personally. But of course there’s a much bigger team around me. I’m not the one that makes the discoveries, I’m just the one that sets the strategy and raises the finance. But we are looking at, as we grow, strengthening the team. I think that’s important for a small company. I would say those are probably the key factors that investors need to consider.
Bill Powers: As we conclude, Heye, are there any final thoughts that you’d like to share with investors?
Heye Daun: I’m excited. We looking forward to the future. I’m going to Vancouver next week to the Metals Investors Forum. The week after is the Beaver Creek Precious Metals Summit where we’re meeting a range of investors, brokers, mining companies, so I think the next two or three weeks are going to be good for us. And then, of course, in the medium term, we are very excited to get going on the follow-up drill programs and it’s so much easier to project that excitement when you have conviction, and with these results, our conviction has just grown tremendously, so looking forward to the future. Thank you.
Bill Powers is the host of the Mining Stock Education podcast that interviews many of the top names in the natural resource sector and profiles quality mining investment opportunities. Powers is an avid resource investor with an entrepreneurial background in sales, management and small business development. His latest interviews can be found at MiningStockEducation.com.
Disclosure: 1) Bill Powers: I, or members of my immediate household or family, own shares of the following companies mentioned in this article: Osino Resources. I personally am, or members of my immediate household or family are, paid by the following companies mentioned in this article: None. My company has a financial relationship with the following companies mentioned in this article: Osino Resources is an advertiser of Mining Stock Education. Additional disclosures are listed below. 2) The following companies mentioned in this article are billboard sponsors of Streetwise Reports: None. Click here for important disclosures about sponsor fees. 3) Statements and opinions expressed are the opinions of the author and not of Streetwise Reports or its officers. The author is wholly responsible for the validity of the statements. The author was not paid by Streetwise Reports for this article. Streetwise Reports was not paid by the author to publish or syndicate this article. The information provided above is for informational purposes only and is not a recommendation to buy or sell any security. Streetwise Reports requires contributing authors to disclose any shareholdings in, or economic relationships with, companies that they write about. Streetwise Reports relies upon the authors to accurately provide this information and Streetwise Reports has no means of verifying its accuracy. 4) This article does not constitute investment advice. Each reader is encouraged to consult with his or her individual financial professional and any action a reader takes as a result of information presented here is his or her own responsibility. By opening this page, each reader accepts and agrees to Streetwise Reports’ terms of use and full legal disclaimer. This article is not a solicitation for investment. Streetwise Reports does not render general or specific investment advice and the information on Streetwise Reports should not be considered a recommendation to buy or sell any security. Streetwise Reports does not endorse or recommend the business, products, services or securities of any company mentioned on Streetwise Reports. 5) From time to time, Streetwise Reports LLC and its directors, officers, employees or members of their families, as well as persons interviewed for articles and interviews on the site, may have a long or short position in securities mentioned. Directors, officers, employees or members of their immediate families are prohibited from making purchases and/or sales of those securities in the open market or otherwise from the time of the interview or the decision to write an article until three business days after the publication of the interview or article. The foregoing prohibition does not apply to articles that in substance only restate previously published company releases.
The content produced by Bill Powers and Mining Stock Education LLC is for informational purposes only and is not to be considered personal, legal or investment advice or a recommendation to buy or sell securities or any other product. It is based on opinions, public filings, current events, press releases and interviews but is not infallible. It may contain errors and we offer no inferred or explicit warranty as to the accuracy of the information presented. If personal advice is needed, consult a qualified legal, tax or investment professional. Do not base any investment decision on the information contained on MiningStockEducation.com, our podcast or our videos. We usually hold equity positions in and are compensated by the companies we feature and are therefore biased and hold an obvious conflict of interest. MiningStockEducation.com may provide website addresses or links to websites and we disclaim any responsibility for the content of any such other websites. The information you find on MiningStockEducation.com is to be used at your own risk. By reading MiningStockEducation.com, you agree to hold MiningStockEducation.com, its owner, associates, sponsors, affiliates, and partners harmless and to completely release them from any and all liabilities due to any and all losses, damages, or injuries (financial or otherwise) that may be incurred.
Shares of Lannett Co. are up 40% today after announcing that it secured rights to be the exclusive U.S. distributor of Sinotherapeutics’ antifungal drug that is an AB-rated generic for Noxafil.
This morning generic drug maker Lannett Company Inc. (LCI:NYSE.MKT)announced that it has entered into an agreement with Sinotherapeutics Inc., a China-based specialty pharmaceutical company, to be the exclusive U.S. distributor of Posaconazole Delayed-Release Tablets 100mg. Sinotherapeutics has received final approval from the U.S. Food and Drug Administration (FDA) of its Abbreviated New Drug Application (ANDA) for Posaconazole Delayed-Release Tablets 100mg, which is an AB-rated generic equivalent of Merck’s Noxafil Delayed-Release Tablets. Lannett expects to commence shipping the product shortly. Posaconazole belongs to a class of drugs known as azole antifungals and is used to prevent certain fungal infections in patients who have severely weakened immune systems.
According to IQVIA, the brand product’s annual U.S. sales were approximately $325 million for the twelve months ended June 2019. Under the agreement, Lannett will make milestone payments based on market dynamics and performance. The company will provide sales, marketing and distribution and will receive a share of the profits.
Lannett’s CEO Tim Crew commented, “The Sinotherapeutics team is highly skilled at formulating particularly difficult to develop products, such as Posaconazole Delayed-Release Tablets…Given the market dynamics of the product, we expect Posaconazole to be a meaningful contributor to our business.”
The notice today comes on the morning after the company reported financial results for its fiscal 2019 fourth quarter and full year ended June 30, 2019.
For Q4/19, on a GAAP basis, the firm reported net sales were $133.8 million compared with $170.9 million for Q4/18. Gross profit was $49.3 million, or 37% of total net sales, compared with $66.5 million, or 39% of Q4/18 total net sales. Operating income in Q4/19 increased to $9.4 million from $8.6 million in Q4/18. Net loss was $7.6 million, or $0.20 per share, compared with $11.4 million, or $0.30 per share, for Q4/18. On a non-GAAP basis, Q4/19 adjusted net income was $14.7 million, or $0.37 per diluted share, compared with $24.5 million, or $0.64 per diluted share for Q4/18.
For full year FY/19, on a GAAP basis, net sales were $655.4 million compared with $684.6 million for FY/18. The firm reported that net loss was $272.1 million, or $7.20 per share, versus net income of $28.7 million, or $0.75 per diluted share, for FY/18. On a non-GAAP basis FY/19 adjusted net income was $91.8 million, or $2.35 per diluted share, compared with $118.2 million, or $3.10 per diluted share, for FY/18.
CEO Tim Crew stated, “We feel positive about our company’s future following a number of significant accomplishments. Since January 2018, we have launched 25 products with annualized sales of approximately $100 million, acquired or in-licensed more than 40 ANDAs and paid down approximately $187 million of our outstanding debt, which included $87 million of voluntary payments. In the past year, we have expanded existing strategic alliances and established new ones, and submitted to the FDA nine product applications, all while we implemented and recently completed a net $33 million cost savings plan…Looking ahead, we expect to launch a number of new products that will continue to build our business in the near term and have begun adding products to our pipeline that have significant potential in the medium term and beyond”.
The company provided guidance for FY/20 estimating GAAP net sales of $525545 million and adjusted (non-GAAP) EBITDA of $145160 million.
Sinotherapeutics, based just outside of Shanghai, lists that it is a specialty pharmaceutical company focused on developing generic products that are of high commercial value and possess high technological barriers. The company is integrated with R&D, regulatory affairs for product registration (FDA and NMPA), clinical supply and commercial manufacturing, and sales and marketing capabilities. The company has successfully developed and launched several controlled and delayed release ANDAs for the U.S. and Chinese markets.
Headquartered in Philadelphia, Penn., Lannett Company develops, manufactures, packages, markets and distributes generic pharmaceutical products for a wide range of medical indications.
LCI shares, which started the day with a 44%, short interest, opened much higher today at $8.25 (+$2.22, +36.82%) over the prior day’s closing price of $6.03. Since the open the stock has traded between $7.96 and $8.85 and currently is priced at $8.44 (+2.41, +39.97%).
Disclosure: 1) Stephen Hytha compiled this article for Streetwise Reports LLC and provides services to Streetwise Reports as an independent contractor. He or members of his household own securities of the following companies mentioned in the article: None. He or members of his household are paid by the following companies mentioned in this article: None. 2) The following companies mentioned in this article are billboard sponsors of Streetwise Reports: None. Click here for important disclosures about sponsor fees. 3) Comments and opinions expressed are those of the specific experts and not of Streetwise Reports or its officers. The information provided above is for informational purposes only and is not a recommendation to buy or sell any security. 4) The article does not constitute investment advice. Each reader is encouraged to consult with his or her individual financial professional and any action a reader takes as a result of information presented here is his or her own responsibility. By opening this page, each reader accepts and agrees to Streetwise Reports’ terms of use and full legal disclaimer. This article is not a solicitation for investment. Streetwise Reports does not render general or specific investment advice and the information on Streetwise Reports should not be considered a recommendation to buy or sell any security. Streetwise Reports does not endorse or recommend the business, products, services or securities of any company mentioned on Streetwise Reports. 5) From time to time, Streetwise Reports LLC and its directors, officers, employees or members of their families, as well as persons interviewed for articles and interviews on the site, may have a long or short position in securities mentioned. Directors, officers, employees or members of their immediate families are prohibited from making purchases and/or sales of those securities in the open market or otherwise from the time of the interview or the decision to write an article until three business days after the publication of the interview or article. The foregoing prohibition does not apply to articles that in substance only restate previously published company releases.