The US dollar rose to a two year high on Friday. Month-end flows alongside some positive economic data from the US added to the optimism. The US personal consumption expenditure saw a 0.6% increase in July. The data underscored the resilience of the consumer. However, household income growth slowed significantly during the month. After rising 0.5% in June, household income grew just 0.1% in July.
Euro Tumbles to a Two-Year Low
The euro currency fell to 1.1098 on Friday, a two-year low. The declines came as data from the eurozone continued to deteriorate. This raises the prospects for the ECB to announce its stimulus plans when it meets on September 12th. The ECB has already pledged its commitment to start the QE program. But the size and scope of the stimulus plan is the subject of speculation.
EURUSD to Remain Subdued into ECB Meeting
The common currency is unlikely to make any major advances in the next week. This comes as traders line up ahead of the ECB’s monetary policy meeting. The current lows are likely to hold for the moment. As a result, EURUSD could be trading subdued below the resistance area of 1.1030.
Sterling Muted as Scottish Courts hear out the Brexit case
The pound sterling was muted on Friday. This came amid news reports that the Scottish courts agreed to hear the UK lawmakers case against PM Johnson’s move to dissolve the parliament before the Oct 31stBrexit deadline. The Scottish court, however, rejected the plea by lawmakers for an interim injunction. A full hearing on the issue is slated for September 3rd.
GBPUSD Testing Support. Will Gains Follow?
The currency pair settled near the support area of 1.2170 on Friday. This comes as price retested the support area more firmly. A rebound off this level is required in order for GBPUSD to push higher. The initial target will be previous highs at 1.2295. A close above this high will open GBPUSD to further potential gains.
Gold Marks First Weekly Decline in Four Weeks
The precious metal closed last week on a bearish note. This was the first weekly decline after four consecutive weekly gains. However, the bearish close in gold came as price tested a new six-year high at 1555.00 an ounce. Gold prices weakened modestly as the US dollar surged once again.
XAUUSD Likely to Correct Lower in the Near Term
The precious metal is expected to post a correction lower in the short term. Price action is likely to see gold testing the lower support at the psychologically crucial 1500 mark. A breakdown below this level could indicate further declines. The next main support area is seen at 1485 upon a successful close below the 1500 region.
This week – September 1 through September 7 – central banks from 7 countries or jurisdictions are scheduled to decide on monetary policy: Australia, Chile, Georgia, Canada, Sweden, Ukraine and Russia.
Following table includes the name of the country, the date of the next policy decision, the current policy rate, the result of the last policy decision, the change in the policy rate year to date, and the rate one year ago.
The table is updated when the latest decisions are announced and can always accessed by clicking on This Week.
The week ahead looks to a new trading month with the central bank meetings and some key economic indicators coming out from the United States.
The data over the week will certainly bring some volatility back as investors wait for more signals from policymakers.
The week, however, promises to start on a quiet note. The US markets are closed on Monday in observance of the Labor Day holiday. However, the momentum picks up as the week progresses.
Brexit will also continue to remain in the spotlight over the week and a number of speeches from various Fed officials will keep investors busy. Here’s a quick look into the week ahead.
RBA to Kick Off Central Bank Meetings this Week
The Reserve Bank of Australia will be holding its monetary policy meeting amid a rather busy week for the Australian dollar.
Expectations are for the central bank to keep interest rates unchanged this week. But a host of economic reports over the week will certainly keep policymakers glued to economic data.
This week, we will get to see the import/export data for the second quarter alongside the business inventories report. The data will provide initial insights into the second quarter GDP performance for the region.
The Australian economy is forecast to have risen 0.5% in Q2. The hawkish forecasts show that momentum in growth might have increased, supported by lower interest rates.
July’s trade figures along with retail sales reports will likely give a better overview of the GDP growth.
Bank of Canada to Hold Rates Steady
Another big-ticket item this week will be the interest rate decision by the Bank of Canada. The central bank is expected to keep interest rates unchanged at 1.75% at this week’s meeting.
Last Friday’s better than expected GDP data has pushed the Canadian GDP to beat the BoC’s GDP forecasts. However, while the domestic economy seems to be in better shape, the global headwinds remain a cause for concern.
Investors speculate that the central bank will likely cut rates in October. But it would be too early to tell. Given the recent trade rhetoric and the domestic conditions, the central bank would prefer to bide for more time.
Canada’s Jobs Data in Focus
With the BoC’s decision more or less a done deal, investors will shift focus to Friday’s jobs report from Canada. Economists expect the Canadian economy to add about 12.5k jobs in August.
This follows a decline of 24.2k jobs in the month before. The jobs data will be crucial in the larger narrative. A better than expected report on the jobs side will certainly convince investors that the anticipated rate cut could be pushed further down the line.
Investors Asses US Economic Data for Q3
This week will mark economic reports from the United States that will give investors insights into the third-quarter performance. This includes the monthly manufacturing and non-manufacturing PMI reports. The labor market report is due on Friday which also gains importance.
With the US economy seen expanding at a slower pace of just 2.0% in the second quarter, this week’s data will give early insights into how the US economy is faring, going into Q3.
ISM Manufacturing and NMI to Rise Modestly
The manufacturing and non-manufacturing PMI’s from the Institute for Supply Management could give a mixed picture.
More importantly, the manufacturing sector could see a modest rebound. However, economists expect that the manufacturing sector could fall further down to 51.0, from 51.2 previously.
The non-manufacturing sector PMI is forecast to rise to 53.8.
US Payrolls in Focus
Amid a slowing economy, the labor market comes under scrutiny. Economists expect that the US unemployment rate will remain unchanged at 3.7% in August.
In the previous month, the US unemployment rate was at 3.2%. Average hourly earnings continue to rise at a steady pace of 0.3% on the month.
For August, expectations are for payrolls to rise a modest 159k comparing to 164k headline figure in the previous month.
By Hussein Sayed, Chief Market Strategist (Gulf & MENA), ForexTime
August has been a challenging month for markets. While many traders were out of their desks enjoying the summer season, US-China trade conflict reached a critical point. Both countries hit each other with new tariffs which came into effect on Sunday. Even though the trade dispute seemed to be de-escalating last week, helping some risk assets recover, many investors fear that the trade conflict is too far from being entirely resolved. Whether you’re equity, fixed income, commodity, or a currency trader, trade-war remains the most significant influence on all these asset classes.
With many uncertainties surrounding the global economy expect volatility to remain elevated in September. Determining the impact of trade wars on economic growth and corporates’ profitability is not an easy task, especially when it comes to consumers and businesses’ behavior. The fear of the unknown will eventually lead to less consumer spending, and companies cutting capital expenditures. That’s what we call self-fulfilling prophecy in economic terms. The consequences of pessimistic expectations by investors can lead to a recession and easing policies by central banks will only have limited impact to prevent such an outcome.
The surge in negative bond yields, which has reached a record $17 trillion led many investors to jump to US bonds. A 1.5% yield on US Treasury bonds may not look very attractive but compared to -0.7% for its German counterpart and -0.26% on JGBs, it’s definitely a better alternative. However, the move into US bonds is causing a headache to the White House as the Dollar reached a new two-year high on Friday. The Dollar’s strength will draw more attention from President Trump as he might push the Treasury Department to intervene in the currency. If Treasury Secretary Steven Mnuchin starts warming up to the idea of intervening in the Dollar this will take us into even riskier territory in the ongoing trade conflict, which is a currency trade war.
Probably that’s why Gold and Silver prices remained elevated during last week, ignoring the strength of the US Dollar and relief rally in equities. If the Dollar Index begins approaching its 2016 highs of 103, President Trump may use all his influence to push the Treasury Department and the Federal Reserve into intervening. In such circumstances there won’t be a better place to be other than holding the yellow metal.
US non-farm payrolls report on Friday is the key event on the data front. So far, the jobs market remained one of the bright spots of the US economy, and if it remains strong, there may be less incentive for aggressive easing by the Federal Reserve. Manufacturing and services ISMs will also be closely scrutinized by investors, especially after manufacturing PMI contracted for the first time in nearly a decade in August.
With several Fed officials speaking this week and Fed’s beige book due to be released on Wednesday, we’ll probably get a clearer picture of the US economic prospects in the next few days.
Disclaimer: The content in this article comprises personal opinions and should not be construed as containing personal and/or other investment advice and/or an offer of and/or solicitation for any transactions in financial instruments and/or a guarantee and/or prediction of future performance. ForexTime (FXTM), its affiliates, agents, directors, officers or employees do not guarantee the accuracy, validity, timeliness or completeness, of any information or data made available and assume no liability as to any loss arising from any investment based on the same.
Dollar strengthening accelerates as Chicago PMI rebounds
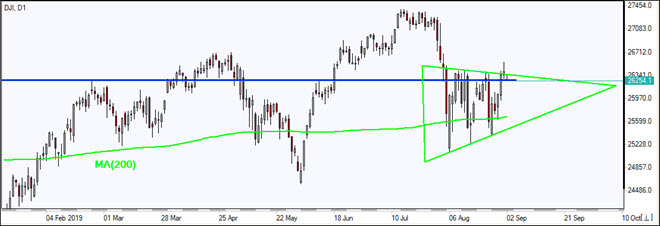
US stock indexes ended marginally higher on Friday. The S&P 500 gained 0.1% to 2929.46, rebounding 2.8% for the week but logging 1.8% monthly loss, the second monthly decline in 2019. Dow Jones industrial rose 0.2% to 26403.28. The Nasdaq however slipped 0.1% to 7962.88. The dollar strengthening accelerated after Federal Reserve’s Chicago area purchasing managers index rose to 50.4 from 44.4 in July, readings above 50 indicating expansion and below 50 showing contraction. The live dollar index data show the ICE US Dollar index, a measure of the dollar’s strength against a basket of six rival currencies, rose 0.4% to 98.78 and is higher currently. US markets are closed today for Labor Day holiday. Stock index futures are lower currently.
DAX 30 leads European indexes movement
European stocks extended gains on Friday despite weak economic data. EUR/USD accelerated its slide as the final reading confirmed euro-zone headline inflation remained steady at 1% in August, intensifying expectations of a big ECB stimulus next month. GBP/USD decelerated its decline on Friday with both pairs lower currently. The Stoxx Europe 600 Index gained 0.7% Friday. The DAX 30 rose 0.9% to 11939.28 while German retail sales suffered a sharp 2.2% fall in July. France’s CAC 40 advanced 0.6% and UK’s FTSE 100 added 0.3% to 7207.18.
Shanghai Composite rises while other Asian indexes retreat
Asian stock indices are mixed today as new tariffs announced by United States and China on each other’s goods kicked in. Nikkei lost 0.4% to 20620.19 despite reversal of yen ‘s climb against the dollar. China’s markets are mixed after official data indicate China’s factory activity dipped for fourth straight month while Caixin manufacturing PMI rises above 50: the Shanghai Composite Index is up 1.3% while Hong Kong’s Hang Seng Index is 0.5% lower. Australia’s All Ordinaries Index turned 0.4% with the Australian dollar little changed against the greenback.
Brent futures prices are extending losses today on global growth slowing concerns after US and China reciprocal tariffs came into force. Prices fell on Friday: Brent for October settlement ended 1.1% lower at $60.43 a barrel Friday.
Note: This overview has an informative and tutorial character and is published for free. All the data, included in the overview, are received from public sources, recognized as more or less reliable. Moreover, there is no guarantee that the indicated information is full and precise. Overviews are not updated. The whole information in each overview, including opinion, indicators, charts and anything else, is provided only for familiarization purposes and is not financial advice or а recommendation. The whole text and its any part, as well as the charts cannot be considered as an offer to make a deal with any asset. IFC Markets and its employees under any circumstances are not liable for any action taken by someone else during or after reading the overview.
As a pure play uranium explorer since 2004, things looked increasingly grim after Fukushima happened in 2012 for Forum Uranium. After years of struggling, CEO Richard Mazur decided together with the board that they had to change course. On February 28, 2018, the company name was changed into Forum Energy Metals Corp. (FMC:TSX.V), reflecting the new direction into metals needed for the ongoing energy transition from oil to electricity, with new focus on for example copper, nickel and cobalt. Management particularly believes in copper, as only a few new projects have come online, China is planning to ban scrap imports next year, is planning large infrastructure spending and the developing EV market could have a significant impact on demand, all potentially resulting in severe supply/demand tensions in the future. Only three weeks before this, Forum optioned the large Janice Lake sedimentary copper project from Transition Metals Corp. (XTM:TSX.V).
The markets didn’t exactly improve after this, so Forum wasn’t out of the woods yet. Notwithstanding this, it completed a small drill program on Janice Lake, each of four shallow scout holes hitting copper, and two decent intercepts in Q4, 2018. Fortunately for it, giant Rio Tinto Plc (RIO:NYSE; RIO:ASX; RIO:LSE; RTPPF:OTCPK) also noticed these drill results, and took a closer look at them. This resulted in a C$30M JV between Rio Tinto and Forum on May 9, 2019, which was exactly what Forum was searching for, as Janice Lake was a very promising, but also very large scale copper project, way too large to explore by a tiny junior like Forum itself. What Janice Lake is about and what this deal could imply for Forum Energy Metals is something that will be discussed in the following article.
All presented tables are my own material, unless stated otherwise.
All pictures are company material, unless stated otherwise.
All currencies are in US Dollars, unless stated otherwise.
2. The company
Forum Energy Metals is an exploration company searching for energy metals, including copper, nickel, platinum, palladium and uranium in Saskatchewan, Canada. In addition, Forum has established a strategic land position in the Idaho Cobalt Belt, in order to find cobalt. Forum originated as a uranium explorer 15 years ago, focusing on the Athabasca Basin in Saskatchewan, but broadened its horizon early 2018. I view the company as a hybrid prospect generator, as it drills its own projects, but also regularly arranges joint ventures with large partners as it has with Rio Tinto earlier this year. Forum has an extensive portfolio of uranium projects, the Janice Lake copper project, the Love Lake palladium project and the Quartz Gulch Cobalt project, but I will be focusing on its flagship Janice Lake copper project in this article.
Saskatchewan is the best jurisdiction for mining projects according to the Policy Perception Index (PPI) of the most recent 2018 Fraser Institute Survey of Mining Companies. It ranks no less than 1 out of 83 jurisdictions worldwide, with a perfect score of 100 out of 100. The PPI is the most important figure of this survey, as it indicates the mining friendliness of a jurisdiction, which encompasses corruption, permitting, speed of administrative processing, politics, local sentiment, etc. The Survey is usually published in the last week of February, and handles the year before.
The management team is led by veteran president and CEO Richard Mazur, P.Geo, MBA, who has 35 years of experience as a geologist, financial analyst and senior executive on a variety of commodities like uranium, gold, diamonds, base metals, coal and industrial minerals. The driving forces on the exploration front are two Athabasca uranium experts: Ken Wheatley, P.Geo, who has 37 years of experience as a geoscientist on uranium projects, and Boen Tan, PhD, who has 35 years of experience as a geologist in uranium exploration, and Ken and Boen are assisted by Jim Atkinson, P.Geo, MSc, geological consultant with over 45 years of experience on base and precious metals deposits and mines. The Board of Directors adds considerable value in the field of financings, law and accounting.
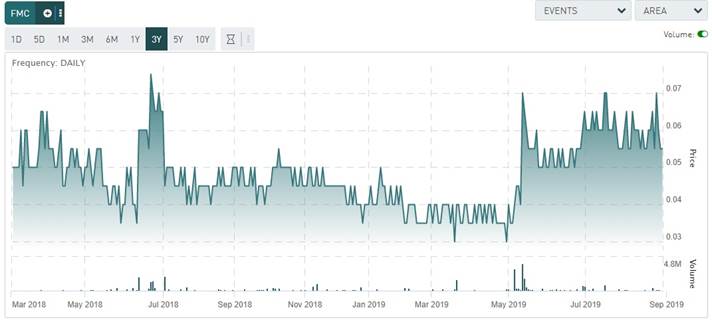
Forum Energy Metals has its main listing on the main board of the TSX Venture, where it’s trading with FMC.V as its ticker symbol. With an average volume of about 89,596 shares per day, the company’s trading pattern is not very liquid at the moment, but I expect this to improve when good drill results will come in from the ongoing program at Janice Lake by JV operator Rio Tinto.
The company currently has 107.49 million shares outstanding (fully diluted 127.365 million), 15 million warrants (the majority is due @C$0.10 or more, of which 4.3 million warrants are expiring in March, April and June 2020, and 11 million warrants @C$0.10 in April 2024) and several option series to the tune of 4.38 million options in total, priced at C$0.10, expiration dates from Nov 2020 onwards. Forum sports a tiny market capitalization of C$5.9 million based on the August 30, 2019, share price of C$0.055.
The company has a healthy shareholder base, as 15% is held closely by Institutionals, 9% by Holystone Energy, 8% by Transition Metals, 3% by Lumina Capital and 6% by management, Board of Directors and insiders. Forum has an estimated working capital position of about C$0.1 million, as it raised C$550,000 in April this year but had C$198,000 left at May 31, 2019, which was the end of Q2, 2019 for the company. Therefore it is raising a small amount of C$75,000 flow through at the moment, so it can explore its Love Lake nickel-copper-PGM project in Saskatchewan by mapping and sampling, while Rio Tinto is doing the heavy lifting at Janice Lake.
As can be seen in the chart, the share price was gradually grinding lower, as both uranium and copper weren’t performing well since the beginning of 2018. Forum started showing up on radars when the Rio Tinto JV deal was announced in May, generating massive volumes for a brief period of time. It seems the share price has bottomed as 34 cents are multi year lows, also for the old ticker which can’t be showed at Tmxmoney.com, and I view these levels as a good buying opportunity, as drilling is well on its way now, and results can be expected relatively soon, as mentioned. Let’s have a look at Forum’s flagship project Janice Lake, and the JV itself.
3. Janice Lake/JV with Rio Tinto
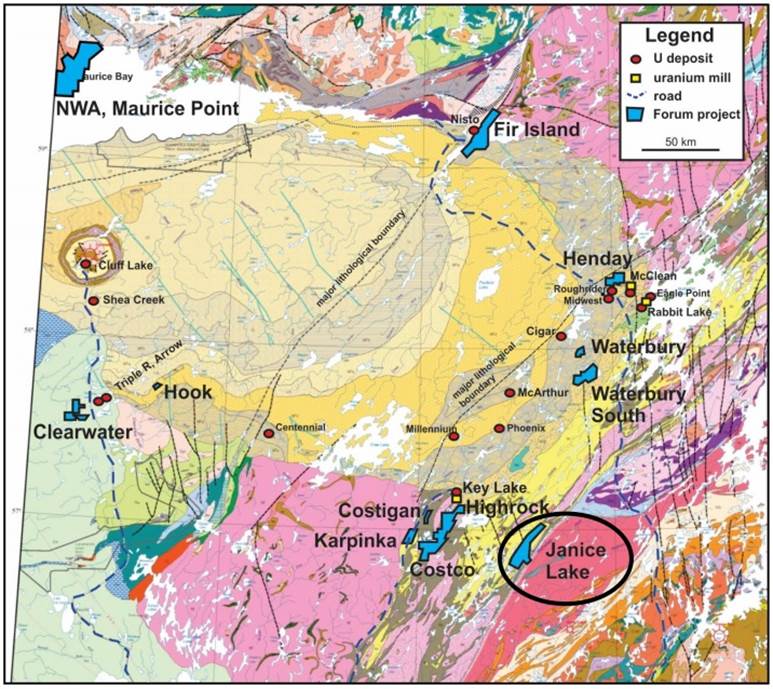
It started all with Forum entering an agreement in February 2018 to acquire 100% of Janice Lake from Transition Metals, for staged payments totaling $250,000 (US$186,000) over four years, spending the same amount on exploration within six months and issuing 8 million shares. The Janice Lake sedimentary copper project is part of the Wollaston Copper Belt, and is located in the south eastern part of the Athabasca Basin in Saskatchewan:
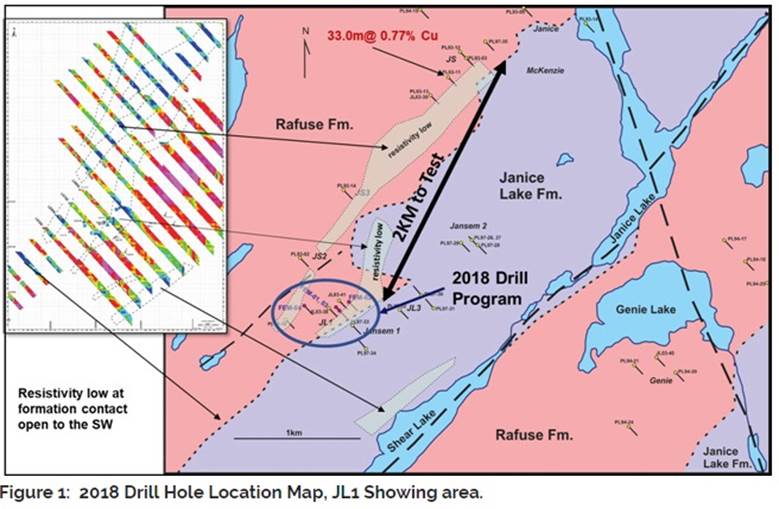
These type of sedimentary copper deposits can be extremely large, with the most significant deposit being Udokan in Russia (1.8Bt @ 1% Cu and 14g/t Ag Measured and Indicated), which is the third largest undeveloped copper deposit worldwide, but they are also found in the DRC and Montana, USA. Forum raised some money, and started drilling the JL-1 target at Janice Lake in August 2018 by itself.
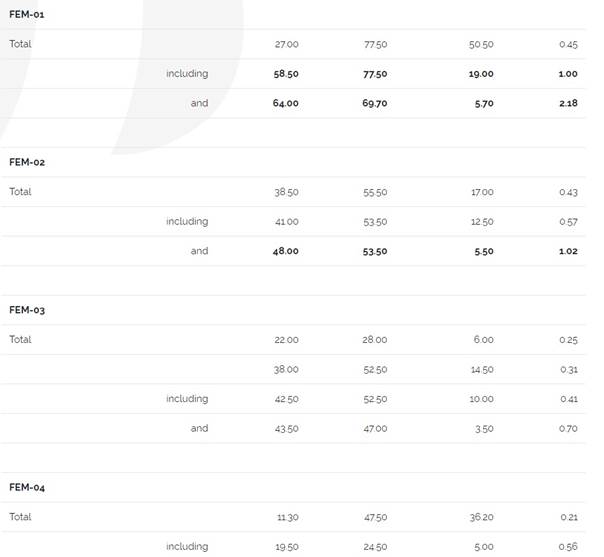
The results, which were announced in Q4, 2018, were not spectacular but decent:
These assays were almost true width, with a margin of +/-10%. Hole FEM-01 and FEM-02 are just economic, comparable (or better) with gold at 1g/t open pit and a 5:1 strip ratio. Final assaying delivered some low grade zinc, lead and silver as well. Mineralization seems to increase in grade and depth to the southwest. This is the reason CEO Mazur was asked by Rio Tinto to stake an additional 30km of claims on strike in this direction. According to Mazur, Forum was targeting 100Mt @0.4-0.6% Cu at the time, but Rio Tinto is aiming at an at the very least five times bigger target now.
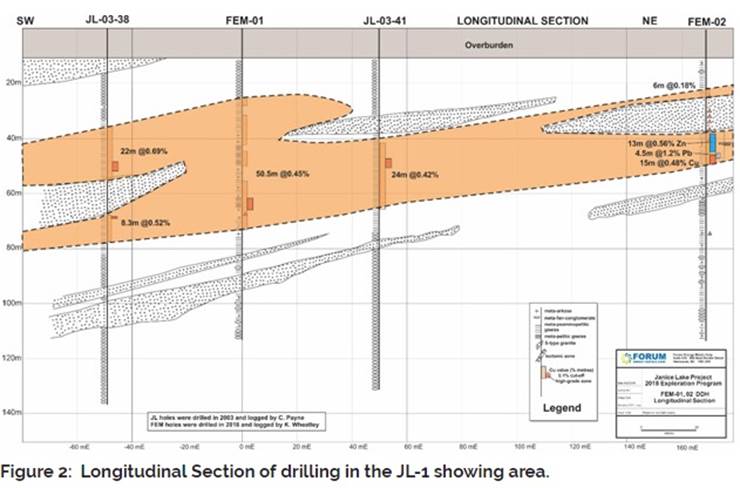
As can be seen in the following section of several hundred meters long, combined with comparable historical drill results by Noranda, Phelps Dodge and the Saskatchewan Government up to 6km to the northeast, indicated that there is potential for discovering a very large, near surface mineralized envelope:
As can be seen, the interpreted orange mineralized zone seems to be layered now and then. This seems to be only the tip of the proverbial iceberg. The company describes this as follows:
“Logging of the drill core and petrographic studies suggest that mineralization is hosted by mafic-rich stratigraphy within more felsic units, opening the possibility for multiple layers of copper mineralization.”
This is probably the key in understanding Janice Lake correctly, and also the potential cause for operators like Noranda and Phelps Dodge for not seeing economic potential earlier. As VP Exploration Ken Wheatley states in this interview:
“I think we have multiple horizons of copper mineralisation that were not necessarily recognised by previous operators. They drilled along strike, but I do not think they realised that that was just one of the layers of copper. We see a series of layers of mineralisation. So, the whole area is mineralised. If we can find some sweet spot areas, then it will help to understand the area better,’ he says. ‘The trick now is going to be getting some grade holes to show that it is economical.The next stage will be hundreds of thousands of metres of drilling to prove up an orebody. That is what it takes to get to pre-feasibility. We think the potential here is to develop an open pit mining resource and mine a lot of tonnes of copper.”
Wheatley thinks as most layers dip 40 grades to the northwest, that the thickness of the entire package of layers is at least 500m, visualized by this schematic section:
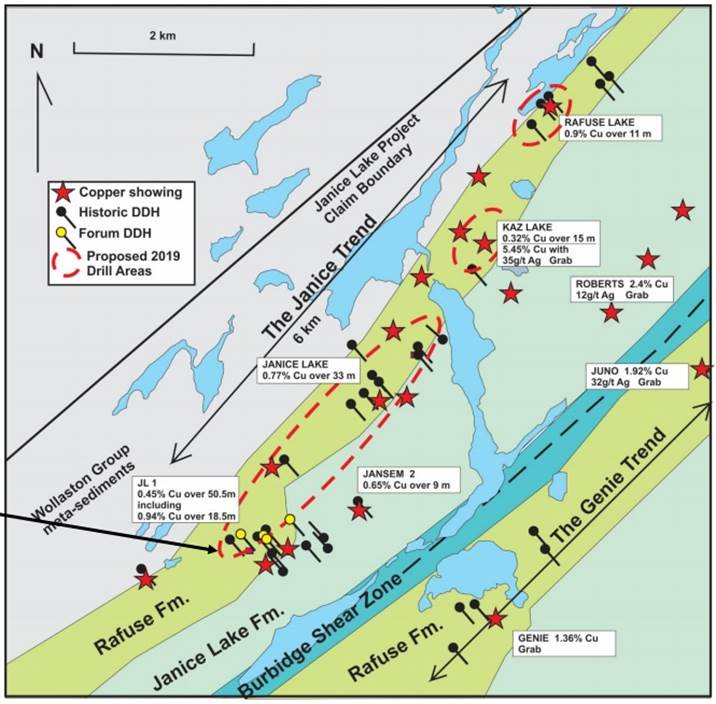
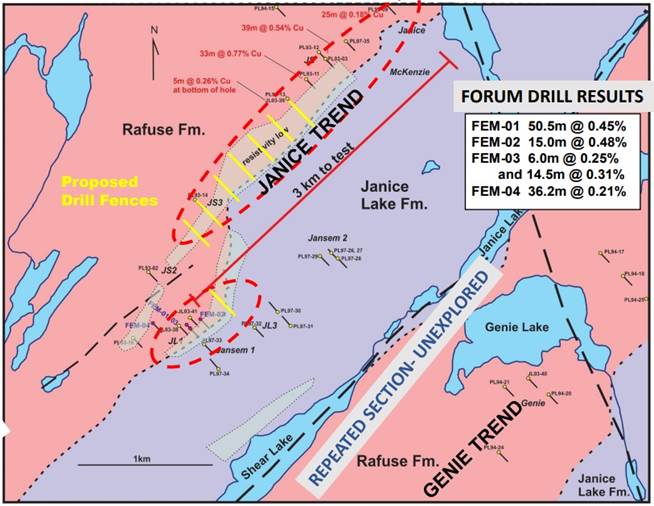
In order to be economic at extrapolated depths of around 300m and deeper, grades and thickness have to increase significantly as it would indicate partially underground mining, but it is still early days. On top of this, Wheatley also thinks there is a second, parallel trend alongside Janice Trend:
“In addition, a second mineralized trend, named the Genie Trend, parallels the Janice Trend. It appears to be a repeated section by faulting of the prospective stratigraphy, significantly expanding the potential for further copper mineralization.”
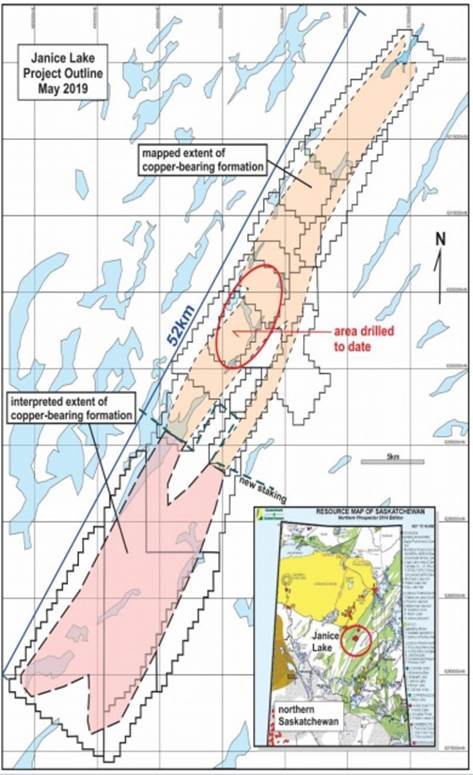
And let’s not forget how large this Janice Lake project really is, as Forum has staked claims along a 52km trend now, including the entire Wollaston Copper Belt mentioned earlier:
After finishing this drill program, and pitching the story successfully, Forum was able to announce a JV agreement with Rio Tinto Exploration Canada Inc. (“RTEC”) on its Janice Lake sedimentary copper project in Saskatchewan.
These are the highlights of the JV terms, per the news release of May 9, 2019:
RTEC will commit to $3 million in exploration over the next 18 months.
RTEC has been granted a four year option to acquire a 51% interest in the Janice Lake Project by spending $10 million in exploration, making $490,000 in cash payments, and servicing the remaining $200,000 in underlying cash payments to Transition Metals Corp. as per the terms of the Forum/Transition Option Agreement dated February 5, 2018, to earn 100% interest in the Janice Lake Project.
RTEC has a second option to earn a further 29% interest (total 80% interest) by spending a further $20 million in exploration over a three year period (total $30 million) and making further cash payments of $150,000 (total $640,000).
Upon RTEC vesting an interest, it may elect to form a joint venture on terms agreed to by the parties. Under the joint venture, a party whose interest is diluted below 10% is converted to a 1% Net Smelter Return Royalty capped at $50 million.
Forum has staked a further 19,312 hectares to the southwest, which doubles the size of the property to 38,250 hectares and covers the entire 52 km of the Wollaston Copperbelt. These new claims have been added to the Option Agreement.
This is, of course, a very interesting deal for Forum, as it had issues raising cash throughout 2018 and 2019, and an amount of C$3 million would have been out of reach for sure in the current subdued base metals sentiment, preventing Forum from doing serious drilling and solid news flow.
RTEC has planned a high-resolution airborne magnetometer survey over the entire extent of the property and approximately 7,000 meters of drilling in 2530 holes in 2019 to meet its first year exploration commitment. The survey has been completed, target holes have been defined and drilling is on its way.
As Forum has added this map to their presentation, it could very well be that Rio Tinto is following its strategy of proposed drill fences (in yellow), which I already discussed with Mazur in January around the VRIC conference:
But Rio Tinto has enough knowledge and experience in-house to determine the best exploration strategy for themselves, of course. I expect Rio to release all results at once in one batch, and shortly afterwards reveal if it is going to continue with the JV or bail out. But as the trends are so large, it could be that it takes another shot at it next year, who knows. To be balanced about this, the same situation could be observed at the BHP-Aston Bay JV, on the equally large Storm Copper project, but BHP chose to return the project to Aston Bay after just one limited (but very expensive as it was more Nordic) drill program, so it is possible. I must say that BHP, more than Rio Tinto, is pretty risk averse and has very high standards regarding deposits and success rates, so this might help Forum in seeing Rio taking multiple shots at Janice Lake.
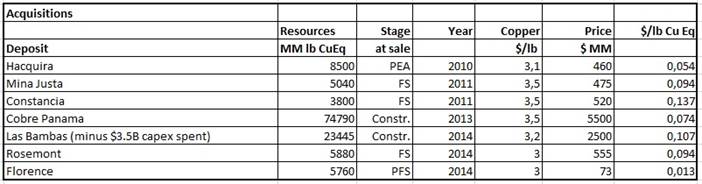
In order to err on the safe side, I am treating this as a binary play, but an interesting one as Rio obviously isn’t killing time, and not seeing this as some kind of recycled stranded asset, and the upside seems to be very significant. If this really appears to have Tier I potential, maybe think Reservoir Minerals upside (acquired in 2016 by Nevsun for US$365 million) in 45 years from now, although Timok Upper Zone wasn’t even Tier I. I pulled some old numbers from my spreadsheets to give a further impression of what copper assets could fetch, although copper prices were much higher at the time of course (now US$2.56/lb Cu):
For example, a 500Mt target @1% Cu generates 11B lb Cu, and if this is economic at C$2.56/lb Cu it might be able to be valued at an arm-waving US$200-250 million, if for example Rio decides to buy Forum out. For something of another comparison, Teck sold a 30% stake in Quebrada Blanca to Sumitomo, which is basically an earn-in for US$1.2 billion, as Sumitomo pays for most of the expansion capex here. The mine is scheduled to produce 16.5B lb Cu for the remaining life of mine. So big copper is a game of big numbers, if Rio really strikes it big, all Forum has to do is keeping the lights on by doing a few small raises, until Rio is ready for a buyout. I should put in a little disclaimer about this, as I, for example, don’t know if Forum has to fund pro rata economic studies and permitting. But I can imagine Rio Tinto doing in-house studies for such a potentially large project, and probably providing Forum with an offer they can’t refuse, well before Rio Tinto wants to develop this all the way into feasibility study, etc.
4. Conclusion
It is rare to see a super major like Rio Tinto doing a JV with a (at the time) C$4 million market cap junior, worth C$30 million. In my view, there must be a reason why Rio is so interested in Janice Lake. I am very curious if the new theory of Forum VP Exploration Ken Wheatley will solve the puzzle that the likes of Noranda and Phelps Dodge couldn’t solve in the past. Rio Tinto is drilling now, and the big question for me is, aside from the impending results of course, which I assume as probably being consistent and economic but not earth-moving at first sight, what its thresholds will be. Hopefully, we are about to find out in a month or two. I am curious.
I hope you will find this article interesting and useful, and will have further interest in my upcoming articles on mining. To never miss a thing, please subscribe to my free newsletter on my website http://www.criticalinvestor.eu to get an email notice of my new articles soon after they are published.
The Critical Investor is a newsletter and comprehensive junior mining platform, providing analysis, blog and newsfeed and all sorts of information about junior mining. The editor is an avid and critical junior mining stock investor from The Netherlands, with an MSc background in construction/project management. Number cruncher at project economics, looking for high quality companies, mostly growth/turnaround/catalyst-driven to avoid too much dependence/influence of long-term commodity pricing/market sentiments, and often looking for long-term deep value. Getting burned in the past himself at junior mining investments by following overly positive sources that more often than not avoided to mention (hidden) risks or critical flaws, The Critical Investor learned his lesson well, and goes a few steps further ever since, providing a fresh, more in-depth, and critical vision on things, hence the name.
The author is not a registered investment advisor, and currently has a long position in this stock. All facts are to be checked by the reader. For more information go to www.forumenergymetals.com and read the company’s profile and official documents on www.sedar.com, also for important risk disclosures. This article is provided for information purposes only, and is not intended to be investment advice of any kind, and all readers are encouraged to do their own due diligence, and talk to their own licensed investment advisors prior to making any investment decisions.
Streetwise Reports Disclosure: 1) The Critical Investor’s disclosures are listed above. 2) The following companies mentioned in the article are sponsors of Streetwise Reports: None. Click here for important disclosures about sponsor fees. The information provided above is for informational purposes only and is not a recommendation to buy or sell any security. 3) Statements and opinions expressed are the opinions of the author and not of Streetwise Reports or its officers. The author is wholly responsible for the validity of the statements. The author was not paid by Streetwise Reports for this article. Streetwise Reports was not paid by the author to publish or syndicate this article. Streetwise Reports requires contributing authors to disclose any shareholdings in, or economic relationships with, companies that they write about. Streetwise Reports relies upon the authors to accurately provide this information and Streetwise Reports has no means of verifying its accuracy.
4) The article does not constitute investment advice. Each reader is encouraged to consult with his or her individual financial professional and any action a reader takes as a result of information presented here is his or her own responsibility. By opening this page, each reader accepts and agrees to Streetwise Reports’ terms of use and full legal disclaimer. This article is not a solicitation for investment. Streetwise Reports does not render general or specific investment advice and the information on Streetwise Reports should not be considered a recommendation to buy or sell any security. Streetwise Reports does not endorse or recommend the business, products, services or securities of any company mentioned on Streetwise Reports. 5) From time to time, Streetwise Reports LLC and its directors, officers, employees or members of their families, as well as persons interviewed for articles and interviews on the site, may have a long or short position in securities mentioned. Directors, officers, employees or members of their immediate families are prohibited from making purchases and/or sales of those securities in the open market or otherwise from the time of the interview or the decision to write an article until three business days after the publication of the interview or article. The foregoing prohibition does not apply to articles that in substance only restate previously published company releases. As of the date of this article, officers and/or employees of Streetwise Reports LLC (including members of their household) own securities of Rio Tinto, a company mentioned in this article.
Peter Epstein of Epstein Research does the math and reviews the details of an expected joint venture and the lithium market overall, and determines this company will benefit from the upsides.
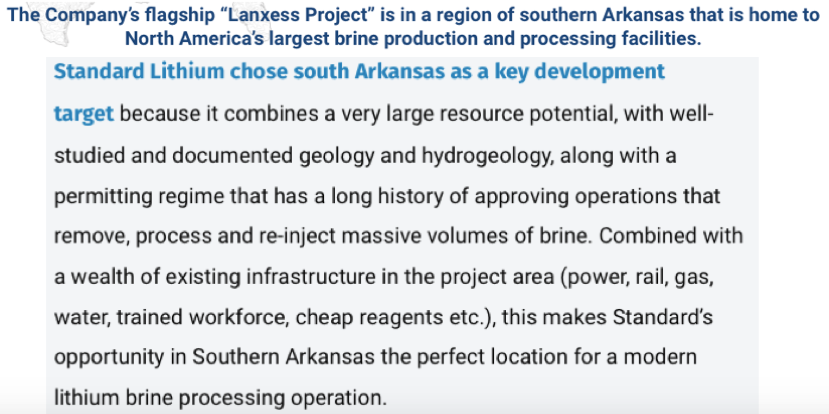
Fabrication of phases one and two of Standard Lithium’s LiSTR direct lithium extraction demonstration plant (DP) are complete. All site construction works are on schedule, the concrete slab and foundations required to house the DP are in place. Nine modules are in transit and expected to arrive at the Lanxess South Plant facility in southern Arkansas before month’s end.
When fully commissioned, the DP will continuously process an input “tail brine” flow of 50 gallons per minute, an annualized production rate of 100150 tonnes of lithium carbonate equivalent (LCE). Lanxess “tail brine” is a heated, mineralized flow of water (brine) exiting the Lanxess South Plant facility, stripped of bromine, containing significant concentrations of lithium.
The DP showcases Standard’s proprietary LiSTR technology, which uses a solid sorbent material to selectively extract lithium. The environmentally friendly process eliminates the need for evaporation ponds and reduces processing time from 918 months to a matter of hours while, at the same time, greatly increasing lithium recovery rates.
Dr. Andy Robinson, president and COO, commented, “The Standard Lithium team and our partners continue to execute on our strategic plan to timely advance our project in Southern Arkansas. Over two years of disciplined process design and engineering work has brought us to this point, and we look forward to announcing the completion of additional key milestones in the near-future.”
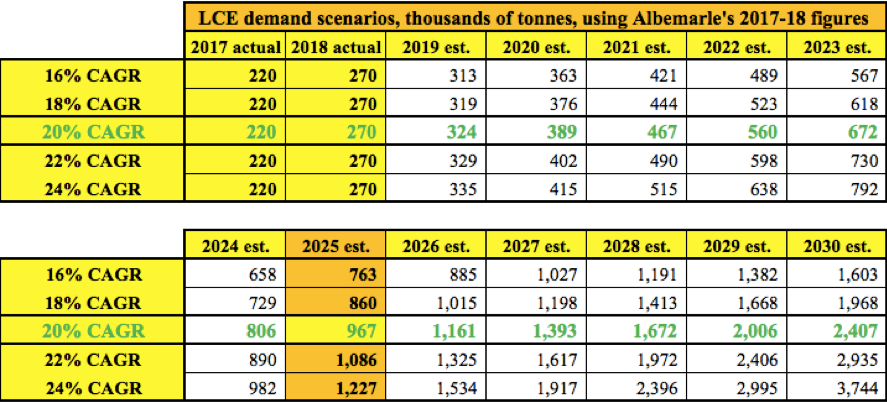
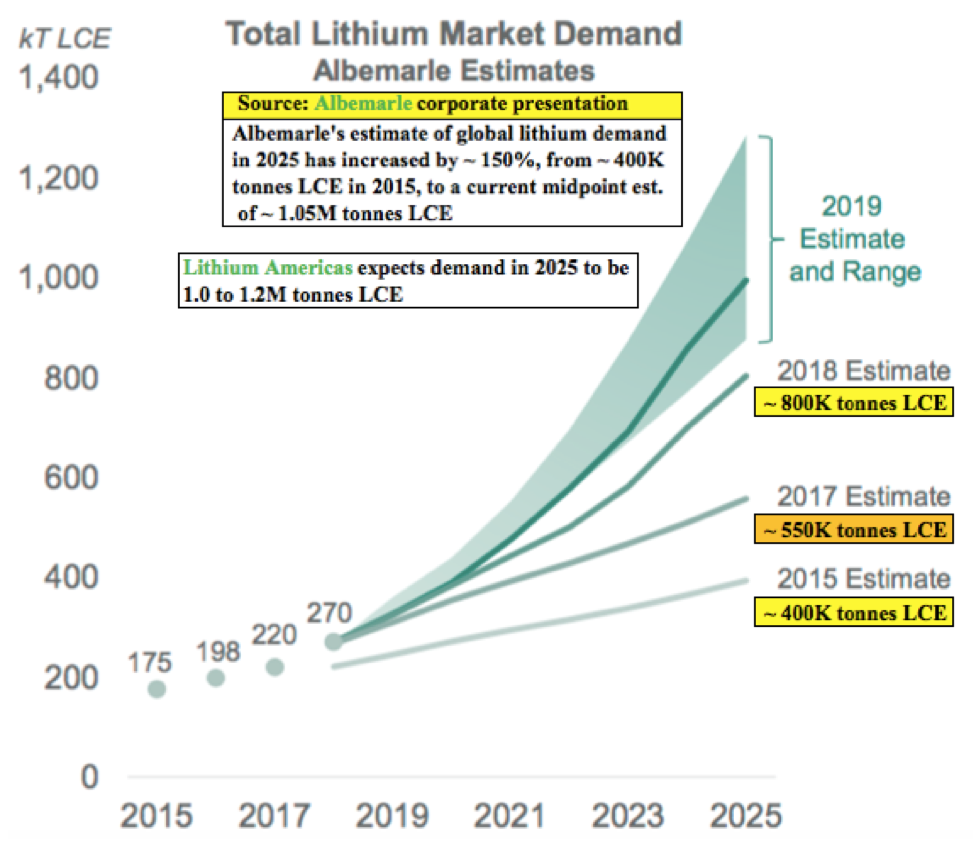
There’s a massive disconnect in the lithium world. For years, demand forecasts have been going up. The demand side of the equationdriven by both energy storage and the electrification of passenger and commercial vehiclesis likely to increase at a compound annual growth rate (CAGR) of at least 16%, perhaps 20% or more. Albemarle Corp. (ALB:NYSE) has a particularly good graphic depicting this unmistakable trend.
However, that hardly matters if global supply can’t keep up, which I highly doubt that it can. In the chart above I show thousands of tonnes of LCE potentially consumed each year based on a range of CAGRs. For example, at a 20% CAGR from Albemarle’s 270,000-tonne figure in 2018, demand could reach 967,000 tonnes in 2025.
A source I trust even more is Benchmark Mineral Intelligence, which has 2018 consumption at ~285K tonnes LCE, growing by 22.8% this year to ~350K tonnes. Since I’m using a chart from Albemarle [see below], I use their 270,000 tonne figure in my CAGR scenarios.
In a July 30 blog post by Benchmark Minerals Intelligence, they say that “lithium supply has to increase at a 19% CAGR over the next six years [from 2019] to meet 2025 demand. Even at the height of the market, the industry only managed to grow by 11% per year, on average, from 2015¬2018.”
In my opinion, it’s not necessary to try to assess global supply scenarios over the next 10 years. Why? No scenario can meet true demand. The point of the last several paragraphs is that the market will take every battery-grade tonne of lithium chemicals produced by Standard Lithium and Lanxess for decades to come. And, the price in 2.5 years, when Standard starts commercial production, will likely be higher than it is today.
I think it’s important to remind readers that Lanxess is one of the premier specialty chemicals players in the world. Standard Lithium and Lanxess are expected to form a joint venture (JV) next year, at which point Standard Lithium’s burn rate will be greatly reduced to its JV share of 30% and, more importantly, Lanxess has committed to provide 100% of project financing to the JV, operate the plants and take 100% of the lithium off-take.
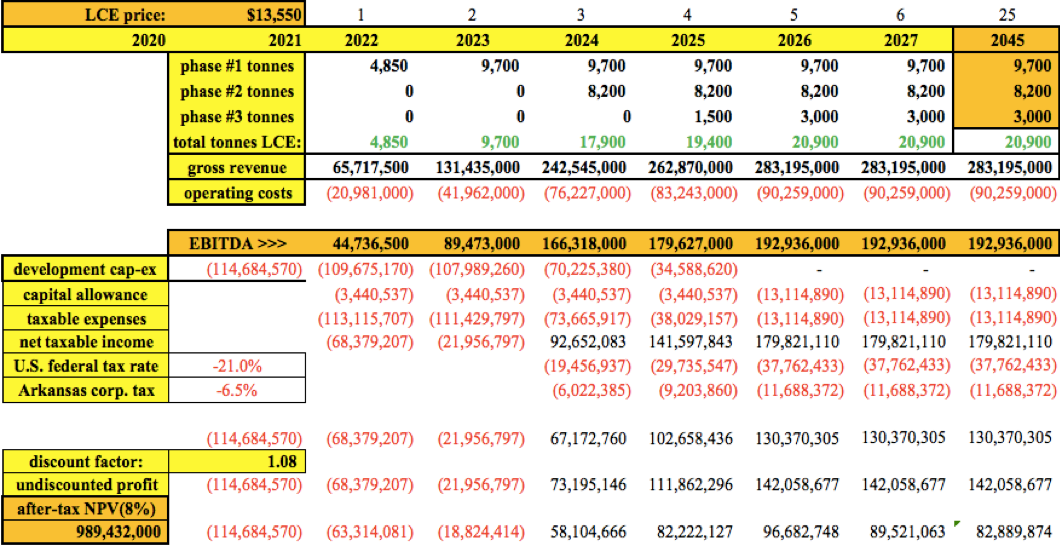
PEA economics
Earlier this month, Standard Lithium’s preliminary economic assessment (PEA) was filed on SEDAR. In it, the after-tax net present value (NPV), discounted at 8%, is US$989.4 million = CA$1.316 billion. If 30% of that amount is attributable to Standard’s project interest, that’s CA$395 million, equal to $4.51 per share (assuming 87.6 million shares outstanding).
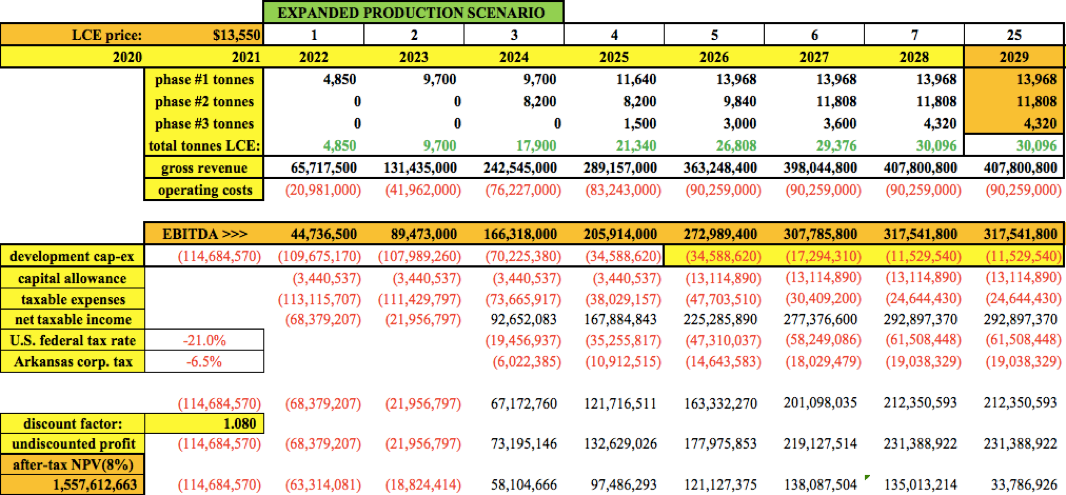
Given that management has discussed the potential of operating at 30,000 tonnes LCE/year versus the more conservative 20,900 tonnes/year in the PEA, I adjusted the cash flow figures found on page 202 of the technical report to increase production (plus incremental development capex) to see what it would do to the NPV.
With two annual increases of 20% for each phase, total output rises to 30,096/year from 2028 on. I added US$75 million in development capex spread over four years to pay for that increased capacity.
In that scenario, all else equal, the NPV increases by 57% to CA$2.1 billion, 30% of which is CA$621.5 million, or $7.10 per share. Most readers recognize that pre-revenue metals and mining juniors never trade at 100% of their estimated after-tax NPVs. Depending on how advanced a company’s project(s) are, they often trade between 15% to 65% of NPV. Reasons for the discount are 1) time until cash flow begins; 2) project risks; and 3) future capital raises (equity dilution).
In the base-case PEA scenario, Standard Lithium is trading at 23.5% of its share of project NPV. In the expanded production scenario, Standard is trading at 11.2% of its share of NPVan 88.2% discount. Is this valuation discount warranted? In looking at the factors that dictate a company’s discount to NPV, I think Standard stands out favorably on all three. For example, time to cash flow is 2430 months; many PEA-stage companies are 4872 months from first cash flow.
Regarding project-level risks, Standard’s Arkansas project, bolted onto Lanxess’ existing brine processing facilities, is low risk compared to projects in countries with significant geopolitical, permitting, environmental, community relations, climate and exploration risks, or projects lacking in infrastructure, labor, mining services, etc.
Best of all, Standard will have a world-class specialty chemical company as a strategic and financial partner. In my opinion, Lanxess is in the same league as Albemarle or SQM SQM (SQM:NYSE). It’s entirely possible that the lithium chemicals produced by Standard Lithium and Lanxess could be customized and sold into niche markets at a premium to prevailing battery-grade lithium prices.
Finally, equity dilution risk is greater for peer PEA-stage companies than for Standard Lithium. Once Lanxess and Standard formalize their JV early next year, Standard will be virtually free-carried through commercial production. That means the company might only need another CA$20 million in equity capital between now and year-end 2020.
Adjusting my earlier calculations for 110 million shares outstanding instead of 87.6 million, the NPV/share would be $3.59, or $5.65 per share in the expanded production scenario. Therefore, pro forma for 110 million shares, Standard is valued at 24% (its share of) the after-tax NPV value in the PEA, and 15.2% of NPV in the expanded production scenario.
Standard Lithium compared to producing lithium companies
Trading at 24% or 15.2% of after-tax NPV is one way of looking at valuation compared to non-producing peers. Another way to consider valuation is by comparing anticipated revenue or EBITDA (earnings before interest, taxes, depreciation and amortization) to that of current producers like Albemarle, SQM and Orocobre Ltd. (ORL:TSX; ORE:ASX). Those three trade at an average EV (enterprise value) to revenue multiple of 3.2x.
Standard Lithium’s 30% share of project revenue equates to CA$113 million in 2026, the first year of 20,900 tonnes LCE/year. Discounting that future revenue back six years at a 10% discount factor equals $63.8 million; $63.8 million in revenue times a 3.2 multiple = $204.1 million. Dividing that figure by a pro forma 110 million shares outstanding = $1.86 per share in today’s dollars. Under the expanded production scenario (30,096 tonnes/year), a 3.2x revenue multiple equates to $2.67/share.
Looking quickly at EBITDA multiples, lithium brine majors Albemarle, SQM and Livent Corp. (LTHM:NYSE)trade at an average EV/EBITDA multiple of ~8.5 times. Applying an 8.5x multiple to Standard’s 30% interest in the PEA-derived EBITDA, and discounting that value by 10% for six years, generates a share price of $3.16. In the expanded production case, the share price is $5.20.
One last example: I took a closer look at Orocobre. It produced 12.6K tonnes of lithium in the 12 months ended June 30, 2019, of which it owns 66.5% of the economics. So that’s 8.4K tonnes attributable to Orocobre. It has an EV of CA$434 million, it’s trading at $51.6K per tonne of attributable production.
Standard Lithium could be producing 7,00010,000 tonnes LCE/year, (net to them), by the mid- to late 2020s. Taking the midpoint of 8,500 tonnes x $51,600 = $438 million. That’s $4 per share (based on 110 million pro forma shares). Discounting the share price back at 10% for six years equates to a share price of $2.26.
Conclusion
The above commentary is for illustrative purposes only. Calculated prices per share are not price targets, especially since they range from $1.86 to $5.86 on an estimated pro forma share count of 110 million. In the first half of next year, Standard Lithium’s cash burn will decline as Lanxess picks up 70% of the burden and arranges 100% of the JV funding through commercialization.
I believe that the global lithium market will be better in 2020 than in 2019, better again in 2021 versus 2020, and better still in 2022. As I have mentioned in other articles, when the market turns for lithium juniors there will be far fewer viable companies around to absorb the wave of investment dollars. By 2022, the Standard Lithium/Lanxess JV might be able to lock in medium or long-term contracts at high prices.
Most of the U.S. western states’ brine projects are dead. Argentina looks very challenging lately, on a number of fronts, except for the more advanced projects. Standard Lithium will clearly be one of the primary beneficiaries of an improved market as it approaches commercial production largely on time and on budget.
Peter Epstein is the founder of Epstein Research. His background is in company and financial analysis. He holds an MBA degree in financial analysis from New York University’s Stern School of Business.
Disclosures: The content of this article is for information only. Readers fully understand and agree that nothing contained herein, written by Peter Epstein of Epstein Research [ER], (together, [ER]) about Standard Lithium, including but not limited to, commentary, opinions, views, assumptions, reported facts, calculations, etc. is not to be considered implicit or explicit investment advice. Nothing contained herein is a recommendation or solicitation to buy or sell any security. [ER] is not responsible under any circumstances for investment actions taken by the reader. [ER] has never been, and is not currently, a registered or licensed financial advisor or broker/dealer, investment advisor, stockbroker, trader, money manager, compliance or legal officer, and does not perform market making activities. [ER] is not directly employed by any company, group, organization, party or person. The shares of Standard Lithuim are highly speculative, not suitable for all investors. Readers understand and agree that investments in small cap stocks can result in a 100% loss of invested funds. It is assumed and agreed upon by readers that they will consult with their own licensed or registered financial advisors before making any investment decisions.
At the time this interview was posted, Peter Epstein owned shares of Standard Lithium, and the Company was an advertiser on [ER].
Readers understand and agree that they must conduct their own due diligence above and beyond reading this article. While the author believes he’s diligent in screening out companies that, for any reasons whatsoever, are unattractive investment opportunities, he cannot guarantee that his efforts will (or have been) successful. [ER] is not responsible for any perceived, or actual, errors including, but not limited to, commentary, opinions, views, assumptions, reported facts & financial calculations, or for the completeness of this article or future content. [ER] is not expected or required to subsequently follow or cover events & news, or write about any particular company or topic. [ER] is not an expert in any company, industry sector or investment topic.
Streetwise Reports Disclosure: 1) Peter Epstein’s disclosures are listed above. 2) The following companies mentioned in the article are billboard sponsors of Streetwise Reports: None. Click here for important disclosures about sponsor fees. The information provided above is for informational purposes only and is not a recommendation to buy or sell any security. 3) Statements and opinions expressed are the opinions of the author and not of Streetwise Reports or its officers. The author is wholly responsible for the validity of the statements. The author was not paid by Streetwise Reports for this article. Streetwise Reports was not paid by the author to publish or syndicate this article. Streetwise Reports requires contributing authors to disclose any shareholdings in, or economic relationships with, companies that they write about. Streetwise Reports relies upon the authors to accurately provide this information and Streetwise Reports has no means of verifying its accuracy.
4) The article does not constitute investment advice. Each reader is encouraged to consult with his or her individual financial professional and any action a reader takes as a result of information presented here is his or her own responsibility. By opening this page, each reader accepts and agrees to Streetwise Reports’ terms of use and full legal disclaimer. This article is not a solicitation for investment. Streetwise Reports does not render general or specific investment advice and the information on Streetwise Reports should not be considered a recommendation to buy or sell any security. Streetwise Reports does not endorse or recommend the business, products, services or securities of any company mentioned on Streetwise Reports. 5) From time to time, Streetwise Reports LLC and its directors, officers, employees or members of their families, as well as persons interviewed for articles and interviews on the site, may have a long or short position in securities mentioned. Directors, officers, employees or members of their immediate families are prohibited from making purchases and/or sales of those securities in the open market or otherwise from the time of the interview or the decision to write an article until three business days after the publication of the interview or article. The foregoing prohibition does not apply to articles that in substance only restate previously published company releases.
Observations and takeaways from a visit to the company’s Bulgaria properties are given in a Haywood report.
In an Aug. 21 research note, Haywood analyst Mick Carew reported that Velocity Minerals Ltd. (VLC:TSX.V; VLCJF:OTCQB) is “is on track to repeat Atlantic Gold success” with its array of Bulgaria properties. The explorer would achieve this, he added, “through the development of several at/near surface epithermal gold deposits proximal to a carbon-in-leach (CIL) processing plant owned by joint venture partner Gorubso Kardzhali,” the only such facility in the country.
Carew provided the highlights from his recent site visit to Velocity’s exploration projects in Bulgaria. Velocity’s partnership with Gorubso is key, he pointed out. It is advantageous in terms of permitting and future capex requirements but potentially “invaluable for both government and local community relationships as well,” he wrote. The alliance covers all existing and future Velocity-Gorubso projects within a 10,400 square kilometer area around the CIL plant.
Of the many projects the two companies co-own, Rozino (Velocity owns 70%) is “a potential near-term producer,” noted Carew. It is the most advanced, having an NI 43-101 compliant resource of 573,000 ounces of gold grading 1.37 grams per ton. Rozino is located about 83 kilometers from Gorubso’s plant. Drilling, up to 14,000 meters’ worth, is underway at Rozino and expected to be completed this month.
Carew highlighted that Velocity is led by an experienced management team, with Keith Henderson as the CEO, Stuart Mills the vice president of exploration and Mark Cruise, director and co-founder of Trevali Mining, a board member.
Another advantage Velocity has, the analyst wrote, is a robust project portfolio offering flexibility and optionality. It encompasses Obichnik, where 6,000 meters are currently being drilled, Sedefche, for which a reverse circulation drill program is planned, and Makedontsi.
Looking forward, Velocity will continue exploring its properties and delivering drilling updates.
Haywood does not cover Velocity so it does not have a rating or a price target on it. Velocity shares are now trading at around CA$0.47.
Disclosure: 1) Doresa Banning compiled this article for Streetwise Reports LLC and provides services to Streetwise Reports as an independent contractor. She or members of her household own securities of the following companies mentioned in the article: None. She or members of her household are paid by the following companies mentioned in this article: None. 2) The following companies mentioned in this article are billboard sponsors of Streetwise Reports: None. Click here for important disclosures about sponsor fees. 3) Comments and opinions expressed are those of the specific experts and not of Streetwise Reports or its officers. The information provided above is for informational purposes only and is not a recommendation to buy or sell any security. 4) The article does not constitute investment advice. Each reader is encouraged to consult with his or her individual financial professional and any action a reader takes as a result of information presented here is his or her own responsibility. By opening this page, each reader accepts and agrees to Streetwise Reports’ terms of use and full legal disclaimer. This article is not a solicitation for investment. Streetwise Reports does not render general or specific investment advice and the information on Streetwise Reports should not be considered a recommendation to buy or sell any security. Streetwise Reports does not endorse or recommend the business, products, services or securities of any company mentioned on Streetwise Reports. 5) From time to time, Streetwise Reports LLC and its directors, officers, employees or members of their families, as well as persons interviewed for articles and interviews on the site, may have a long or short position in securities mentioned. Directors, officers, employees or members of their immediate families are prohibited from making purchases and/or sales of those securities in the open market or otherwise from the time of the interview or the decision to write an article until three business days after the publication of the interview or article. The foregoing prohibition does not apply to articles that in substance only restate previously published company releases. As of the date of this article, officers and/or employees of Streetwise Reports LLC (including members of their household) own securities of Velocity Minerals, a company mentioned in this article.
Disclosures from Haywood Securities, Velocity Minerals Ltd., Uncovered Radar Flash, August 21, 2019
Analyst Certification: I, Mick Carew, hereby certify that the views expressed in this report (which includes the rating assigned to the issuers shares as well as the analytical substance and tone of the report) accurately reflect my/our personal views about the subject securities and the issuer. No part of my/our compensation was, is, or will be directly or indirectly related to the specific recommendations.
Important Disclosures
Of the companies included in the report the following Important Disclosures apply: ▪The Analyst(s) preparing this report (or a member of the Analysts’ households) have a financial interest in Marathon Gold Corp. (MOZ-T), Pure Gold Mining Inc. (PGM-V).
▪ As of the end of the month immediately preceding this publication either Haywood Securities, Inc., one of its subsidiaries, its officers or directors beneficially owned 1% or more of Velocity Minerals Ltd. (VLC-V).
▪ Haywood Securities Inc. or an Affiliate has received compensation for investment banking services from Velocity Minerals Ltd. (VLC-V) in the past 12 months.
Other material conflict of interest of the research analyst of which the research analyst or Haywood Securities Inc. knows or has reason to know at the time of publication or at the time of public appearance: n/a.
Here are the latest links to our coverage of the Commitment of Traders data changes.
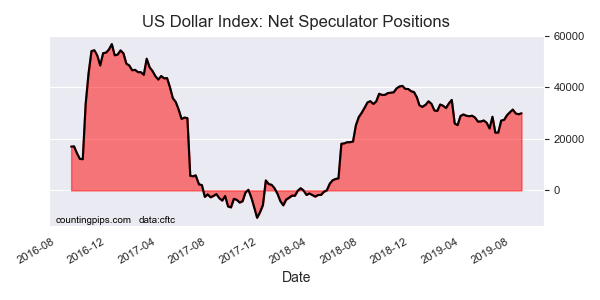
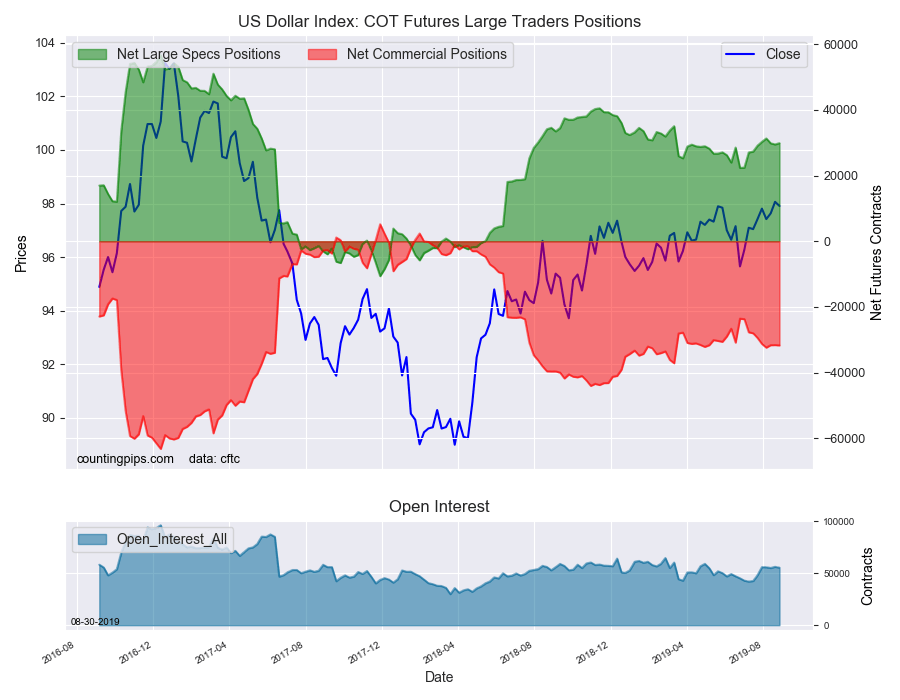
This week in the COT data, currency speculators slightly edged their US Dollar Index bullish positions higher following a couple of modest down weeks. The dollar positions, like the dollar price itself, have been remarkably consistent and have remained close to the +30,000 net contract level.
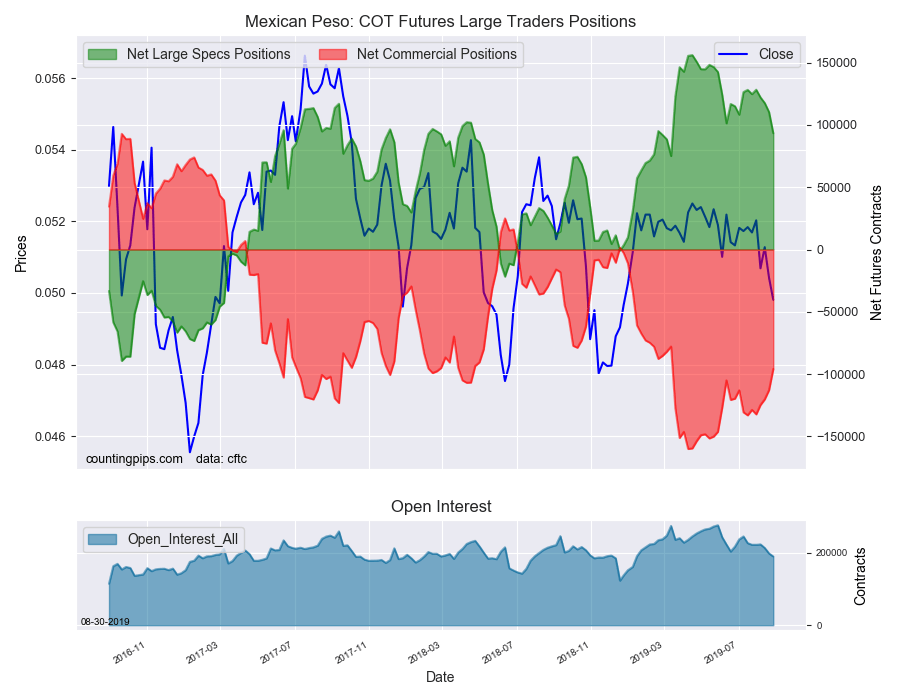
The Mexican peso positions fell again this week for a fourth week in a row. The peso bullish bets have now fallen under the +100,000 net contract level for the first time since March and after making a record high bullish level in April above +150,000 contracts.
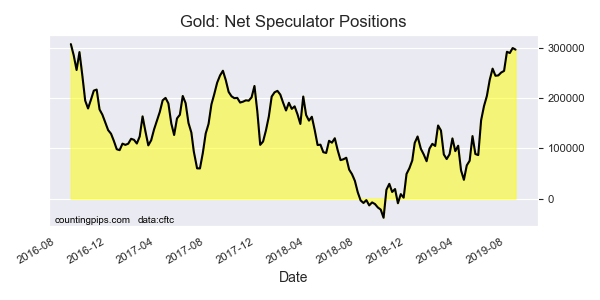
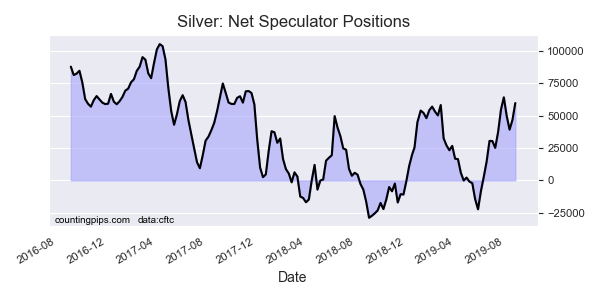
Precious metals speculators slightly trimmed their Gold positions this week while Silver positions were pushed sharply higher. Gold speculators cut back on their bullish bets this week after pushing positions to the highest level since 2016 last week.
Silver speculators boosted their bets this week for a second straight week and bullish positions rose back to almost +60,000 net contracts.
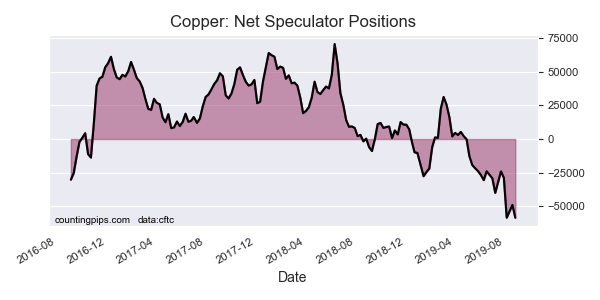
Copper speculators, meanwhile, pushed their bearish bets sharply higher and to a new all-time record high bearish position. The previous record was set only three weeks ago which was followed up by declining bearish bets for two weeks.
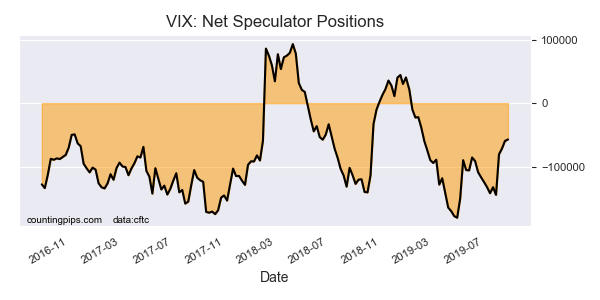
VIX speculators reduced their bearish positions for a fourth consecutive week as uncertainty in the markets has taken a toll on a low volatility outlook. Spec positions had reached a record high bearish level as recently as April but have now started to decline over past months to the lowest level since February 5th.
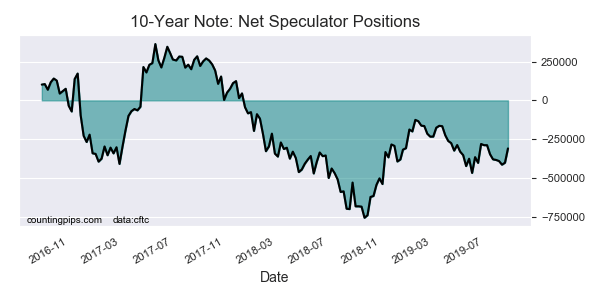
The 10-Year Bond speculators sharply reduced their bearish bets this week by over 90,000 contracts. The week’s pullback brings the current position to the least bearish level since July 9th.
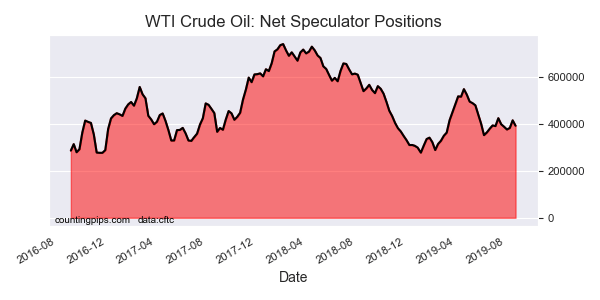
Lastly, the WTI Crude Oil speculators decreased their bullish bets after two weeks of gains. The current standing remains bullish back is back below the +400,000 net contract level this week for fifth time out of the past six weeks.
Large currency speculators increased their net positions in the US Dollar Index futures markets this week, according to the latest Commitment of Traders (COT) data released by the Commodity Futures Trading Commission (CFTC) on Friday. See full article.
The large speculator contracts of WTI crude futures totaled a net position of 391,650 contracts, according to the latest data this week. This was a change of -22,985 contracts from the previous weekly total. See full article.
Large speculator contracts of the 10-Year Bond futures totaled a net position of -309,904 contracts, according to the latest data this week. This was a change of 91,900 contracts from the previous weekly total. See full article.
Large precious metals speculator contracts of the Gold futures totaled a net position of 296,838 contracts, according to the latest data this week. This was a change of -3,155 contracts from the previous weekly total. See full article.
Large stock market volatility speculator contracts of the VIX futures totaled a net position of -57,153 contracts, according to the latest data this week. This was a change of 2,345 contracts from the previous weekly total. See full article.
Large precious metals speculator contracts of the silver futures totaled a net position of 59,852 contracts, according to the latest data this week. This was a change of 13,138 contracts from the previous weekly total. See full article.
Metals speculator contracts of the copper futures totaled a net position of -58,480 contracts, according to the latest data this week. This was a change of -9,535 contracts from the previous weekly total. See full article.
*COT Report: The COT data, released weekly to the public each Friday, is updated through the most recent Tuesday (data is 3 days old) and shows a quick view of how large speculators or non-commercials (for-profit traders) were positioned in the futures markets.
The CFTC categorizes trader positions according to commercial hedgers (traders who use futures contracts for hedging as part of the business), non-commercials (large traders who speculate to realize trading profits) and nonreportable traders (usually small traders/speculators).
Large currency speculators lifted their bullish net positions in the US Dollar Index futures markets this week, according to the latest Commitment of Traders (COT) data released by the Commodity Futures Trading Commission (CFTC) on Friday.
The non-commercial futures contracts of US Dollar Index futures, traded by large speculators and hedge funds, totaled a net position of 29,897 contracts in the data reported through Tuesday August 27th. This was a weekly lift of 398 contracts from the previous week which had a total of 29,499 net contracts.
This week’s net position was the result of the gross bullish position (longs) declining by -961 contracts (to a weekly total of 48,102 contracts) compared to the gross bearish position (shorts) which saw a larger decline by -1,359 contracts on the week (to a total of 18,205 contracts).
US Dollar Index speculators inched up their bullish bets this week following two down weeks. Overall, dollar index speculative positions have risen for seven out of the past ten weeks and maintain their bullish standing right around the +30,000 net contract level.
Individual Currencies Data this week:
In the other major currency contracts data, we saw only one substantial change (+ or – 10,000 contracts) in the speculators category this week.
Mexican peso speculator positions fell sharply this week by over -17,000 contracts and declined for a fourth consecutive week. Peso positions have been one of the only currencies with positive speculator positions this year and reached an all-time record high bullish position on April 16th. Since then, bullish positions have been faltering and are now under the +100,000 net contract level for the first time since March 12th.
Overall, the major currencies that saw improving speculator positions this week were the US dollar index (398 weekly change in contracts), British pound sterling (3,390 contracts), Japanese yen (2,453 contracts), Swiss franc (7,317 contracts) and the Australian dollar (1,749 contracts).
The currencies whose speculative bets declined this week were the euro (-827 weekly change in contracts), Canadian dollar (-2,132 contracts), New Zealand dollar (-7,787 contracts) and the Mexican peso (-17,045 contracts).
Other Notables for the week:
Japanese yen speculator positions continued to rise and have now improved for six straight weeks. The yen has risen by a total of +44,987 contracts in just these past six weeks as bets have now been in bullish territory for four weeks. The improved yen level marks the best standing since November 1st of 2016.
Swiss franc positions rose for a third straight week this week. The franc positions are now just barely in bearish territory (-3,800 contracts) and this marks the least bearish level since November 3rd of 2017 (a span of 99 weeks). Franc positions reached their most bearish level of the year on May 14th at -40,010 net contracts and have improved consistently since then as the franc benefits from risk off market themes (similar to the Japanese yen).
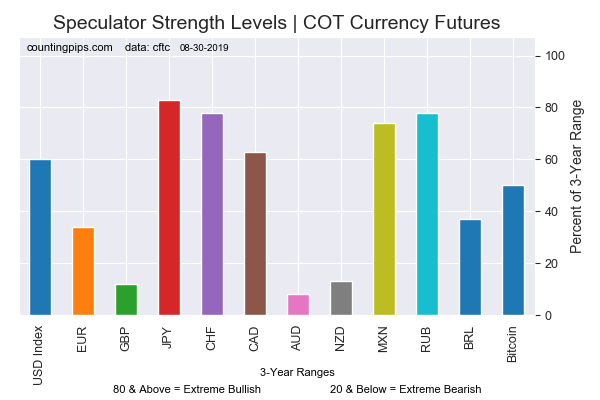
Chart: Current Strength of Each Currency compared to their 3-Year Range
See the table and individual currency charts below.
Table of Large Speculator Levels & Weekly Changes:
Currency
Net Speculator Position
Specs Weekly Change
USD Index
29,897
398
EuroFx
-38,804
-827
GBP
-89,028
3,390
JPY
33,607
2,453
CHF
-3,800
7,317
CAD
10,905
-2,132
AUD
-61,032
1,749
NZD
-26,047
-7,787
MXN
93,314
-17,045
This latest COT data is through Tuesday and shows a quick view of how large speculators or non-commercials (for-profit traders) were positioned in the futures markets. All currency positions are in direct relation to the US dollar where, for example, a bet for the euro is a bet that the euro will rise versus the dollar while a bet against the euro will be a bet that the dollar will gain versus the euro.
Weekly Charts: Large Trader Weekly Positions vs Price
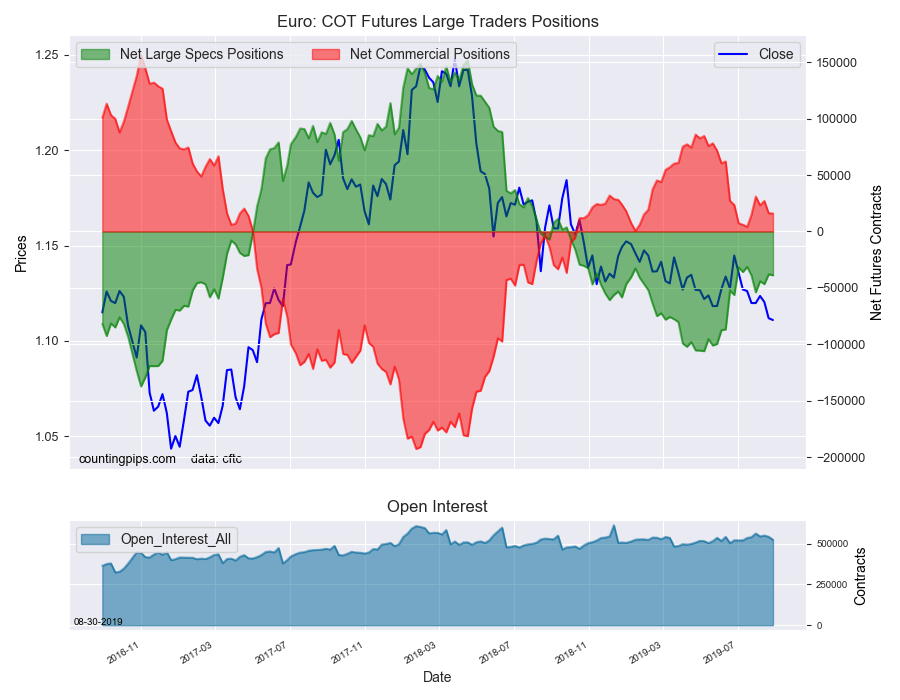
EuroFX:
The Euro large speculator standing this week reached a net position of -38,804 contracts in the data reported through Tuesday. This was a weekly reduction of -827 contracts from the previous week which had a total of -37,977 net contracts.
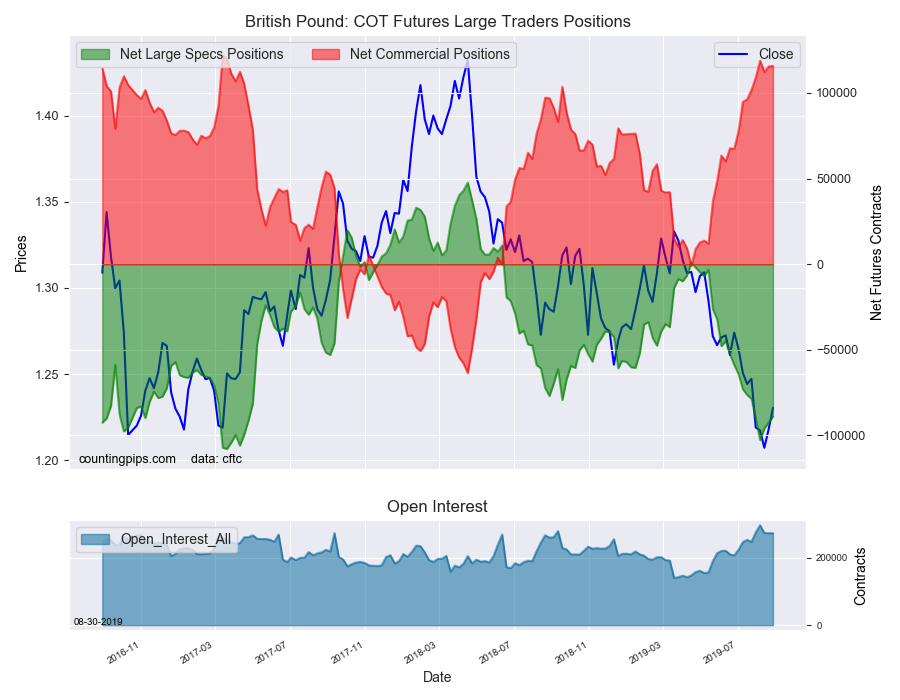
British Pound Sterling:
The large British pound sterling speculator level was a net position of -89,028 contracts in the data reported this week. This was a weekly boost of 3,390 contracts from the previous week which had a total of -92,418 net contracts.
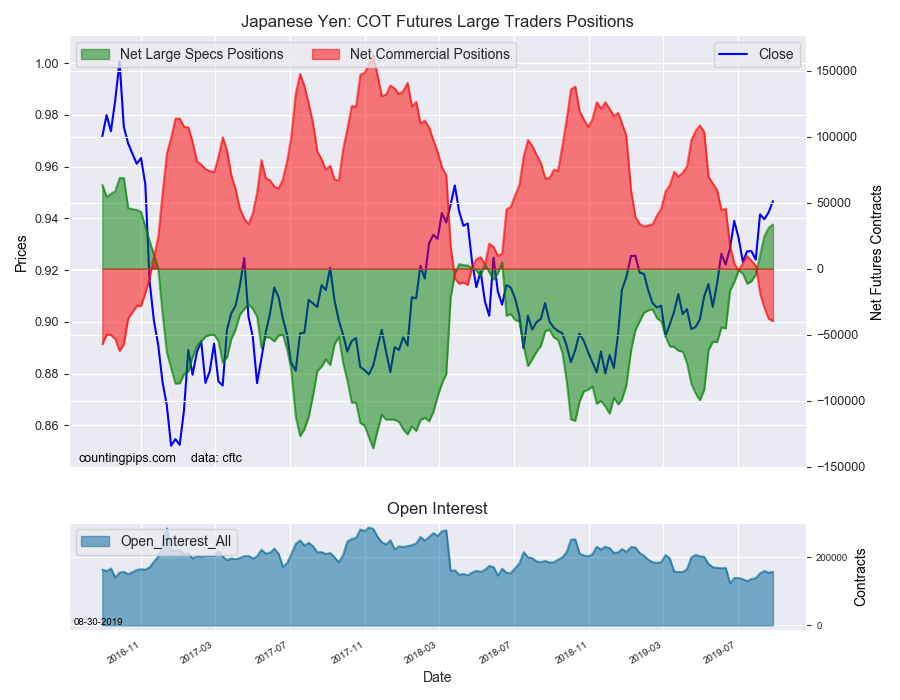
Japanese Yen:
Large Japanese yen speculators equaled a net position of 33,607 contracts in this week’s data. This was a weekly boost of 2,453 contracts from the previous week which had a total of 31,154 net contracts.
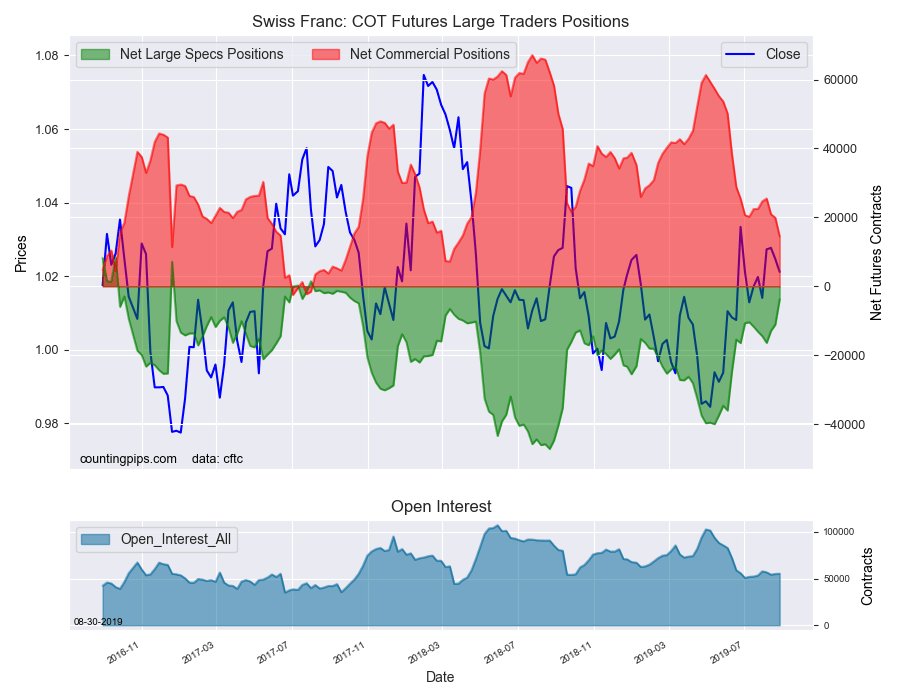
Swiss Franc:
The Swiss franc speculator standing this week recorded a net position of -3,800 contracts in the data through Tuesday. This was a weekly gain of 7,317 contracts from the previous week which had a total of -11,117 net contracts.
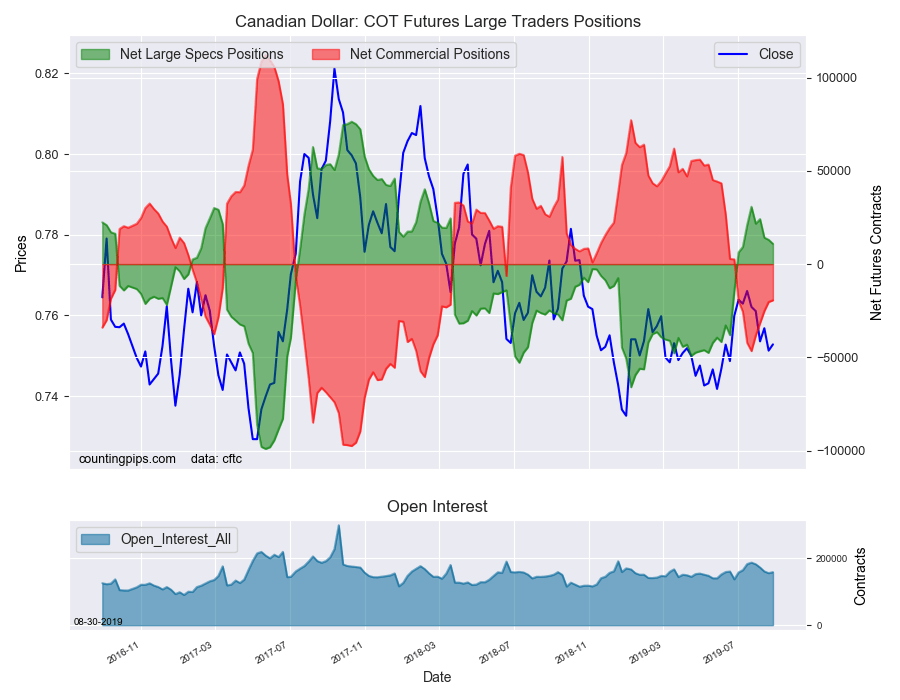
Canadian Dollar:
Canadian dollar speculators recorded a net position of 10,905 contracts this week. This was a decline of -2,132 contracts from the previous week which had a total of 13,037 net contracts.
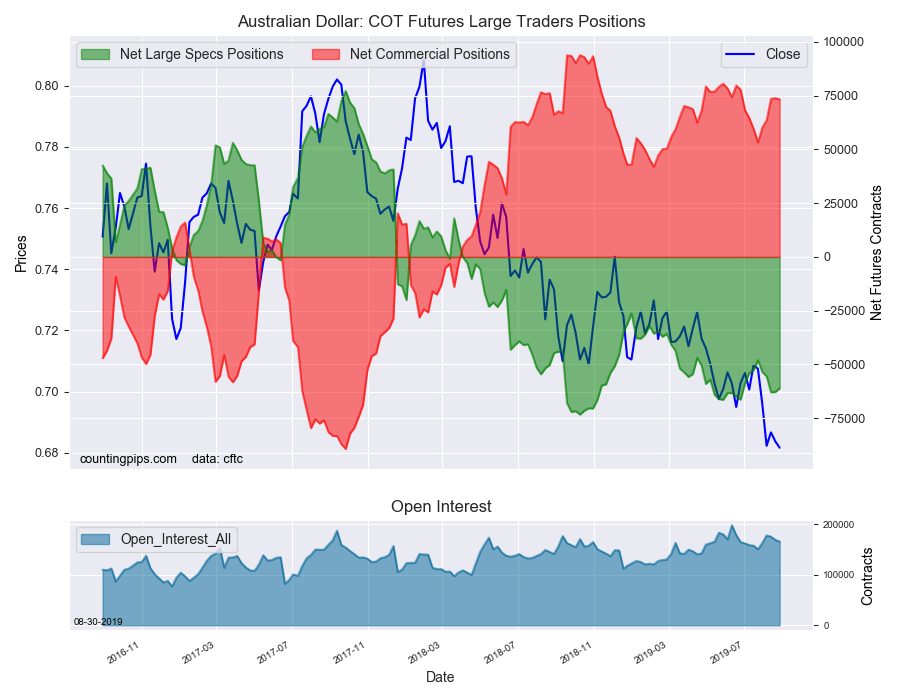
Australian Dollar:
The large speculator positions in Australian dollar futures resulted in a net position of -61,032 contracts this week in the data ending Tuesday. This was a weekly rise of 1,749 contracts from the previous week which had a total of -62,781 net contracts.
New Zealand Dollar:
The New Zealand dollar speculative standing reached a net position of -26,047 contracts this week in the latest COT data. This was a weekly reduction of -7,787 contracts from the previous week which had a total of -18,260 net contracts.
Mexican Peso:
Mexican peso speculators reached a net position of 93,314 contracts this week. This was a weekly lowering of -17,045 contracts from the previous week which had a total of 110,359 net contracts.
*COT Report: The COT data, released weekly to the public each Friday, is updated through the most recent Tuesday (data is 3 days old) and shows a quick view of how large speculators or non-commercials (for-profit traders) were positioned in the futures markets.
The CFTC categorizes trader positions according to commercial hedgers (traders who use futures contracts for hedging as part of the business), non-commercials (large traders who speculate to realize trading profits) and nonreportable traders (usually small traders/speculators).