By Hussein Sayed, Chief Market Strategist (Gulf & MENA), ForexTime
US stocks rally despite impeachment inquiry
Dollar nears multi-year highs
Oil falls as Saudi output recovers faster than expected
Investors were caught by surprise when the Speaker of the US House of Representatives Nancy Pelosi announced on Tuesday that she would initiate a formal impeachment inquiry against President Trump. The news led to a mild selloff in US equities with the S&P 500 ending the trading session 0.84% lower. It only took one statement from President Trump on Wednesday indicating that a US-China trade deal may happen soon, to put the bulls back in control. The market’s reaction to Trump’s statement tells us that trade remains the biggest factor influencing asset prices, and while we can’t completely rule out the impact of the impeachment proceedings, this is less of a factor currently driving markets.
After the White House released the transcript of the call with Ukraine’s President, markets became convinced that the Senate would just ignore it, unless there is additional evidence that he broke the law. At this point in time, the chances of impeachment are very slim.
The political mess may now encourage President Trump to accept an imperfect deal with China. After all, he needs to prove that he’s the master of deal-making, and now is the right time to raise his approval rating higher. If there’s further evidence that the fundamental outlook for the trade war is improving, we’re likely to see another leg higher in US equities.
Many traders were also surprised by the magnitude of the Dollar’s rally yesterday. The Dollar Index (DXY) is now only 0.5% away from its two and a half year high. While there’s no single reason to explain the Dollar’s strength, multiple factors are in play. The UK is facing a political crisis with Brexit, the Eurozone is near a recession, bond yields across the developed economies remain very depressed, and investors want a safe place to park their money. Despite the impeachment drama, the USD continues to cement its place as the major safe haven currency. However, if the Greenback continues to march higher from here, expect Trump to push the Treasury Department to intervene in the currency.
In commodity markets, Oil has now erased most of the gains in the immediate aftermath of the biggest ever attack on Saudi Oil facilities on September 14. After reports showed Aramco has restored its Oil production capacity to 11.3 million barrels a day, supply risk premium has faded and focus has returned to the demand-side of the equation. However, I remain concerned on how the US-Iranian tensions play out in the next couple of weeks which means geopolitical risk premium may return to prices quickly.
Disclaimer: The content in this article comprises personal opinions and should not be construed as containing personal and/or other investment advice and/or an offer of and/or solicitation for any transactions in financial instruments and/or a guarantee and/or prediction of future performance. ForexTime (FXTM), its affiliates, agents, directors, officers or employees do not guarantee the accuracy, validity, timeliness or completeness, of any information or data made available and assume no liability as to any loss arising from any investment based on the same.
Ovid Therapeutics’ shares are trading 25% higher today after the company reported positive initial data from its ENDYMION soticlestat phase 2 trial for patients with developmental and epileptic encephalopathies.
Shares of Ovid Therapeutics Inc. (OVID:NASDAQ) are trading more than 25% higher after the company yesterday announced positive initial data from its ENDYMION study. The ENDYMION trial is a Phase 2 open-label extension study of soticlestat (OV935/TAK935) in patients with rare developmental and epileptic encephalopathies (DEE). DEE is a heterogeneous group of rare highly-refractory epilepsy syndromes and encompasses Dravet syndrome, Lennox-Gastaut syndrome (LGS) and others. The firm claims that soticlestat is a potent, highly selective, first-in-class inhibitor of the enzyme cholesterol 24-hydroxylase (CH24H), which is being investigated as a novel approach to treating adults and children with rare epilepsies in collaboration with Takeda Pharmaceutical Co. Ltd. (4502:JP).
The firm advises that the initial data from the ENDYMION open-label extension trial is from patients who previously completed Ovid’s 12-week Phase 1b/2a clinical trial of soticlestat in adults with DEE. The study findings revealed that “at 12 weeks, safety and tolerability observations with soticlestat in the ENDYMION study were consistent with the completed Phase 1b/2a clinical trial. Longer-term data from ENDYMION out to 48 weeks suggest increased seizure reduction with prolonged treatment of soticlestat in this difficult-to-treat, adult patient population with various types of DEE.”
Amit Rakhit, MD, MBA, chief medical officer and head of research and development at Ovid, commented, “While this first data cut includes a small number of patients, these initial results from ENDYMION reaffirm the potential of soticlestat to provide a tangible and durable clinical benefit for patients with DEE, a group of difficult-to-treat seizure disorders with limited therapeutic options…Specifically, we believe the sustained and progressively improving median seizure reduction up to 90% seen in these patients is encouraging and, while early, compares favorably to other studies in different types of DEE. We look forward to additional progress in our broad DEE clinical development program including initial data from the ARCADE study expected in Q1/20 and topline results from the randomized ELEKTRA study now expected in H2/20 as a result of robust enrollment.”
Ovid explains that ENDYMION’s primary objective is to assess the long-term safety and tolerability of soticlestat over two years of treatment in patients with rare epilepsies and, secondarily, to evaluate the effect of soticlestat on seizure frequency over time. The firm noted that in terms of overall seizure free interval during treatment, one patient experienced 264 consecutive days and one patient experienced 150 consecutive days without a seizure. Ovid also pointed out that overall, safety findings are consistent with prior observations in the 12-week Phase 1b/2a adult DEE study and that soticlestat continues to show a favorable safety and tolerability profile.
The company states that that soticlestat (OV935/TAK-935) is a potent, highly selective, first-in-class inhibitor of the enzyme cholesterol 24-hydroxylase (CH24H), with the potential to reduce seizure susceptibility and improve seizure control. To Ovid’s knowledge, soticlestat is the only molecule with this mechanism of action in clinical development as an anti-epileptic drug. The U.S. Food and Drug Administration (FDA) has granted orphan drug designation to soticlestat for the treatment of both Dravet syndrome and Lennox-Gastaut syndrome (LGS).
Ovid and Takeda entered into a global development and commercialization collaboration in January 2017 to evaluate soticlestat across a range of rare epilepsy syndromes. In addition to the ENDYMION study, Ovid and Takeda are also conducting the Phase 2 ARCADE and ELEKTRA trials in pediatric DEE patient populations. The company identifies the ARCADE study as a Phase 2, multi-center, open-label, pilot study that will evaluate the treatment of soticlestat in patients with refractory epileptic seizures associated with CDKL5 Deficiency Disorder (CDD) or Dup15q syndrome. It further advises that the ELEKTRA study is an international Phase 2, multi-center, randomized, double-blind, placebo-controlled study that will evaluate the treatment of soticlestat in pediatric patients with epileptic seizures associated with Dravet syndrome or Lennox-Gastaut syndrome (LGS).
Ovid Therapeutics is headquartered in New York City and describes itself as a biopharmaceutical company using its BoldMedicine approach to develop medicines that transform the lives of patients with rare neurological disorders. The firm states that it has a broad pipeline of potential first-in-class medicines. The company advises that its most advanced investigational medicine OV101 (gaboxadol) is currently in clinical development for the treatment of Angelman syndrome and Fragile X syndrome.
Ovid Therapeutics began today with a market cap of approximately $96.5 million. The firm’s shares opened today at $2.60 (+$0.13, +5.26%) over the prior day’s $2.47 closing price. The stock has traded today between $2.60 and $3.48/share and presently is trading at $3.14 (+$0.67, +27.13%).
Disclosure: 1) Stephen Hytha compiled this article for Streetwise Reports LLC and provides services to Streetwise Reports as an independent contractor. He or members of his household own securities of the following companies mentioned in the article: None. He or members of his household are paid by the following companies mentioned in this article: None. 2) The following companies mentioned in this article are billboard sponsors of Streetwise Reports: None. Click here for important disclosures about sponsor fees. 3) Comments and opinions expressed are those of the specific experts and not of Streetwise Reports or its officers. The information provided above is for informational purposes only and is not a recommendation to buy or sell any security. 4) The article does not constitute investment advice. Each reader is encouraged to consult with his or her individual financial professional and any action a reader takes as a result of information presented here is his or her own responsibility. By opening this page, each reader accepts and agrees to Streetwise Reports’ terms of use and full legal disclaimer. This article is not a solicitation for investment. Streetwise Reports does not render general or specific investment advice and the information on Streetwise Reports should not be considered a recommendation to buy or sell any security. Streetwise Reports does not endorse or recommend the business, products, services or securities of any company mentioned on Streetwise Reports. 5) From time to time, Streetwise Reports LLC and its directors, officers, employees or members of their families, as well as persons interviewed for articles and interviews on the site, may have a long or short position in securities mentioned. Directors, officers, employees or members of their immediate families are prohibited from making purchases and/or sales of those securities in the open market or otherwise from the time of the interview or the decision to write an article until three business days after the publication of the interview or article. The foregoing prohibition does not apply to articles that in substance only restate previously published company releases. 6) This article does not constitute medical advice. Officers, employees and contributors to Streetwise Reports are not licensed medical professionals. Readers should always contact their healthcare professionals for medical advice.
Precious metals expert Michael Ballanger dissects the recent Federal Reserve injection of liquidity into the market and contemplates what could be behind it.
Ill winds mark its fearsome flight, And autumn branches creak with fright. The landscape turns to ashen crumbs, When something wicked this way comes… (Ray Bradbury)
There is a certain maneuver in military strategy that involves the act of conveying a warning to an opposing captain by way of firing a missile or (in ancient times) a cannon ball across the bow of his ship. It was akin to the throwing down of the gauntlet or slapping a man across his cheek with one’s glove and represents a signal that one is prepared to do battle. Your response will be “coming to” and hoisting a white flag if you are not willing to engage.
Last week, the Good Ship “MMT” (Modern Monetary Theory) had two such events with the first being the revelation that the U.S. Justice Department was invoking the RICO statute to indict our old nemesis, JP Morgan, alleging that it conspired to manipulate the gold market and in doing so, named senior managers as masterminds of the scheme. What was the shocker was NOT the indictment itself but rather the fact that they brought in RICO. RICO (RICO Act) stands for “Racketeer Influenced and Corrupt Organization Act” and “focuses specifically on racketeering and allows the leaders of a syndicate to be tried for the crimes they ordered others to do or assisted them in doing, closing a perceived loophole that allowed a person who instructed someone else to, for example, murder, to be exempt from the trial because they did not actually commit the crime personally.” It allows prosecution of large criminal organizations such as the Cosa Nostra or Mafia and for it to be brought to bear upon a major legendary American bank is nothing short of astounding and a seriously large and menacing projectile whizzing across the bow of financial market complacency.
The second cannon ball to soar across the bow of investor confidence was of even greater significance. Tuesday morning, the first day of the FOMC meetings, the Federal Reserve undertook a $53 billion “repo” operation, which was effectively a Herculean hypodermic injection of liquidity into the banking system, and before all those “WTF?” bubbles go sailing around the blogosphere, operations of this magnitude are only done as “emergency measures” such as market crashes or the seizing up of the interbank lending facility such as was happening in 2008. I was on a train when my news feed lit up and my first and near-automatic response was “Someone is in trouble.”
Now, there have been no official reports of anyone “in trouble” but the response of traders to this news was predictably and frustratingly robotic but why shouldn’t it be? There are no humans left to trade anymore. The algobots that implement pattern recognition software were searching out “Fed rate cute” and “Trade war moderates” as their cue to buy stocks and having found nothing ominous in neither a major banking leviathan charged under the RICO Act nor a $53 billion repo (the first since the 2008 subprime meltdown), went on their merry way of buying any and all dips because “the Fed has their back.” The days of my unbridled self-flagellation and distemperate outbursts, the nature of which subsided dramatically after gold broke out above $1,375, have crept back into the room and are threatening to dishevel me, a condition not appreciated nor tolerated by those around me. Emotional chaos is nigh, and it is not good.
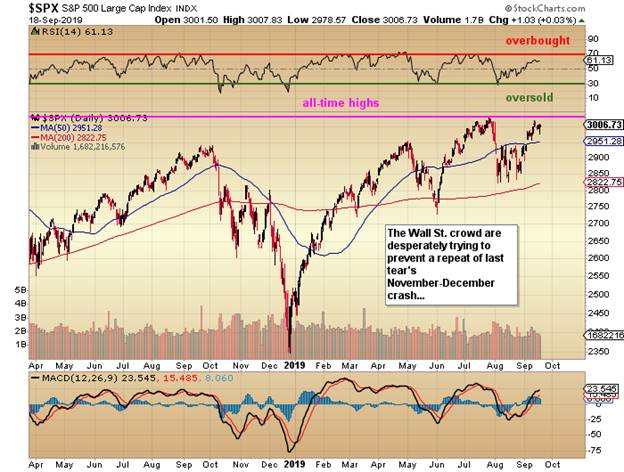
At the risk of sounding like an alarmist, I am so concerned with the liquidity scramble that is being undertaken by the banks that I fear that there lurks a large ticking time bomb ready at any minute to derail the current stock market rally, which is within a chip shot of all-time highs for the S&P. It really isn’t all that surprising that stocks are being bid higher; there isn’t really an alternative for the young money manager trying to preserve wealth. The usually wrong majority have been avoiding bonds like the plague despite the 30-year Treasury up nearly 10% year-to-date, while the traders continue to trade the big names despite softening macro conditions. Collapsing German PMIs, weakening forward guidance, Fedex warningsthese are all symptomatic of “The Wall of Worry,” a phrase that was relevant back in the pre-PPI (or at least limited PPI) days, when humans made investment decisions.
Today, there is no “Wall of Worry” that bull markets climb but there IS a “Cliff of Confidence” that is the Fed. Markets are scaling the “Cliff” because no matter how bad the outlook, there is ALWAYS a bid. Even last December when things looked irreversibly bad, the “Invisible Hand” of Smilin’ Stevie Mnuchin came to the rescue and investing since then, as they say, has gone “swimmingly.” Despite all just opined, I remain alarmed and on the “dedicated defensive.”
There are a few of us around that recall the words of Ben Bernanke in the early stages of the banking crisis of 2008 when he described the subprime contagion as “contained.” For this reason, when I see Jay Powell saying that the REPO liquidity injections are not to be misconstrued as a “policy tool,” I am reminded of that famous joke, “How can you tell if a central banker is lying?” Answer: “His lips are moving.” The Fed does NOT inject vast sums of cash into the banking system if everything is going “swimmingly well”; it does so usually during times of stress when one or more member banks are in trouble due to a default or a trading mishap. We have heard absolutely nothing this week as to exactly WHY the overnight lending rate spiked to 10% but you can be that someone did not want to give up any “liquidity” unless they got a big fee for doing someaningsomeone or someTHING needed liquidity real bad.
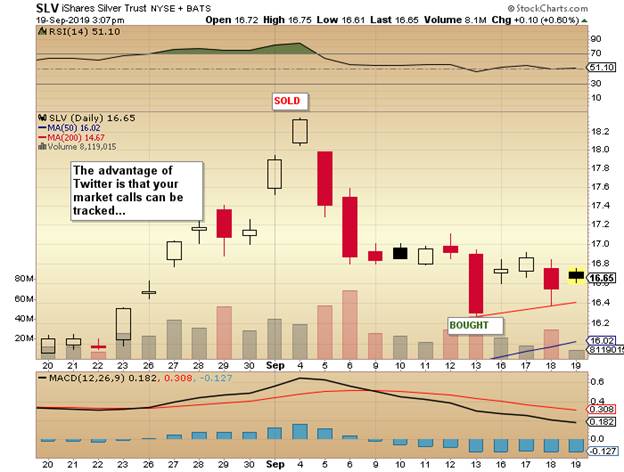
Silver continues to recover, albeit with fits and starts, off the lows I identified via my Twitter posts on September 13th. I quite like Twitter not so much for being able to see what the Kardashians had for lunch but more so for being a tracking tool for market calls, both good and bad. Stockcharts.com is a terrific tracking tool as well as the “Saved Charts” feature time stamps all saved charts so my “buy” and “sell” signals are locked into posterity for all to either admire or ridicule.
Just when I thought I had achieved “legend” status for buying the JNUG (Direxion Daily Junior Gold Miners Index Bull 3X) at the May lows around (split-adjusted) $30 and selling it in June at $45, I wanted to take a ball-and-chain hammer to my forehead in July after pulling the trigger roughly $60 too early, watching in abject horror as NUGT (Direxion Daily Gold Miners Index Bull 3X) and the GLD (SPDR Gold Trust) August call options spit in the eye of the Commercial traders and screamed northward. That is why hubris is the most dangerous of all trader foibles and a great lesson for all to heed.
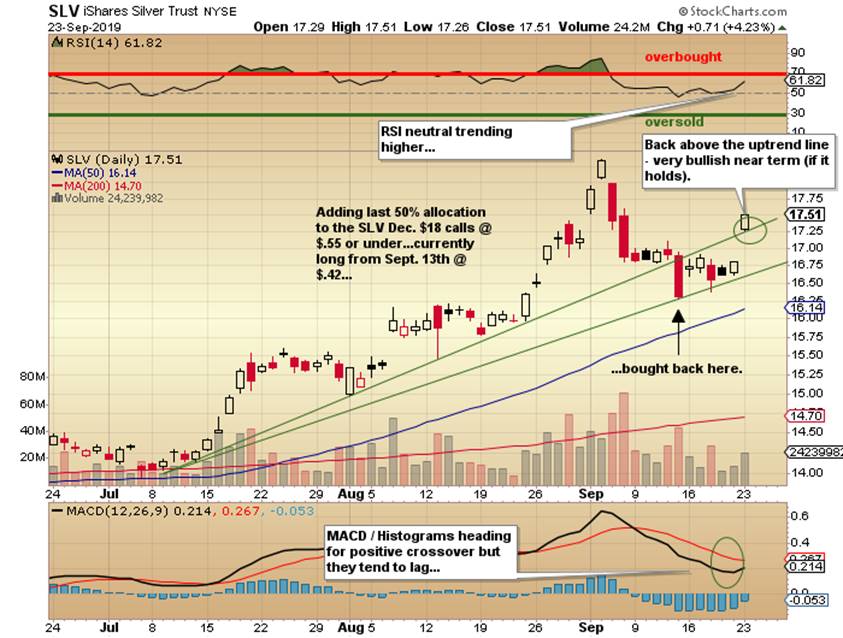
Luckily (as opposed to brilliantly), I quickly drew the conclusion that the landscape had, at least for the short term, changed and just as the gold gurus were advising their sheeple to “AVOID SILVER GSR going to 100!,” I deduced that the long-dated (and very successful) practice of fading all rallies in silver was going to get summarily rejected just as the long-dated (and very successful) practice of selling gold at RSI 75-plus had been rejected with the moon rocket move into the low $1,400s. In July with SLV (iShares Silver Trust) at $14.30, I mentioned in my missive that at the gold-silver ratio of 93, “Shorting the GSR here could be the Trade of the Year” and I did the next morning at 92.40 while buying a record long position in the SLV August $14 calls at $0.68 (June 25 Silver Tweet), which were rolled into the October $15.50 calls at a double, so I took all of my risk off the table but kept the same position with which I started. (Silver Switch) On September 4th, I sold that position along with the remaining 50% positions in the senior and junior miner ETFs (GDX[VanEck Vectors Gold Miners ETF]/GDXJ [VanEck Vectors Junior Gold Miners ETF])(Sell GDX/GDXJ), and then proceeded to sweat it out in abject terror while praying every half day that I would not lose the positions to an all-out vertical spike in the miners. Luckily for me, heavily medicated with Fido hiding once again under the tool shed, I pulled the trigger and reversed with a half-position in the SLV December $18 calls on September 13th (@ $0.42) and followed up with two 50% purchases of both GDX and GDXJ on September 17th and 18th but, alas, I went into this past weekend long ½ positions in the silver calls and ½ position in the GDX/GDXJ dynamic duo. (BUY GDX/GDXJ).
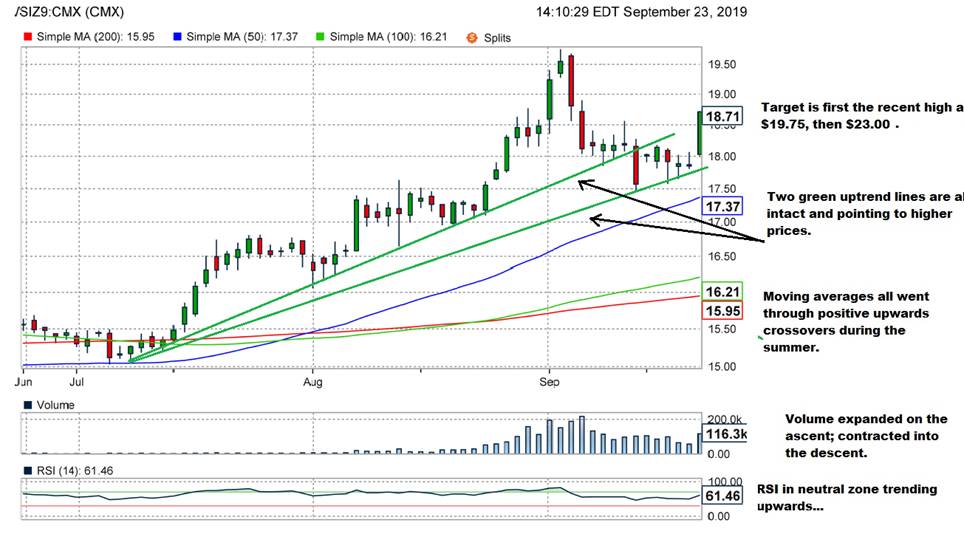
So now that I unabashedly patted myself on the back (choosing to carefully ignore premature stab at the TVIX and SPY puts), you all want to know, I am sure, where we are headed from here and no better way than to look at the chart of December silver posted above. I see a test of the highs of September 4th in the cards for the following reasons:
RSI is in neutral trending higher
Volume into the correction from $19.75 to my re-entry low at $17.50 was light as opposed to the massive volume on JulyAugust spike.
Moving averages all executed positive crossovers during the summer
Monday’s move through uptrend line (down through which it corrected) is powerfully bullish, and,
MSM pundits are all still in denial of silver’s dominance
As for the SLV, you can see that it has now, as of Monday’s close, scrambled back above the uptrend line drawn off the JulyAugust lows and is sporting a neutral 61.82 RSI while the MACD/Histograms are only now starting to converge in advance of a positive crossover. The 52-week high for SLV is $18.35 so with even the slightest of month-end hedging in advance of the ignominious month of October, it should be able to mount a respectable assault on $18$18.35. Hence, if you are a speculator, you can continue to add to the SLV Dec. $18 calls but only on down days. If you did not see my tweet on Sept. 4th (@Miningjunkie) calling the bottom in silver and initiating the buyback of the Dec. $18s, then scale in with a ¼ or ½ position and after you are onside with the initial purchase, average UP to increase the size of the trade. NEVER average down on a futures or option trade. You will wind up with shattered quote monitors and empty liquor bottles adorning your desk and your pockets will be hanging ruefully from your pants while your wife goes looking for a lawyer.
Lastly, there are many professional investors that profess to have systems-based rules that govern their trading practices and while I have great respect for many that follow a discipline, you cannot substitute academic achievement for experience. I have a pretty decent-looking CV (including the Wharton School) but you can take all the courses and all of the degrees and stick them into the Vault of Failed Dreams for all they can do in a meltdown. In the last few trading sessions, I have become increasingly “edgy” and it has nothing to do with October on the horizon or charts or trade wars or ZIRP. It is an “ad hoc” interpretation of impending doom, a “feeling”, a “sense,” that the recent Fed REPO OPS that were vacuumed away from the headlines by those that CAN were merely early warning signals of a yet-to-be-determined “event risk” out there. I am still holding in excess of 35% cash in the GGMA Portfolio and that is significant given how confident I was in early September that the precious metals correction had run its course. Had I committed all cash reserves to the miner ETFs as I am normally prone to do, I would have added another 45% to the performance going into month-end.
I am exercising extreme prudence because if there is an event shock, liquidity is going to be the main issue. Because these REPO OPS are being conducted to shore up bank liquidity with the S&P within a few points of the highs, imagine how sparse the bids will be in a market crash like last October?
Originally trained during the inflationary 1970s, Michael Ballanger is a graduate of Saint Louis University where he earned a Bachelor of Science in finance and a Bachelor of Art in marketing before completing post-graduate work at the Wharton School of Finance. With more than 30 years of experience as a junior mining and exploration specialist, as well as a solid background in corporate finance, Ballanger’s adherence to the concept of “Hard Assets” allows him to focus the practice on selecting opportunities in the global resource sector with emphasis on the precious metals exploration and development sector. Ballanger takes great pleasure in visiting mineral properties around the globe in the never-ending hunt for early-stage opportunities.
Disclosure: 1) Statements and opinions expressed are the opinions of Michael Ballanger and not of Streetwise Reports or its officers. Michael Ballanger is wholly responsible for the validity of the statements. Streetwise Reports was not involved in any aspect of the article preparation. Michael Ballanger was not paid by Streetwise Reports LLC for this article. Streetwise Reports was not paid by the author to publish or syndicate this article. 2) This article does not constitute investment advice. Each reader is encouraged to consult with his or her individual financial professional and any action a reader takes as a result of information presented here is his or her own responsibility. By opening this page, each reader accepts and agrees to Streetwise Reports’ terms of use and full legal disclaimer. This article is not a solicitation for investment. Streetwise Reports does not render general or specific investment advice and the information on Streetwise Reports should not be considered a recommendation to buy or sell any security. Streetwise Reports does not endorse or recommend the business, products, services or securities of any company mentioned on Streetwise Reports. 3) From time to time, Streetwise Reports LLC and its directors, officers, employees or members of their families, as well as persons interviewed for articles and interviews on the site, may have a long or short position in securities mentioned. Directors, officers, employees or members of their immediate families are prohibited from making purchases and/or sales of those securities in the open market or otherwise from the time of the interview or the decision to write an article until three business days after the publication of the interview or article. The foregoing prohibition does not apply to articles that in substance only restate previously published company releases.
Charts provided by the author.
Michael Ballanger Disclaimer: This letter makes no guarantee or warranty on the accuracy or completeness of the data provided. Nothing contained herein is intended or shall be deemed to be investment advice, implied or otherwise. This letter represents my views and replicates trades that I am making but nothing more than that. Always consult your registered advisor to assist you with your investments. I accept no liability for any loss arising from the use of the data contained on this letter. Options and junior mining stocks contain a high level of risk that may result in the loss of part or all invested capital and therefore are suitable for experienced and professional investors and traders only. One should be familiar with the risks involved in junior mining and options trading and we recommend consulting a financial adviser if you feel you do not understand the risks involved.
Figuring the acquisition into its model on Aytu, Ladenburg raised its target price on the specialty pharma to $4.75 per share from $4. Aytu’s current share price is about $1.42.
Innovus is a specialty pharmaceutical firm that commercializes, licenses and develops consumer health products, Cohen explained. From its existing portfolio, which encompasses 30 products in the diabetes, men’s health, sexual wellness and respiratory health markets, it generated $24 million of revenue during the past four quarters.
Also, the company has a robust sales and marketing platform it developed called Beyond Human, which includes print, online, direct mail, magazines and data buy and which reaches nearly 30 million prospective consumers monthly.
Cohen highlighted the benefits to Aytu of the acquisition. For one, it would give Aytu the chance to penetrate the “large, $40 billion consumer healthcare market,” he wrote.
Second, Innovus’ Beyond Human platform would lead to future growth and additional value for Aytu, noted Cohen. This in part would occur through cross-selling opportunities. For instance, Aytu could market its prescription products to consumers who show an interest in a related product like Innovus’ Beyond Human Testosterone Booster or its alternative men’s health products.
Per the terms of the acquisition agreement, all outstanding Innovus common stock will be retired when the deal closes, Cohen relayed. Also, subsequently, Aytu will pay Innovus about $16 million in contingent value rights (CVRs) in either cash or stock when certain predetermined milestones are met during the next five years. Should the value of the CVRs exceed the current stock price at each of those milestones, Aytu will pay the difference in cash.
Disclosure: 1) Doresa Banning compiled this article for Streetwise Reports LLC and provides services to Streetwise Reports as an independent contractor. She or members of her household own securities of the following companies mentioned in the article: None. She or members of her household are paid by the following companies mentioned in this article: None. 2) The following companies mentioned in this article are billboard sponsors of Streetwise Reports: None. Click here for important disclosures about sponsor fees. 3) Comments and opinions expressed are those of the specific experts and not of Streetwise Reports or its officers. The information provided above is for informational purposes only and is not a recommendation to buy or sell any security. 4) The article does not constitute investment advice. Each reader is encouraged to consult with his or her individual financial professional and any action a reader takes as a result of information presented here is his or her own responsibility. By opening this page, each reader accepts and agrees to Streetwise Reports’ terms of use and full legal disclaimer. This article is not a solicitation for investment. Streetwise Reports does not render general or specific investment advice and the information on Streetwise Reports should not be considered a recommendation to buy or sell any security. Streetwise Reports does not endorse or recommend the business, products, services or securities of any company mentioned on Streetwise Reports. 5) From time to time, Streetwise Reports LLC and its directors, officers, employees or members of their families, as well as persons interviewed for articles and interviews on the site, may have a long or short position in securities mentioned. Directors, officers, employees or members of their immediate families are prohibited from making purchases and/or sales of those securities in the open market or otherwise from the time of the interview or the decision to write an article until three business days after the publication of the interview or article. The foregoing prohibition does not apply to articles that in substance only restate previously published company releases.
Disclosures from Ladenburg Thalmann, Aytu BioScience Inc., September 18, 2019
ANALYST CERTIFICATION: I, Jeffrey S. Cohen, attest that the views expressed in this research report accurately reflect my personal views about the subject security and issuer. Furthermore, no part of my compensation was, is, or will be directly or indirectly related to the specific recommendation or views expressed in this research report, provided, however, that:
The research analyst primarily responsible for the preparation of this research report has or will receive compensation based upon various factors, including the volume of trading at the firm in the subject security, as well as the firms total revenues, a portion of which is generated by investment banking activities.
COMPANY SPECIFIC DISCLOSURES:
Ladenburg Thalmann & Co. Inc. makes a market in Aytu BioScience, Inc.. Ladenburg Thalmann & Co. Inc. has managed or co-managed a public offering for Aytu BioScience, Inc. within the past 12 months. Ladenburg Thalmann & Co. Inc received compensation for investment banking services from Aytu BioScience, Inc. within the past 12 months. Ladenburg Thalmann & Co. Inc had an investment banking relationship with Aytu BioScience, Inc. within the last 12 months.
Technical analyst Clive Maund charts this copper and gold stock that is exploring a project in British Columbia that he rates an “immediate buy.”
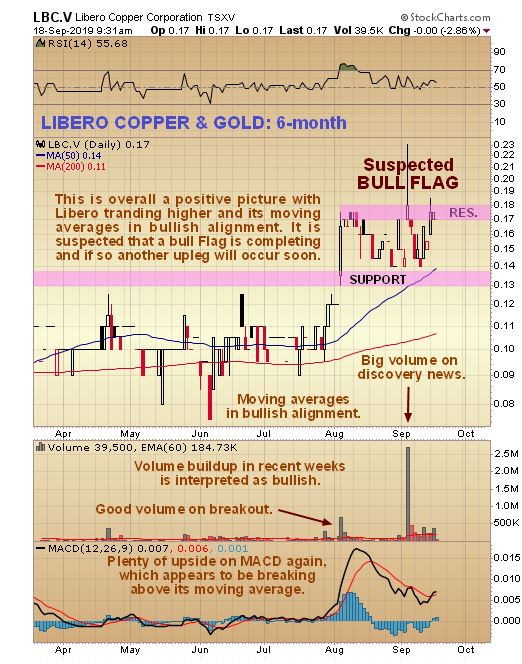
Libero Copper and Gold Corp. (LBC:TSX.V:, LBCMF:OTCQB) is looking attractive here. The fundamentals for the company are believed to be positive, and it announced a sizeable gold discovery early this month at Big Red, which caused the price to spike up briefly on huge volume, a move which on its 6-month chart appears to be a premature attempt to break out of what is suspected to be a bull Flag. The overall tenor of this chart is positive, with the price trending higher and moving averages in bullish alignment. The duration of the Flag thus far has allowed time for the earlier overbought condition resulting from the breakout to largely unwind as shown by the MACD indicator and a bullish development in recent days is that the MACD has broken clear above its moving average. It looks about ready to start another upleg, although we may first see a minor dip towards the support at the C$0.14 level.
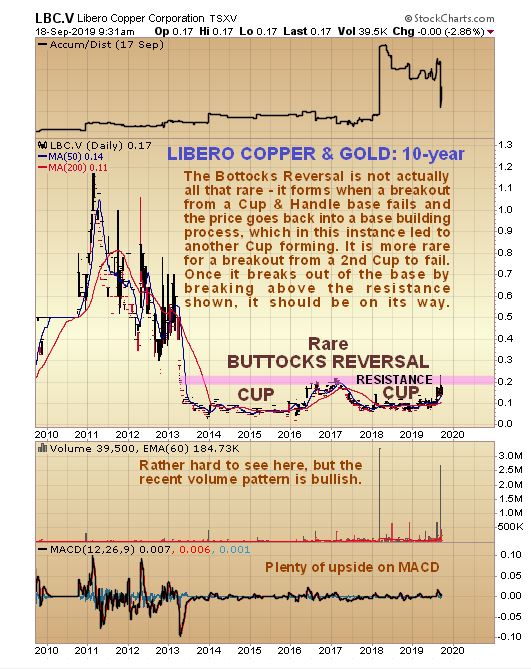
On the long-term 10-year chart we can see that this stock has a lot of potential from the current low price. It appears to be completing a rather rare “Buttocks Reversal” whose visual appeal is sadly reduced somewhat by the right one being narrower than the left one. Notwithstanding this imperfection, the volume pattern is suggesting that the price is about ready to break out upside, and a break above the resistance at the top of the pattern at approximately $0.20 C$0.24 should mark the start of a major new bull market in the stock, which will of course be against the background of the unfolding bull market in gold. The Buttocks Reversal is actually the result of a failed breakout from a Cup & Handle base, after which the price slumps back into the base pattern to do more work marking out another Cup & Handle base, and there is considerably less chance of the breakout from the 2nd Cup & Handle base failing than the 1st, giving further grounds for optimism.
Libero Copper & Gold therefore looks like an immediate buy here. Libero trades in reasonable volumes on the US OTC market, where limit orders should always be employed, and of its 56 million shares in issue, only about 15 million are in the float.
Libero Copper & Gold Corp, LBC.V, LBCMF on OTC, trading at C$0.165, $0.135 at 11.00 am EDT on 18th September 2019.
Originally posted at on Clive Maund.com at 12.15 pm EDT on 18th September 2019.
Clive Maund has been president of www.clivemaund.com, a successful resource sector website, since its inception in 2003. He has 30 years’ experience in technical analysis and has worked for banks, commodity brokers and stockbrokers in the City of London. He holds a Diploma in Technical Analysis from the UK Society of Technical Analysts.
Disclosure: 1) Clive Maund: I, or members of my immediate household or family, own shares of the following companies mentioned in this article: None. I personally am, or members of my immediate household or family are, paid by the following companies mentioned in this article: None. My company has a financial relationship with the following companies mentioned in this article: None. CliveMaund.com disclosures below. I determined which companies would be included in this article based on my research and understanding of the sector. 2) The following companies mentioned in this article are billboard sponsors of Streetwise Reports: None. Click here for important disclosures about sponsor fees. As of the date of this article, an affiliate of Streetwise Reports has a consulting relationship with Libero Copper and Gold Corp. Please click <href=”#consulting” target=”_blank”>here for more information. Within the last six months, an affiliate of Streetwise Reports has disseminated information about the private placement of the following companies mentioned in this article: Libero Copper and Gold Corp. 3) Statements and opinions expressed are the opinions of the author and not of Streetwise Reports or its officers. The author is wholly responsible for the validity of the statements. The author was not paid by Streetwise Reports for this article. Streetwise Reports was not paid by the author to publish or syndicate this article. The information provided above is for informational purposes only and is not a recommendation to buy or sell any security. Streetwise Reports requires contributing authors to disclose any shareholdings in, or economic relationships with, companies that they write about. Streetwise Reports relies upon the authors to accurately provide this information and Streetwise Reports has no means of verifying its accuracy. 4) This article does not constitute investment advice. Each reader is encouraged to consult with his or her individual financial professional and any action a reader takes as a result of information presented here is his or her own responsibility. By opening this page, each reader accepts and agrees to Streetwise Reports’ terms of use and full legal disclaimer. This article is not a solicitation for investment. Streetwise Reports does not render general or specific investment advice and the information on Streetwise Reports should not be considered a recommendation to buy or sell any security. Streetwise Reports does not endorse or recommend the business, products, services or securities of any company mentioned on Streetwise Reports. 5) From time to time, Streetwise Reports LLC and its directors, officers, employees or members of their families, as well as persons interviewed for articles and interviews on the site, may have a long or short position in securities mentioned. Directors, officers, employees or members of their immediate families are prohibited from making purchases and/or sales of those securities in the open market or otherwise from the time of the interview or the decision to write an article until three business days after the publication of the interview or article. The foregoing prohibition does not apply to articles that in substance only restate previously published company releases. As of the date of this article, officers and/or employees of Streetwise Reports (including members of their household) own securities of Libero Copper & Gold, a company mentioned in this article.
Charts provided by the author.
CliveMaund.com Disclosure: The above represents the opinion and analysis of Mr Maund, based on data available to him, at the time of writing. Mr. Maund’s opinions are his own, and are not a recommendation or an offer to buy or sell securities. Mr. Maund is an independent analyst who receives no compensation of any kind from any groups, individuals or corporations mentioned in his reports. As trading and investing in any financial markets may involve serious risk of loss, Mr. Maund recommends that you consult with a qualified investment advisor, one licensed by appropriate regulatory agencies in your legal jurisdiction and do your own due diligence and research when making any kind of a transaction with financial ramifications. Although a qualified and experienced stock market analyst, Clive Maund is not a Registered Securities Advisor. Therefore Mr. Maund’s opinions on the market and stocks can only be construed as a solicitation to buy and sell securities when they are subject to the prior approval and endorsement of a Registered Securities Advisor operating in accordance with the appropriate regulations in your area of jurisdiction.
Georgia’s central bank raised its benchmark refinancing rate for the second time this month at an extraordinary meeting of its monetary policy committee, living up to its guidance from Sept. 4 that it was ready to continue tightening its policy until the pressure on the exchange rate weakens.
The National Bank of Georgia (NBG) raised its rate by another 50 basis points to 7.50 percent and has now raised it by 100 points this month.
The two rate hikes partly reverse the two 25-basis-point rate cuts in January and March so the rate has been raised by a net 50 points this year. The last time NBG’s key rate was at this level was in April and May 2016.
“The NBG will continue to monitor the developments in the economy and financial markets and will use all means and instruments at its disposal to ensure the price stability,” the central bank said, noting it had started to tighten monetary policy at its previous meeting to neutralize inflationary pressures from the depreciation of the lari and policy tightening was expected to continue until the pressure on the exchange rate was eliminated. NBG added it had also referred to the possibility of an extraordinary session of its monetary policy committee if necessary. “Since the last committee meeting, the nominal effective exchange rate of the GEL has remained undervalued and inflationary expectations persist,” NBG said.
The lari has been falling since mid-February and was trading at 2.97 to the U.S. dollar today, down 9.8 percent since the start of this year, while inflation rose for the third consecutive month to 4.9 percent in August from 4.6 percent in July, boosted by higher taxes on cigarettes and higher import prices from the lower lari.
The central bank targets inflation of 3.0 percent.
Economic data reveal positive dynamics, the central bank said, adding the balance of trade in goods and services continued to improve in August, which in addition to the tighter monetary policy stance, should help strengthen the lari through the expectations channel and thus help lower the inflation rate.
Georgia’s gross domestic product grew an annual 4.5 percent in the second quarter of this year, down from 4.9 percent in the first quarter and the trade deficit narrowed to US$435.1 million in August from $440.3 in July and $497.4 million in August 2018.
The National Bank of Georgia issued the following statement:
“The Monetary Policy Committee (MPC) of the National Bank of Georgia (NBG) held an extraordinary meeting on September 25, 2019 and decided to raise the refinancing rate by 0.5 percentage points to 7.5 percent.
At the previous meeting of the Monetary Policy Committee, the National Bank of Georgia started tightening monetary policy aiming at neutralizing inflationary pressures stemming from the exchange rate depreciation. As stated in the committee’s decision from September 4, policy tightening was expected to continue until the pressure on the exchange rate was eliminated. Moreover, in the same decision the Committee also referred to the possibility of holding an extraordinary session if necessary.
Since the last committee meeting, the nominal effective exchange rate of the GEL has remained undervalued and inflationary expectations persist. Hence, at today’s extraordinary meeting, the Monetary Policy Committee decided to increase the refinancing rate by 0.5 percentage points. The NBG will continue to monitor the developments in the economy and financial markets and will use all means and instruments at its disposal to ensure the price stability.
The data from the external sector reveal the positive dynamics. Specifically, the balance of trade in goods and services continued to improve in August, which, in addition to the tighter monetary policy stance, promotes the strengthening of the exchange rate through expectations channel and, as a result, should provide the desired dynamics of inflation over the medium term.
The next meeting of the Monetary Policy Committee is scheduled on October 23, 2019.”
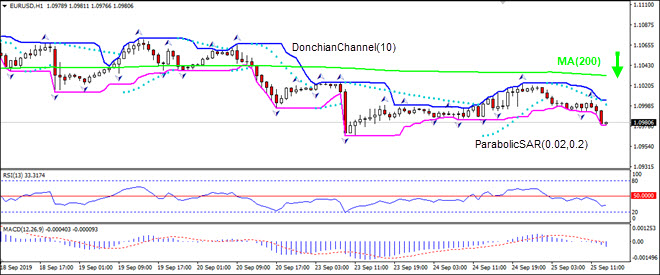
Deteriorating German business expectations bearish for EURUSD
Expectations component of Ifo business climate index in Germany fell to a decade low while the index rose marginally in September. Will the EURUSD continue falling?
On 1-hour timeframe EURUSD: H1 is in downtrend. The price has fallen below the 200-period moving average MA(200).
Breakouts are one of the most commonly occurring phenomena in technical analysis-based forex trading. They are a result of price consolidation or congestion.
The consolidation or congestion periods can occur at any time: before a trend, within a trend or after a trend.
Trading breakouts is quite a popular short-term FX trading strategy. Breakouts are particularly popular with intraday traders. This is because breakouts occur regardless of the timeframe of the security in question.
A quick move following the breakout can yield good profits depending on how leveraged a forex trader is. While breakouts offer a great way to maximize profits, they aren’t that easy to master.
This is because breakouts are volatile. There is no guarantee that price will maintain the momentum following a breakout.
There are many approaches to trading breakouts using technical analysis. But before we get into that, let’s briefly look at the concept of breakouts in forex trading.
What Are Breakouts & Why Do They Happen?
Breakouts happen when price moves outside the defined range. This range can be identified by support and resistance levels. But it is not just the horizontal breakouts. There are many chart patterns that work on the concept of a breakout.
For example, the ascending or descending triangle patterns, and the bullish and bearish flag/pennant patterns are all different versions of depicting a breakout.
Higher volume is another way to qualify a breakout, evident in the case of stocks.
Breakouts happen as a result of an increased investor or trading activity. Breakouts are usually triggered due to fundamental drivers.
For example, you can notice price maintaining a consolidation or a ranging phase. This range is breached upon the release of a high impact economic indicator, or speech.
Breakouts are explosive because forex traders react to news that is not discounted already. The breakout is merely a response to repricing in the asset. This leads to a strong and explosive move in price. A breakout is a result of forex investors and traders adjusting to the newly released piece of information.
But sometimes, you might also see breakouts for no reason. Such breakouts are a result of technical forex trading and trader positioning. When there is a concentration of orders at a certain price area, it can lead to a strong breakout as a result.
Common Ways to Trade Breakouts Using Technical Analysis
We can primarily split breakout forex trading methods using technical analysis into two categories.
Chart Patterns
The chart patterns mentioned earlier, alongside other patterns such as head and shoulders, etc. draw upon the concept of a breakout. The main thing to focus here, of course, is past price history.
When you identify that price has been consolidating or failing to move past a certain price level, it can lead to a breakout.
Indicators
Using oscillators such as the RSI, Stochastics and so on is another way. Most of these oscillators are based on momentum. Momentum is a great forex indicator that tells you how strong the breakout it. Typically, you will also see volatility rising during a breakout.
Forex traders usually draw upon one of the above or a combination of both to successfully trade breakouts. One should remember that there is no silver bullet that will consistently reward you with successful trades. Because of the irrationality of the forex markets, risk is also something that FX traders should consider.
Chart patterns based breakout trading examples
But there is something that you can consider to qualify your breakout trades better.
Momentum: Momentum is a great way to determine the longevity of a breakout. When momentum is high, there is a higher probability that price will continue moving in the direction of the breakout.
Volatility: Volatility is a measure of the degree of variation over time for the price of the security. Looking at historical volatility can give you a rough estimate on the breakout target.
Volume: A breakout can also be qualified based on the volume. Depending on the asset you are trading, volume can be a great indicator of whether the breakout can be sustainable.
Risk/Reward: Last but not the least; the risk/reward ratio is also a factor to consider. It is essential to have the right risk/reward set up. This will determine the level of success and consistency in having profitable trades.
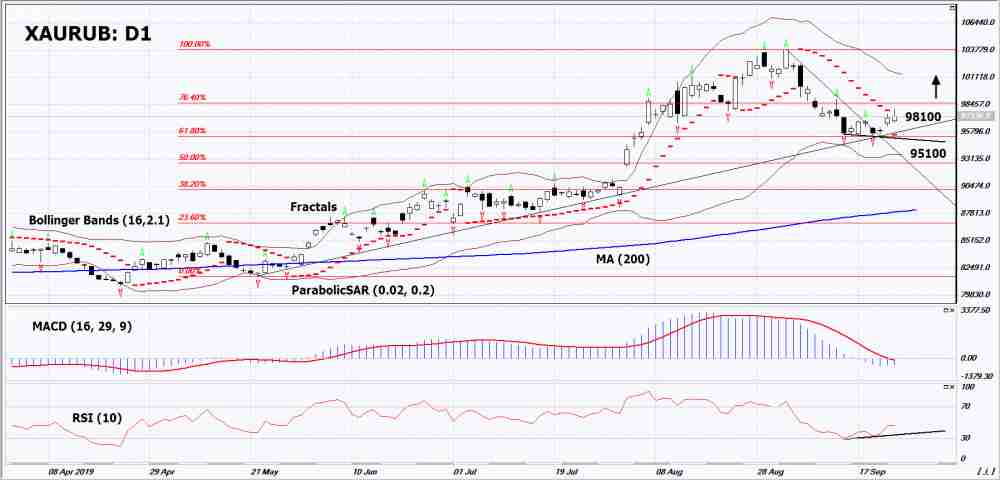
Further rate cuts could increase the attractiveness of precious metals
In this review, we suggest to take into consideration a personal composite instrument (PCI) & XAURUB. It reflects the dynamics of changes in the value of gold VS Russian ruble. Will the XAURUB quotations grow?
Such movement indicates gold price increase and Russian ruble decline. The main factors behind the rise in price of precious metals are the softening of the monetary policy of the world’s leading central banks against the backdrop of signs of a slowdown in global economic growth. So, the Fed rate reduction is expected at the next meeting on October 30, 2019. Meanwhile, now it is 2%, which is lower than current inflation in the US 2.4% in annual terms. In addition, the demand for gold is supported by global risks in the form of a trade war between China and the USA, the aggravation of the situation around Iran, as well as the problems of the budget crisis in Italy and the British exit from the EU. In turn, the weakening of the Russian ruble may occur after the end of the period for the payment of taxes or in the event of a decrease in world oil prices. In Russian exports, the share of hydrocarbons reaches 70%.
On the daily timeframe XAURUB: D1 could not break the support line of the uptrend as part of the correction. Now the upward movement may resume. Various technical analysis indicators have generated uptrend signals. Further growth of quotations is possible in the case of increasing global risks and a slowdown in the global economy.
The Parabolic indicator demonstrates a signal to increase.
The Bolinger bands narrowed, indicating a volatility decrease.
The RSI indicator is below the 50 mark. It has formed a divergence to increase.
The bullish momentum may develop if XAURUB exceeds its last maximum: 98100. This level can be used as an entry point. The initial stop lose may be placed below the last lower fractal, the 2nd Fibonacci level and the Parabolic signal: 95100. After opening a pending order, the stop shall be moved following the Bollinger and Parabolic signals to the next fractal minimum. Thus, we are changing the potential profit/loss to the breakeven point. More risk-averse traders may switch to the 4-hour chart after the trade and place a stop loss moving it in the direction of the trade. If the price meets the stop level (95100) without reaching the order (98100), we recommend to cancel the order: the market sustains internal changes that were not taken into account.
The world of forex trading is complex and confusing, with a huge amount of variables involved.
Thankfully, there are several forex trading tools that can make it just that little bit easier.
We’ve put together a list of 5 useful forex tools that will take your FX trading experience to the next level.
These tools will help you stay in control of your trades, generate new trade ideas and execute them efficiently, whilst also monitoring them closely.
1. Top Forex Research
Arguably the first task on your list should be to find yourself a preferred source of useful insights from real experts in the field.
Look for a reliable and certified source that provides helpful educational material, from “how-to” articles to full-blown forex trading strategies.
Surf the web until you find somewhere that gives you everything you need, from technical trading signals to the latest fundamental headlines and how they might impact the markets.
Make sure you are always researching and learning from reliable industry vets so that you are armed with the correct knowledge.
2. Forex Economic Calendar
FX traders tend to think they can make an easy buck in Forex during important news releases and economic report publications.
There are, of course, other (risk-averse) FX traders who stay away from the Forex markets during these times.
Whatever your risk appetite and trading style may be, keeping track of important economic events around the world is an essential part of forex trading.
An economic calendar (or ‘ecocal’) will help you gain powerful insights into the important economic indicators influencing the forex markets, currencies, or assets. And it’s an excellent way to ensure your fundamental FX trading strategy is as prepared as possible to deal with impending volatility.
3. Pivot Point Calculator
A Pivot Point Calculator calculates support and resistance levels by using the last session’s high, low and close.
FX traders use pivot point calculators to assess the market mood or general trend. You can also use them to determine potential breakouts, reversals and trend continuation points.
FX traders often find MT4 indicators that do the calculations automatically for them. The important thing is to get the points drawn on the chart. This will give you a visual representation of how effective pivot points can be. This will help you both build a new trading strategy, and improve your existing one.
4. Pip & Margin Calculators
A pip calculator can help you determine the dollar value for every pip-move. Using this online tool will help you estimate your position size and ensure you trade within your risk parameters.
This forex tool is very easy to use! All you do is select the currency pair you want to trade, punch in the volume in lots and enter the account type. The calculator will then give you the pip value in both your forex account base currency and converted currency.
A margin calculator works similarly, but its main purpose is to calculate the margin required to open an FX trade.
With this tool, you fill in the exact same information as with the pip calculator, then add your account leverage.
5. Position Size Calculator
FX traders usually consider risking a fixed percentage of their forex trading account.
For example, if you spot a good setup to buy EURUSD and you know what your take profit and stop loss levels are, you simply calculate what your lot size would be, provided you have decided what percentage of your balance you would like to risk.
If you spotted a good setup on 1.10 EURUSD, all you would have to do is enter your account balance, risk ratio, and stop-loss in pips. The tool will then calculate the corresponding position size in lots for you!