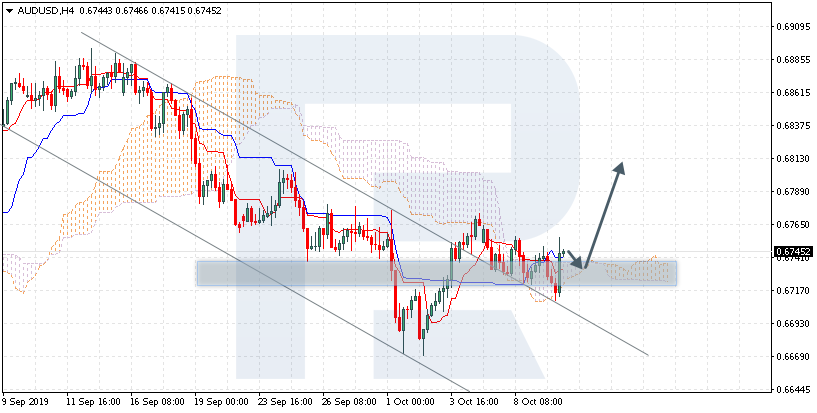
AUDUSD is trading at 0.6745; the instrument is moving above Ichimoku Cloud, thus indicating an ascending tendency. The markets could indicate that the price may test the cloud’s downside border at 0.6735 and then resume moving upwards to reach 0.6815. Another signal to confirm further ascending movement is the price’s rebounding from the support level. However, the scenario that implies further growth may be canceled if the price breaks the cloud’s downside border and fixes below 0.6700. In this case, the pair may continue falling towards 0.6605.
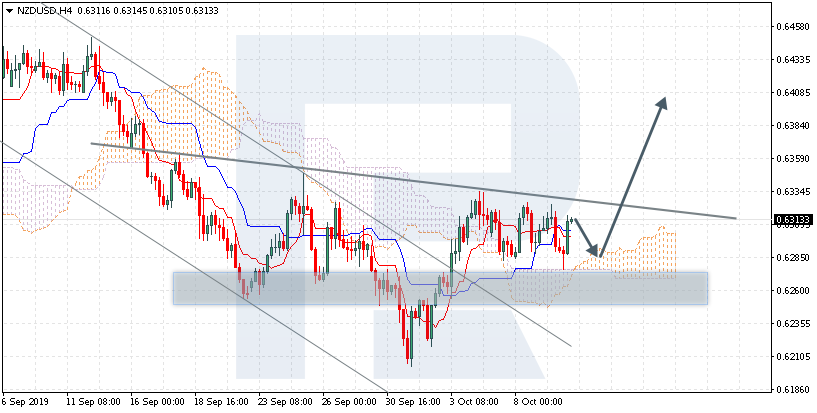
NZDUSD, “New Zealand Dollar vs US Dollar”
NZDUSD is trading at 0.6313; the instrument is moving above Ichimoku Cloud, thus indicating an ascending tendency. The markets could indicate that the price may test the cloud’s upside border at 0.6285 and then resume moving upwards to reach 0.6410. Another signal to confirm further ascending movement is the price’s rebounding from the support level and forming Head & Shoulders reversal pattern. However, the scenario that implies further growth may be canceled if the price breaks the cloud’s downside border and fixes below 0.6255. In this case, the pair may continue falling towards 0.6175. After breaking the neckline and fixing above 0.6345, the price may continue moving upwards.
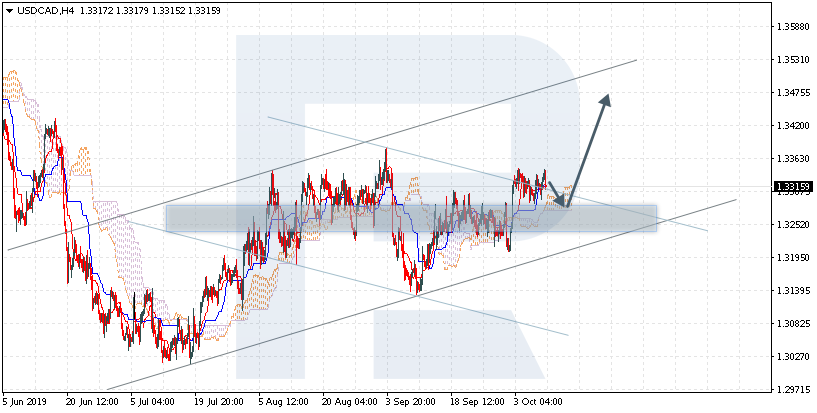
USDCAD, “US Dollar vs Canadian Dollar”
USDCAD is trading at 1.3315; the instrument is moving above Ichimoku Cloud, thus indicating an ascending tendency. The markets could indicate that the price may test the cloud’s downside border at 1.3295 and then resume moving upwards to reach 1.3475. Another signal to confirm further ascending movement is the price’s rebounding from the support level. However, the scenario that implies further growth may be canceled if the price breaks the cloud’s downside border and fixes below 1.3235. In this case, the pair may continue falling towards 1.3165.
Attention! Forecasts presented in this section only reflect the author’s private opinion and should not be considered as guidance for trading. RoboForex LP bears no responsibility for trading results based on trading recommendations described in these analytical reviews.
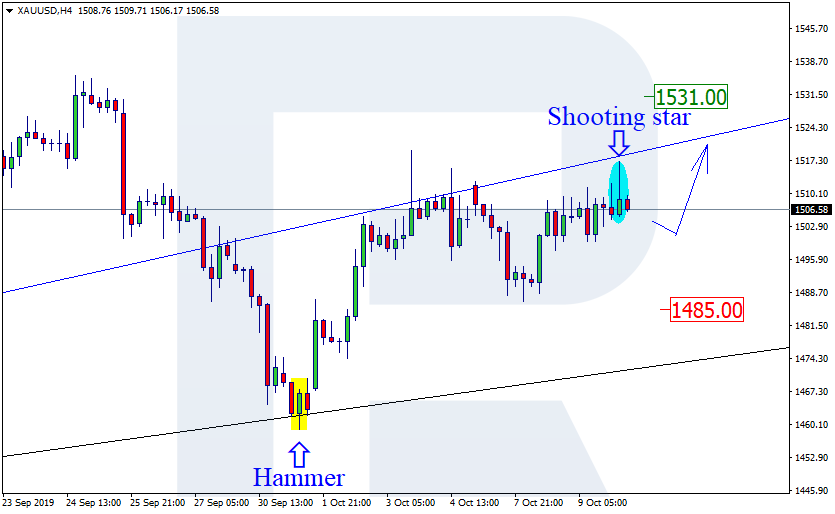
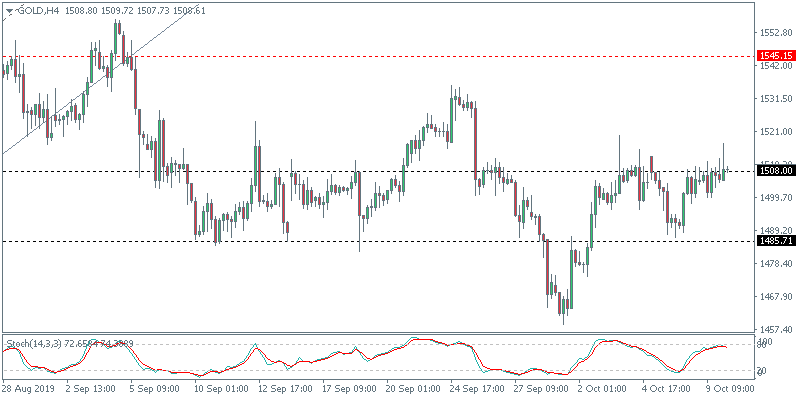
As we can see in the H4 chart, the ascending tendency continues. After forming Shooting Star reversal pattern close to the resistance level, XAUUSD is moving sideways and testing the rising channel’s downside border. If the pair continues growing, it may return to 1531.00 to continue forming the ascending tendency. At the same time, we shouldn’t exclude an opposite scenario, which implies that the instrument may resume falling to reach 1485.00.
NZDUSD, “New Zealand vs. US Dollar”
As we can see in the H4 chart, the descending tendency continues. After breaking the resistance level, NZDUSD has formed several reversal patterns, including Hanging Man. Right now, the pair is reversing and may start a slight correction, which may later be followed by a further decline towards 0.6210. At the same time, one shouldn’t exclude an opposite scenario, according to which the instrument may continue growing towards 0.6380.
Attention! Forecasts presented in this section only reflect the author’s private opinion and should not be considered as guidance for trading. RoboForex LP bears no responsibility for trading results based on trading recommendations described in these analytical reviews.
The US dollar is consolidating against a basket of major currencies. The dollar index (#DX) closed yesterday’s trading session with a slight decrease (-0.01%). Investors are still focused on negotiations between the US and China. It became known that countries can conclude an interim agreement. Also, the Executive Office of the US President, Donald Trump, plans to issue licenses that allow some US companies to cooperate with Huawei Technologies. It optimistically affected the sentiment of financial market participants. This step is regarded as the willingness of the United States to make concessions.
Financial market participants assess the FOMC meeting minutes. The Fed noted an increase in the recession probability amid uncertainty in trade policy and growing external risks. Fed Chairman, Jerome Powell, does not rule out another cut in interest rates this year. Weak economic data from the US was also published yesterday. So, JOLTS job openings decreased and counted to 7,051M instead of 7,191M. Today, we expect statistics on inflation in the US.
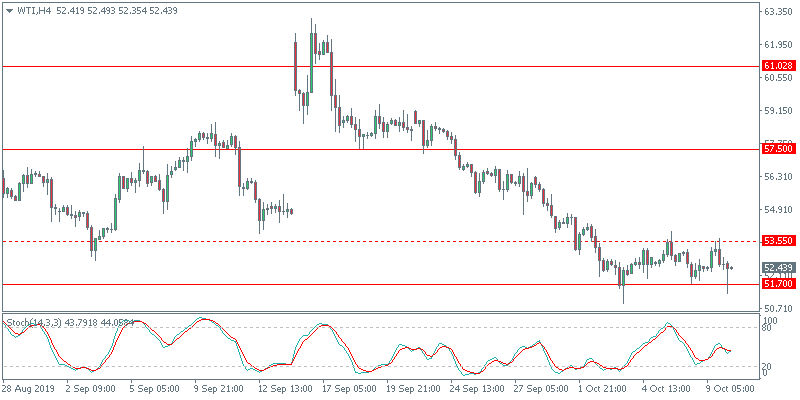
The “black gold” prices are falling due to pessimism about the global economy. Currently, WTI crude oil futures are testing the $52.55 mark per barrel.
Market Indicators
Yesterday, there was the bearish sentiment in the US stock markets: #SPY (-0.95%), #DIA (-0.71%), #QQQ (-0.98%).
The 10-year US government bonds yield has been growing. At the moment, the indicator is at the level of 1.58-1.59%.
The Economic News Feed for 10.10.2019:
– GDP data in the UK at 11:30 (GMT+3:00);
– The volume of industrial production in the UK at 11:30 (GMT+3:00);
The EUR/USD currency pair continues to trade in a protracted flat. Unidirectional trends are not observed. Financial market participants evaluate FOMC Minutes. The Fed noted an increase in the likelihood of a recession amid uncertainty in trade policy and growing external risks. Fed Chairman Jerome Powell does not rule out another cut in interest rates this year. At the moment, the local support and resistance levels are: 1.09700 and 1.10000, respectively. A trading instrument has a potential for growth. Today, investors will evaluate data on inflation in the United States. We recommend opening positions from key levels.
The Economic News Feed for 10.10.2019:
– Inflation report (US) – 15:30 (GMT + 3: 00);
– Initial Jobless Claims (US) – 15:00 (GMT+3:00);
Indicators do not give accurate signals: 50 MA crossed 100 MA.
The MACD histogram is located in the positive zone and above the signal line, which gives a strong signal to buy EUR/USD.
The Stochastic Oscillator is in the neutral zone, the% K line crossed the% D line. There are no signals at the moment.
Trading recommendations
Support levels: 1.09700, 1.09450, 1.09100
Resistance levels: 1.10000, 1.10250
If the price consolidates above the round level of 1.10000, expect further growth toward 1.10300-1.10500.
Alternatively, EUR/USD could decrease toward 1.09500-1.09300.
The GBP/USD currency pair
Technical indicators of the currency pair:
Prev Open: 1.22183
Open: 1.22094
% chg. over the last day: -0.06
Day’s range: 1.22025 – 1.22310
52 wk range: 1.1995 – 1.3385
The last session had rather active trading on the GBP/USD currency pair. At the same time, a unidirectional trend is not observed. The trading tool tests local support and resistance levels: 1.22000 and 1.22400, respectively. Sterling is still under pressure due to uncertainty over the Brexit issue. Today, participants in financial markets will evaluate important economic releases from the UK. Positions must be opened from key levels.
The Economic News Feed for 10.10.2019:
– GDP Report (UK) – 11:30 (GMT+3:00);
– Production volume in manufacturing industry (UK) – 11:30 (GMT+3:00);
Keep an eye on the statements by the Head of the Bank of England
Indicators do not give accurate signals, the price crossed 50 MA.
The MACD histogram is close to 0.
The Stochastic Oscillator is close to the overbought zone, the %K line crossed the %D line.
Trading recommendations
Support levels: 1.22000, 1.21500
Resistance levels: 1.22400, 1.22850, 1.23300
If the price consolidates below 1.22000, expect a further drop toward 1.21600-1.21400.
Alternatively, the quotes could grow toward 1.22700-1.22900.
The USD/CAD currency pair
Technical indicators of the currency pair:
Prev Open: 1.33216
Open: 1.33303
% chg. over the last day: +0.06
Day’s range: 1.33117 – 1.33456
52 wk range: 1.2727 – 1.3664
CAD is still in lateral movement. The technical picture is ambiguous. At the moment, the local support and resistance levels are 1.33100 and 1.33450, respectively. Participants in financial markets expect the release of important statistics on the US economy. We also recommend that you pay attention to the dynamics of prices for oil. USD/CAD quotes have the potential to decline. Positions must be opened from key levels.
The Economic News Feed for 10.10.2019 is calm.
Indicators do not give accurate signals, the price crossed 50 MA and 100 MA.
The MACD histogram is close to 0.
The Stochastic Oscillator is in the oversold zone, the %K line has crossed the %D line. There are no signals at the moment.
Trading recommendations
Support levels: 1.33100, 1.32900, 1.32700
Resistance levels: 1.33450, 1.33700
If the price consolidates below 1.33100, expect the quotes to fall toward 1.32800-1.32600.
Alternatively, the quotes could grow toward 1.33700-1.33900.
The USD/JPY currency pair
Technical indicators of the currency pair:
Prev Open: 107.070
Open: 107.457
% chg. over the last day: +0.14
Day’s range: 107.035 – 107.772
52 wk range: 104.97 – 114.56
The technical picture on the USD/JPY currency pair is still ambiguous. The trading instrument is in lateral movement. At the moment, the local support and resistance levels are: 107.250 and 107.700, respectively. Uncertainty in trade negotiations between the US and China, as well as the Brexit process, support demand for the safe haven currencies. USD/JPY quotes have the potential to decline. Today we recommend paying attention to economic reports from the USA. Positions must be opened from key levels.
The Economic News Feed for 10.10.2019 is calm.
The price fixed above 50 MA and 100 MA, which signals the strength of buyers.
The MACD histogram is in the positive zone, indicating bullish sentiment.
The Stochastic Oscillator is in the neutral zone, the %K line is below the %D line, which gives a signal to sell USD/JPY.
Trading recommendations
Support levels: 107.250, 106.900, 106.600
Resistance levels: 107.700, 107.900, 108.300
If the price consolidates below 107.250, expect the quotes to fall toward 106.900-106.600.
Alternatively, the quotes can grow toward 108.000-108.200.
Equity markets rose on Wednesday after reports emerged that China was open to a partial US trade deal. The comments come amid China asking the US to remove the 28 entities from the blacklist. It is likely that the markets will continue to monitor the developments. So far, there has been no official word and most of the gains were led by rumors. Both Bloomberg and the Financial Times reported the positive developments citing “unnamed sources”. The rebound comes after equities fell on Tuesday due to dimming prospects of a deal.
EU Offers to Make Concessions on Brexit Deal
A day after EU leaders shrugged off the Brexit proposal, reports showed that EU officials were ready to make concessions. The EU is looking at an option to offer a mechanism for Northern Ireland to leave the backstop after a number of years. The reports come as the deadline for the October 31st Brexit deal looms closer.
Sterling Stays Muted to Brexit Developments
GBPUSD remained rather flat. Price action was seen testing the lower end of the support at 1.2203. It later bounced back higher after testing this level but prices remain caught to the upside of 1.2291. As long as the support holds, the currency pair could remain flat. But the bias is building up to the downside. A breakdown below the support could signal a decline to 1.2082.
Crude Oil Inventories Continue to Build-Up
The weekly oil inventory report from the Energy Information Administration (EIA) saw another week of rising inventories. For the week ending October 4, commercial crude oil stockpiles rose 2.9 million barrels. This marks a fourth consecutive weekly increase in oil inventories. The EIA, earlier in the week, released a report where it lowered the crude oil price target to $57.00 by the second quarter of 2020. This was down from the previous estimate of $62.00 a barrel.
WTI Crude Oil Attempting to Rise Higher
Oil prices are seen posting a bottom near the 51.70 level. Price action managed to rise to the upside at 53.55. A breakout above this level will confirm the upside bias. The divergence on the four-hour chart remains which indicates the upside. In the near term, watch for price action to close above 53.55 to confirm further gains.
Gold Stays Subdued after Powell’s Speech
Gold prices were seen recovering from declines earlier in the week. Fed Chair Powell, in a speech said that the central bank would restart its balance sheet program once again. The Fed chair said that the central bank will start purchasing treasury bills. The move comes after the Fed initially started to unwind the balance sheet that it amassed during the QE era.
XAUUSD Retests Upper Range. Will it Breakout Higher?
Gold prices were seen rising back to the upper end of the range at 1508. The gains in price action come after gold prices initially slipped to the downside. However, gold needs to break out to the upside rather convincingly in order to confirm further upside. A close above the 1508 level will potentially see gold prices rising to the next upside target of 1532.
The Department of Commerce will be releasing the monthly inflation readings today for the month of September. Economists anticipate that consumer prices were sluggish during the month.
On a month over month basis, headline inflation in the United States is set to rise by 0.1%. This marks the same pace of increase as in August. The inflation data for the year will, therefore, remain unchanged at 1.7%.
The core inflation rate, which excludes the volatile food and energy prices, is forecast to rise by 0.2% – 0.3% on the month. This, again, marks the same pace of increase as in August.
On an annualized basis, core CPI will, therefore, remain steady at 2.4%.
US CPI, Y/Y, August 2019
Consumer prices in the United States peaked at 2.1% in 2017. But, since then, prices have been trending lower.
The Federal Reserve is targeting the 2.0% inflation target rate. It was only in April this year that headline inflation briefly rose to 2.0% but started to weaken thereafter.
At the recent FOMC meeting, the central bank released its economic projections. According to the FOMC’s staff economic projections, inflation, as measured by the personal consumption expenditure (PCE), is forecast to average around 1.5% this year. It was a downward revision from June, where officials saw PCE averaging at 1.8% for this year.
The estimates on the core PCE rate is, however, unchanged at 1.8% compared to the projections from June.
The overall sluggish growth in inflation has been a concern, not just in the United States but globally as well. The weak pace of inflation comes amid weaker oil prices and reduced global demand for trade. It is also not surprising that the weakness comes as the economic cycle moves into the late growth stage.
September Inflation Could Rise Higher
In August, consumer prices rose just 0.1%. This came on the back of a 0.3% increase in July. In August, the modest gains came as an increase in shelter and medical care outperformed the declines in the energy sector.
The weak inflation comes as the energy index was down 1.9% in August, while the gasoline index fell 3.5% on the month.
Energy remains the biggest laggard in the inflation index. In August, the all-items and food inflation both rose 1.7%. The energy sector was down 4.4% in total, bringing the core inflation rate to 2.4%.
During the month of September, gasoline prices fell. But the rate of decline was muted. Gasoline prices were down just 1.1% on a month over month basis in September. This could potentially see a modest uptick in the inflation data.
Therefore, there is a good chance that the inflation data could ticker higher than the estimates.
It should be mentioned though that the Fed looks at the PCE data as a measure of inflation. Therefore, the CPI reports due today will not yield much influence. But considering that both CPI and PCE are seen to track one another, an uptick in today’s report could bode well for PCE estimates.
Today’s inflation data could, therefore, see some kind of market reaction. However, a single month’s data isn’t going to shift the expectations from dovish to hawkish. The PCE reports are due later in October and this is when we will be able to see how underlying prices pressures performed during September.
By Hussein Sayed, Chief Market Strategist (Gulf & MENA), ForexTime
S&P 500 futures recover after 1.3% drop in early trade
Yuan climbs on reports of US-China currency pact
FOMC minutes show sharply divided Fed
Investors across the globe are closely monitoring the high-level US-China trade talks, which will kick off today as China’s Vice Premier Liu He sits on the table with US trade representative Robert Lighthizer and US Treasury Secretary Steven Mnuchin.
Several trade-related headlines have been released prior to the meeting and looking at the market’s reaction, there seems to be lot of confusion. Wall Street and European Indices climbed yesterday after reports showing Chinese officials offered to increase purchases of US agricultural products in the hope of reaching a partial deal.
Earlier this morning, S&P 500 futures spiked lower, falling 1.3% after the South China Morning Post reported that the two countries had made no progress on key trade issues during deputy level talks, and Vice-Premier Liu He may leave earlier than expected. However, futures pared most of the losses following a story from the New York Times that Washington will issue licenses allowing some US firms to supply non-sensitive goods to Huawei Technologies.
The Chinese Yuan climbed more than 0.3% this morning following Bloomberg’s report that Trump’s administration is looking at rolling out a previously agreed currency pact. Such an agreement may lead to further strength in CNY, but details of the pact are needed to better assess the magnitude of the move.
There’s obviously a lot of noise in the markets, and no one knows for certain how the latest round of negotiations will end. The lack of clarity will keep trading volumes low and volatility high, but it seems investors are remaining defensive for now. If talks break down and Trump’s administration raises tariffs next Tuesday, we are likely to see another steep selloff in risk assets.
Federal Reserve needs to better align with market expectations
The minutes of the FOMC released yesterday showed sharp division among its members about the future path of US monetary policy. Some policymakers are worried that markets are heavily betting on further easing following the two rate cuts in July and September. That’s obvious when you look at Fed funds futures rates compared to the Fed’s own dot plot.
Aligning with market expectations first requires consensus among policymakers, but Fed members are becoming increasingly divided.
The minutes didn’t have a significant impact on markets yesterday. Investors still anticipate an 85% chance of a rate cut by the end of the month according to CME’s Fedwatch Tool. This probability may change depending on the outcome of trade talks and upcoming data, with today’s consumer prices and Friday’s Consumer Sentiment in focus.
Disclaimer: The content in this article comprises personal opinions and should not be construed as containing personal and/or other investment advice and/or an offer of and/or solicitation for any transactions in financial instruments and/or a guarantee and/or prediction of future performance. ForexTime (FXTM), its affiliates, agents, directors, officers or employees do not guarantee the accuracy, validity, timeliness or completeness, of any information or data made available and assume no liability as to any loss arising from any investment based on the same.
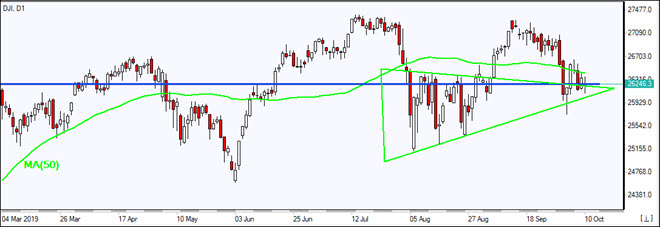
US stocks ended two-day skid on Wednesday as President Trump said there’s ‘really good chance’ of China trade deal. The S&P 500 gained 0.9% to 2919.40. The Dow Jones industrial average advanced 0.7% to 26346.01. Nasdaq rose 1% to 7903.74. The dollar strengthening halted after September meeting Fed minutes showed several Fed officials argued that the chances of a US recession “had increased notably in recent months.” The live dollar index data show the ICE US Dollar index, a measure of the dollar’s strength against a basket of six rival currencies, slipped less than 0.1% to 99.11 and is lower currently. Stock index futures point to lower openings today.
DAX leads European indexes movements
European stocks resumed advances on Wednesday after reports China was willing to discuss a deal providing no more tariffs are imposed including duties scheduled this month and in December. GBP/USD continued sliding yesterday while EUR/USD turned higher with no change in dynamics for both pairs currently. The Stoxx Europe 600 added 0.4% led by auto shares. Germany’s DAX 30 rose 1% to 12094.26. France’s CAC 40 advanced 0.8% and UK’s FTSE 100 gained 0.3% to 7166.50.
Shanghai Composite leads Asian indexes gains
Asian stock indices are rising today after reports Trump administration was considering putting off tariff hikes scheduled to go into effect next week and may soon issue licenses to some US companies to do business again with China’s Huawei Technologies. Nikkei rose 0.5% to 21551.98 despite yen resumed climb against the dollar. Chinese stocks are advancing: the Shanghai Composite Index is up 0.8% and Hong Kong’s Hang Seng Index is 0.1% higher. Australia’s All Ordinaries Index losses extended gains 0.01% despite Australian dollar resumed climb against the greenback.
Brent futures prices are lower today. Prices gained yesterday despite Energy Information Administration report US crude inventories rose a fourth week in a row by 2.9 million barrels, while gasoline inventories fell by 1.2 million barrels. December Brent crude added 0.1% to $58.32 a barrel on Wednesday.
Note: This overview has an informative and tutorial character and is published for free. All the data, included in the overview, are received from public sources, recognized as more or less reliable. Moreover, there is no guarantee that the indicated information is full and precise. Overviews are not updated. The whole information in each overview, including opinion, indicators, charts and anything else, is provided only for familiarization purposes and is not financial advice or а recommendation. The whole text and its any part, as well as the charts cannot be considered as an offer to make a deal with any asset. IFC Markets and its employees under any circumstances are not liable for any action taken by someone else during or after reading the overview.
The key reasons this story is compelling are given in an H.C. Wainwright & Co. report.
In an Oct. 3 research note, analyst Andrew Fein reported that H.C. Wainwright & Co. initiated coverage on Blueprint Medicines Corp. (BPMC:NASDAQ) with a Buy rating and a $100 per share price target. In comparison, its current share price is around $72.26.
One major reason for the assumption of coverage is that Blueprint, Fein noted, is on “the verge of transforming into a full-fledged commercial company.” U.S. Food and Drug Administration (FDA) approval of the company’s avapritinib in fourthline and PDGFRA-E18m gastrointestinal stromal tumors (GIST) is likely in Q1/20.
Also during that quarter, the biopharmaceutical entity plans to submit to the FDA new drug applications for avapritinib for treatment of advanced systemic mastocytosis and pralsetinib (BLU-667) for secondline RET fusion nonsmall cell lung cancer.
The analyst pointed out that H.C. Wainwright and key opinion leaders view the market opportunities for both avapritinib and pralsetinib to be “underappreciated.” He added, “As key opinion leaders believe genetic testing in earlier lines of GIST should be the main driver for commercial uptake, we applaud Blueprint’s solid strides in promoting genetic testing and physician education as part of an integrated commercial strategy.”
Also attractive about Blueprint, it “is building a kinase medicine franchise upon a robust pipeline and platform,” which “deserve more attention from the Street,” indicated Fein. As such, the company should be able to “command a larger premium in a mergers and acquisitions scenario.”
Blueprint has more than 10,000 prescreened molecules from over 100 scaffolds. These molecules provide a broad scope of human kinome coverage and can be high-quality launching pads for compound optimization.
Fein pointed out that Blueprint is advancing additional clinical programs, such as fisogatinib (BLU-554) for advanced hepatocellular carcinoma and BLU-782 for fibrodysplasia ossificans progressive. The biopharma’s earlier stage assets also should “offer optionality and business development opportunities in the near to midterm.”
Disclosure: 1) Doresa Banning compiled this article for Streetwise Reports LLC and provides services to Streetwise Reports as an independent contractor. She or members of her household own securities of the following companies mentioned in the article: None. She or members of her household are paid by the following companies mentioned in this article: None. 2) The following companies mentioned in this article are billboard sponsors of Streetwise Reports: None. Click here for important disclosures about sponsor fees. 3) Comments and opinions expressed are those of the specific experts and not of Streetwise Reports or its officers. The information provided above is for informational purposes only and is not a recommendation to buy or sell any security. 4) The article does not constitute investment advice. Each reader is encouraged to consult with his or her individual financial professional and any action a reader takes as a result of information presented here is his or her own responsibility. By opening this page, each reader accepts and agrees to Streetwise Reports’ terms of use and full legal disclaimer. This article is not a solicitation for investment. Streetwise Reports does not render general or specific investment advice and the information on Streetwise Reports should not be considered a recommendation to buy or sell any security. Streetwise Reports does not endorse or recommend the business, products, services or securities of any company mentioned on Streetwise Reports. 5) From time to time, Streetwise Reports LLC and its directors, officers, employees or members of their families, as well as persons interviewed for articles and interviews on the site, may have a long or short position in securities mentioned. Directors, officers, employees or members of their immediate families are prohibited from making purchases and/or sales of those securities in the open market or otherwise from the time of the interview or the decision to write an article until three business days after the publication of the interview or article. The foregoing prohibition does not apply to articles that in substance only restate previously published company releases.
Disclosures from H.C. Wainwright & Co., Blueprint Medicines Corp., Initiating Coverage, October 3, 2019
Investment Banking Services include, but are not limited to, acting as a manager/co-manager in the underwriting or placement of securities, acting as financial advisor, and/or providing corporate finance or capital markets-related services to a company or one of its affiliates or subsidiaries within the past 12 months.
I, Andrew S. Fein, Alicia Yin, Ph.D., Li Wang Watsek, and Matthew Caufield, certify that 1) all of the views expressed in this report accurately reflect my personal views about any and all subject securities or issuers discussed; and 2) no part of my compensation was, is, or will be directly or indirectly related to the specific recommendation or views expressed in this research report; and 3) neither myself nor any members of my household is an officer, director or advisory board member of these companies.
None of the research analysts or the research analyst’s household has a financial interest in the securities of Blueprint Medicines Corporation, Deciphera Pharmaceuticals, Inc. and Turning Point Therapeutics, Inc. (including, without limitation, any option, right, warrant, future, long or short position).
As of September 30, 2019 neither the Firm nor its affiliates beneficially own 1% or more of any class of common equity securities of Blueprint Medicines Corporation, Deciphera Pharmaceuticals, Inc. and Turning Point Therapeutics, Inc.
Neither the research analyst nor the Firm has any material conflict of interest in of which the research analyst knows or has reason to know at the time of publication of this research report.
The research analyst principally responsible for preparation of the report does not receive compensation that is based upon any specific investment banking services or transaction but is compensated based on factors including total revenue and profitability of the Firm, a substantial portion of which is derived from investment banking services.
The Firm or its affiliates did not receive compensation from Blueprint Medicines Corporation, Deciphera Pharmaceuticals, Inc. and Turning Point Therapeutics, Inc. for investment banking services within twelve months before, but will seek compensation from the companies mentioned in this report for investment banking services within three months following publication of the research report.
The Firm does not make a market in Blueprint Medicines Corporation, Deciphera Pharmaceuticals, Inc. and Turning Point Therapeutics, Inc. as of the date of this research report.
H.C. Wainwright & Co., LLC and its affiliates, officers, directors, and employees, excluding its analysts, will from time to time have long or short positions in, act as principal in, and buy or sell, the securities or derivatives (including options and warrants) thereof of covered companies referred to in this research report.
Conclusions from a recent site visit are delivered in a CIBC report.
In an Oct. 4 research note, analyst Anita Soni reported that CIBC raised its valuation of Yamana Gold Inc.’s (YRI:TSX; AUY:NYSE; YAU:LSE) Jacobina mine in Brazil to $968 million from $925 million following a visit to the site.
“The mine showed well, with phase 1 optimization on track to be completed ahead of the scheduled mid-2020 commissioning and on budget of $5.3 million,” Soni commented. With the changes already made, the mill achieved 6,400 tpd (6.4 Ktpd) in Q3/19. The goal is 6.5 Ktpd. That rate would increase production to 180,000 ounces (180 Koz) by 2022, noted Soni.
Yamana is considering a phase 2 expansion to 7.58.5 Ktpd, which CIBC incorporated into its model on the company. This throughput rate would boost production to 200225 Koz in 2022-2023. Capex for phase 2 is now an estimated $75 million, down from about $150 million. The company is targeting Q1/20 for releasing the phase 2 prefeasibility study.
“We believe the company may be able to achieve the 200225 Koz level at 7.5 Ktpd with higher throughput grade of 2.52.6 grams per ton (2.52.6 g/t), currently at about 2.4 g/t,” Soni highlighted.
During the visit, management emphasized the exploration potential and long-term expansion opportunities at Jacobina, Soni reported. The current reserve estimate is 2.28 million ounces at 2.4 g/t, and all deposits there remain open along strike and downdip. Recent drill intercepts from the Canavieiras and Morro do Vento areas were positive, “including encouraging high-grade results near to mine infrastructure.”
She added, “Ultimately, the company is targeting raising the overall reserve grade of the deposit from the current 2.4 g/t at 13 years of mine life to over 2.6 g/t with a 20-year reserve life.”
CIBC has an Outperformer rating and a CA$4.40 per share price target on Yamana, whose stock is currently trading at around CA$3.46 per share.
Disclosure: 1) Doresa Banning compiled this article for Streetwise Reports LLC and provides services to Streetwise Reports as an independent contractor. She or members of her household own securities of the following companies mentioned in the article: None. She or members of her household are paid by the following companies mentioned in this article: None. 2) The following companies mentioned in this article are billboard sponsors of Streetwise Reports: None. Click here for important disclosures about sponsor fees. 3) Comments and opinions expressed are those of the specific experts and not of Streetwise Reports or its officers. The information provided above is for informational purposes only and is not a recommendation to buy or sell any security. 4) The article does not constitute investment advice. Each reader is encouraged to consult with his or her individual financial professional and any action a reader takes as a result of information presented here is his or her own responsibility. By opening this page, each reader accepts and agrees to Streetwise Reports’ terms of use and full legal disclaimer. This article is not a solicitation for investment. Streetwise Reports does not render general or specific investment advice and the information on Streetwise Reports should not be considered a recommendation to buy or sell any security. Streetwise Reports does not endorse or recommend the business, products, services or securities of any company mentioned on Streetwise Reports. 5) From time to time, Streetwise Reports LLC and its directors, officers, employees or members of their families, as well as persons interviewed for articles and interviews on the site, may have a long or short position in securities mentioned. Directors, officers, employees or members of their immediate families are prohibited from making purchases and/or sales of those securities in the open market or otherwise from the time of the interview or the decision to write an article until three business days after the publication of the interview or article. The foregoing prohibition does not apply to articles that in substance only restate previously published company releases.
Disclosures from CIBC, Yamana Gold Inc., October 4, 2019
Analyst Certification: Each CIBC World Markets Corp./Inc. research analyst named on the front page of this research report, or at the beginning of any subsection hereof, hereby certifies that (i) the recommendations and opinions expressed herein accurately reflect such research analyst’s personal views about the company and securities that are the subject of this report and all other companies and securities mentioned in this report that are covered by such research analyst and (ii) no part of the research analyst’s compensation was, is, or will be, directly or indirectly, related to the specific recommendations or views expressed by such research analyst in this report.
Analysts employed outside the U.S. are not registered as research analysts with FINRA. These analysts may not be associated persons of CIBC World Markets Corp. and therefore may not be subject to FINRA Rule 2241 restrictions on communications with a subject company, public appearances and trading securities held by a research analyst account.
Potential Conflicts of Interest: Equity research analysts employed by CIBC World Markets Corp./Inc. are compensated from revenues generated by various CIBC World Markets Corp./Inc. businesses, including the CIBC World Markets Investment Banking Department. Research analysts do not receive compensation based upon revenues from specific investment banking transactions. CIBC World Markets Corp./Inc. generally prohibits any research analyst and any member of his or her household from executing trades in the securities of a company that such research analyst covers. Additionally, CIBC World Markets Corp./Inc. generally prohibits any research analyst from serving as an officer, director or advisory board member of a company that such analyst covers.
In addition to 1% ownership positions in covered companies that are required to be specifically disclosed in this report, CIBC World Markets Corp./Inc. may have a long position of less than 1% or a short position or deal as principal in the securities discussed herein, related securities or in options, futures or other derivative instruments based thereon.
Recipients of this report are advised that any or all of the foregoing arrangements, as well as more specific disclosures set forth below, may at times give rise to potential conflicts of interest.
Important Disclosure Footnotes for Yamana Gold Inc. (AUY)
CIBC World Markets Inc. expects to receive or intends to seek compensation for investment banking services from Yamana Gold Inc. in the next 3 months.