The British Pound tumbled against every single G10 currency on Tuesday, following reports that UK Prime Minister Boris Johnson was adopting a hard line on Britain’s transition period for exiting the European Union.
Source: Bloomberg Finance L.P.
Renewed fears over the United Kingdom leaving the European Union by the end of 2020 with no deal has haunted investor attraction towards the Pound. The GBPUSD is tumbling over 150 pips and is expected to depreciate further in the near term on growing fears of a hard Brexit.
In regards to the technical picture, the GBPUSD is trading around 1.3150 as of writing. A breakdown below this level should open a path towards 1.3000 and 1.2900, respectively.
Disclaimer: The content in this article comprises personal opinions and should not be construed as containing personal and/or other investment advice and/or an offer of and/or solicitation for any transactions in financial instruments and/or a guarantee and/or prediction of future performance. ForexTime (FXTM), its affiliates, agents, directors, officers or employees do not guarantee the accuracy, validity, timeliness or completeness, of any information or data made available and assume no liability as to any loss arising from any investment based on the same.
Dollar weakening resumes on manufacturing PMI decline
US stocks record run continued on Monday as phase one trade deal optimism supported investors‘ risk appetite. The S&P 500 advanced 0.7% to third consecutive record at 3191.45. Dow Jones industrial added 0.4% to 28235.89. The Nasdaq rallied 0.9% to fresh record 8814.23. The dollar weakening resumed after Markit’s manufacturing PMI ticked down to 52.5 in December from 52.6, but the services sector gauge came in at 52.2 from 51.6. The live dollar index data show the ICE US Dollar index, a measure of the dollar’s strength against a basket of six rival currencies, slipped 0.1% to 97.12 and is lower currently. Futures on US stock indices point to higher openings today.
FTSE 100 led European indexes gains as Conservative won elections
European stock markets advance continued on Monday. The EUR/USD reversed its decline yesterday while GBP/USD continued its slide with no change in both pairs dynamics currently. The Stoxx Europe 600 index rose 1.5% to new record led by basic resources stocks. The DAX 30 gained 0.9% to 13407.66 despite a report euro-zone manufacturing PMI came in at below expected 45.9 after 46.9 in November. France’s CAC 40 rose 1.2% while UK’s FTSE 100 rallied 2.3% to 7519.05 despite report UK composite PMI hit the lowest level in December since mid-2016.
Shanghai Composite Index leads Asian indexes gains
Asian stock indices joined global rally unleashed by US-China phase one deal news. Nikkei rose 0.5% to 24066.12 despite yen’s resumed climb against the dollar. Markets in China are advancing after data showed factory activity and retail sales in the world’s second-largest economy were better than expected in November: the Shanghai Composite Index is up 1.3% and Hong Kong’s Hang Seng Index is 1% higher. Australia’s All Ordinaries Index however slipped 0.1% as Australian dollar reversed its climb against the greenback.
Brent futures prices are edging lower today. Prices gained yesterday after trade deal optimism: February Brent crude closed 0.2% higher at $65.34 a barrel on Monday. Saudi Aramco ‘s IPO continues on the country’s Tadawul exchange. And the stock will soon be available to overseas buyers too through the iShares MSCI Saudi Arabia ETF KSA. It is the only single-country exchange-traded fund for Saudi stocks, managed by BlackRock. The ETF tracks a group of companies called the MSCI Saudi Arabia IMI 25/50 Index, measuring the performance of the large, mid and small-cap segments of the Saudi market. Saudi Aramco is expected to meet the minimum market cap requirement for early inclusion in the ETF by Tuesday, which would make it available for trading on Wednesday.
Note: This overview has an informative and tutorial character and is published for free. All the data, included in the overview, are received from public sources, recognized as more or less reliable. Moreover, there is no guarantee that the indicated information is full and precise. Overviews are not updated. The whole information in each overview, including opinion, indicators, charts and anything else, is provided only for familiarization purposes and is not financial advice or а recommendation. The whole text and its any part, as well as the charts cannot be considered as an offer to make a deal with any asset. IFC Markets and its employees under any circumstances are not liable for any action taken by someone else during or after reading the overview.
Federal Reserve Chairman Jerome Powell’s comments on inflation last Wednesday added fuel to the contra-dollar trade.
During a press conference following the Fed’s decision to leave interest rates unchanged, Powell said, “In order to move rates up, I would want to see inflation that’s persistent and that’s significant. A significant move up in inflation that’s also persistent…
“To move inflation expectations up from where they are, which appears to be a bit below 2%, will not happen overnight.”
In other words, the Fed won’t be satisfied until consumer prices rise much higher over time.
This “weak dollar” policy may come back to bite, though, as the Federal Reserve Note steadily loses credibility as world reserve currency.
Over the weekend, Treasury Secretary admitted as much.
“People don’t have to use the dollar, we have the right to put restrictions on people using the dollar. And over a long period of time, if we’re not careful, people will look at using other currencies,” Mnuchin said Saturday in a CNBC interview.
Despite insisting that “we are not weaponizing the U.S. dollar,” Mnuchin’s Treasury Department is leveraging the dollar’s privileged status in international trade to impose and enforce economic sanctions against U.S. adversaries. They include North Korea, Venezuela, Iran, and Russia.
But as CNBC noted, “Officials in China and Europe have been actively promoting their currencies as substitutes for the dollar when it comes to both reserves and transactions, particularly in the face of expanding U.S. sanctions and protectionist trade policies like tariffs.”
The central banks of China and Russia are also steadily replacing their sizeable Federal Reserve Note reserves with gold.
The Money Metals News Service provides market news and crisp commentary for investors following the precious metals markets.
Sarepta Therapeutics shares traded 35% higher after the firm reported that the FDA approved its second RNA exon-skipping treatment drug VYONDYS 53 injection for the treatment of Duchenne’s Muscular Dystrophy in patients amenable to skipping Exon 53.
Yesterday evening, developer and marketer of precision genetic medicines for rare diseases Sarepta Therapeutics Inc. (SRPT:NASDAQ), announced that the U.S. Food and Drug Administration (FDA) has approved its second RNA exon-skipping treatment drug VYONDYS 53 (golodirsen). The company explained that “VYONDYS 53 is an antisense oligonucleotide from Sarepta’s phosphorodiamidate morpholino oligomer (PMO) platform, indicated for the treatment of Duchenne muscular dystrophy (DMD) in patients with a confirmed mutation amenable to exon 53 skipping.”
The firm stated in the report that commercial distribution of VYONDYS 53 in the U.S. will commence immediately; however, the continued approval of VYONDYS 53 may be subject to confirmation of a clinical benefit in its post-marketing confirmatory trial. The ESSENCE trial to support VYONDYS 53’s accelerated approval is currently enrolling patients and expected to conclude by 2024.
Sarepta’s President and CEO Doug Ingram commented, “Today is monumental for Sarepta and, more importantly, for the DMD community…VYONDYS 53, our second approved exon-skipping RNA therapy for DMD, may treat up to 8% of the DMD community, representing those patients who have a confirmed exon 53 amenable mutation. Along with EXONDYS 51 (eteplirsen), we now offer treatment options for approximately 20% of those with DMD in the United States…In the span of four months, we commenced and completed the formal dispute resolution process culminating in the grant of our appeal, resubmitted our NDA and obtained an approval which is a great benefit to DMD patients awaiting treatment.”
Pat Furlong, founding president and CEO of Parent Project Muscular Dystrophy (PPMD), remarked, “With the approval of VYONDYS 53, up to another 8% of Duchenne families will have a therapy to treat this devastating disease…For 25 years, PPMD has been working with researchers, clinicians, industry, and the Duchenne community to find treatments for all people living with Duchenne. And while we need to ensure that these approved therapies are accessible for patients, today we celebrate this approval and thank Sarepta for their continued leadership in the fight to end Duchenne.”
In a separate release this morning, the company announced that it has entered into an agreement with funds managed by Pharmakon Advisors, LP that will provide Sarepta with up to $500 million of borrowing capacity in two tranches. The first $250 million tranche will be available shortly after closing in December 2019, and the remaining $250 million tranche available at Sarepta’s option by December 31, 2020. The funding of the second tranche is subject to certain unnamed conditions. The credit facility will mature in 48 months from the first tranche closing date and the interest rate for the funding is fixed at 8.5% annually, payable quarterly.
Sarepta Therapeutics, which is based in Cambridge, Mass., states that its mission is to profoundly improve and extend the lives of patients with rare genetic-based diseases. The company claims that “it is at the forefront of precision genetic medicine, having built an impressive and competitive position in Duchenne muscular dystrophy (DMD) and more recently in gene therapies for 6 Limb-girdle muscular dystrophy diseases (LGMD), Charcot-Marie-Tooth (CMT), MPS IIIA, Pompe and other CNS-related disorders, totaling over 20 therapies in various stages of development.”
Sarepta started today with a market capitalization of about $7.5 billion with approximately 74.54 million shares outstanding and a fairly large short position of around 19.7%. SRPT shares opened nearly 25% higher today at $125.00 (+$24.53, +24.42%) compared to yesterday’s $100.47 closing price. The stock has traded today between $125.50 and $138.79 per share and at present is trading at $137.02 (+$36.55, +36.38%).
Disclosure: 1) Stephen Hytha compiled this article for Streetwise Reports LLC and provides services to Streetwise Reports as an independent contractor. He or members of his household own securities of the following companies mentioned in the article: None. He or members of his household are paid by the following companies mentioned in this article: None. 2) The following companies mentioned in this article are billboard sponsors of Streetwise Reports: None. Click here for important disclosures about sponsor fees. 3) Comments and opinions expressed are those of the specific experts and not of Streetwise Reports or its officers. The information provided above is for informational purposes only and is not a recommendation to buy or sell any security. 4) The article does not constitute investment advice. Each reader is encouraged to consult with his or her individual financial professional and any action a reader takes as a result of information presented here is his or her own responsibility. By opening this page, each reader accepts and agrees to Streetwise Reports’ terms of use and full legal disclaimer. This article is not a solicitation for investment. Streetwise Reports does not render general or specific investment advice and the information on Streetwise Reports should not be considered a recommendation to buy or sell any security. Streetwise Reports does not endorse or recommend the business, products, services or securities of any company mentioned on Streetwise Reports. 5) From time to time, Streetwise Reports LLC and its directors, officers, employees or members of their families, as well as persons interviewed for articles and interviews on the site, may have a long or short position in securities mentioned. Directors, officers, employees or members of their immediate families are prohibited from making purchases and/or sales of those securities in the open market or otherwise from the time of the interview or the decision to write an article until three business days after the publication of the interview or article. The foregoing prohibition does not apply to articles that in substance only restate previously published company releases. 6) This article does not constitute medical advice. Officers, employees and contributors to Streetwise Reports are not licensed medical professionals. Readers should always contact their healthcare professionals for medical advice.
Gold and silver prices remain mired in weeks-long trading ranges. They are essentially moving sideways – for now.
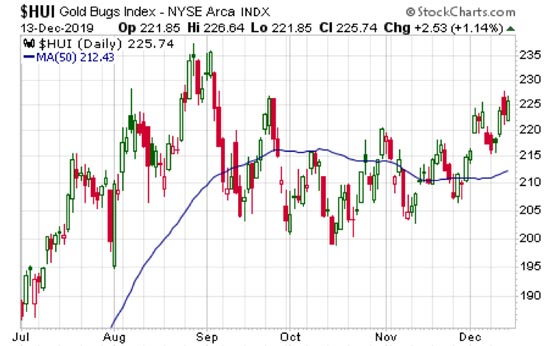
Precious metals mining stocks, however, are moving up. The chart of the HUI gold miners index shows an uptrend in place since mid October.
The HUI has traded above its 50-day moving average for several days in a row. The 50-day line itself is now also curling up, confirming underlying technical strength.
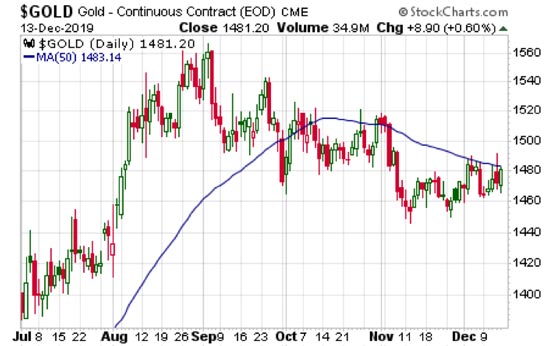
If the HUI is a leading indicator for spot gold (and it often is), then gold prices may be on the verge of also breaking out. Gold closed last Friday right at 50-day moving average resistance.
A couple strong closes above the 50-day line should put gold on a pathway to an extended rally.
Silver, meanwhile, has been trading around the $17.00/oz level for the past five weeks and needs to break above $17.30, then $17.50, to get something going on the upside.
Bulls can take encouragement in the impressive outperformance of the Silver Miners ETF (NYSE:SIL). It gained 4.5% last week to reach a three-month high. Another move of that magnitude this week would put SIL at a new high for the year – and give silver itself some catching up to do!
The Money Metals News Service provides market news and crisp commentary for investors following the precious metals markets.
Now that the UK election is over, at least the political side of Brexit seems on firmer footing going forward.
Therefore, attention is turning away from the divorce drama and back to the underlying data.
The UK leaving in January still has economic implications, and the pound ought to be affected. After some rosier than expected data last week, tomorrow we get employment data.
Lately, central bank policy has shifted towards an emphasis on maintaining employment as a way of pushing inflation. The BOE hasn’t been as outspoken on that subject. And with core inflation close to target rate, they have been holding off on rate cuts.
However, with a steadier outlook following the General Election, a worse performance in jobs numbers could renew calls for a rate cut.
Can We Look Forward to More Cheap Money?
So far, only two members of the nine on the Monetary Policy Committee – Saunders and Haskel – have been calling for more stimulus.
A significant disappointment in employment might change the numbers a bit. Also, we shouldn’t forget that BOE Governor Mark Carney is nearing the end of his term, and will move on to other things at the end of January.
Generally, central banks are loath to rock the boat ahead of a change of the guard, leaving many analysts suggesting that if a rate cut happens, it will be in February.
Also later today and tomorrow, Carney will be speaking at the ECB. Mostly it’s expected to be protocol, with a set speech to be released ahead of time. But, if a reporter gets the right question in, we might get some insight into the bank’s outlook.
This week, the market is getting ready for the holidays. So, most would expect leaders to avoid major announcements that might rile up the markets.
What We Are Expecting
For tomorrow’s releases, we want to be looking at the Claimant Count Change. This is the number that usually moves the market.
Current projections are for there to have been 20.2K net additions to the unemployment rolls in the UK. This would be down from 33K prior. So far this year, the UK hasn’t managed to have a single month of net job adds, with last month being the worst since 2011.
The data covers the lead-up to the General Election. And many employers could have held off on hiring new help until that uncertainty was resolved. After the election, there would still be time to bring on additional staff for Christmas trading. So, an unusually high number this time around might not be interpreted as all that bad.
On the other hand, there has been some euphoria in the markets following the election, and underperformance in the jobs data might be a rude return to reality.
Other Figures
Expectations are for the unemployment rate to remain steady at 3.8%, where it has been stuck for the last six months, with ups and downs of a decimal.
What might be of more interest from the monetary stability standpoint is the weekly earnings figure, which is projected to bump up to 3.8% growth from 3.7% in October. That would bring it just off the recent highs and might provide some arguments to not cut rates.
Of course, we’ll get the final answer on rates this Thursday following the MPC meeting, and it would be expected the pound remain active until then.
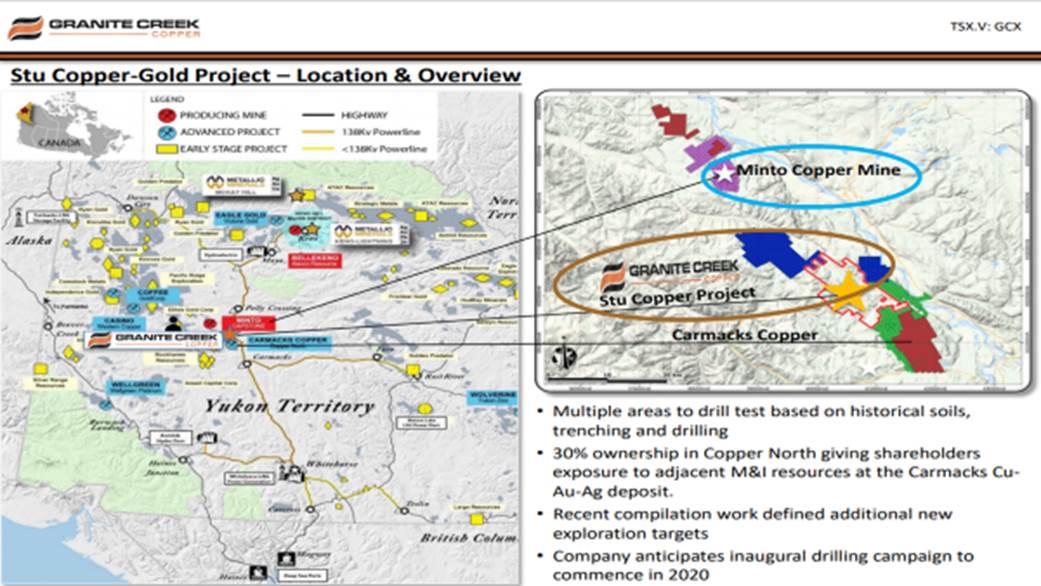
Tim Johnson, CEO of Granite Creek Copper, sits down with Maurice Jackson of Proven and Probable to discuss the copper market, his company’s exploration plans in the Yukon and its recent purchase of a 30% stake in its neighbor.
Maurice Jackson: Joining us for conversation is Tim Johnson, the president and CEO of Granite Creek Copper Ltd. (GCX:TSX.V). It’s a pleasure to have you back to provide us with some important updates regarding the 100% Stu Copper-Gold-Silver project located in the prolific Minto Copper district. Before we go any further, Mr. Johnson, for first time listeners, please introduce us to Granite Creek Copper and what is the opportunity the company presents to the market?
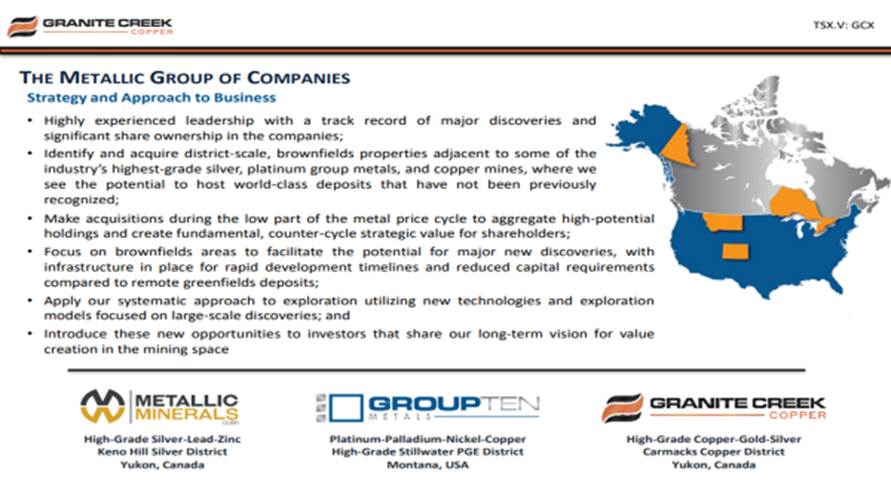
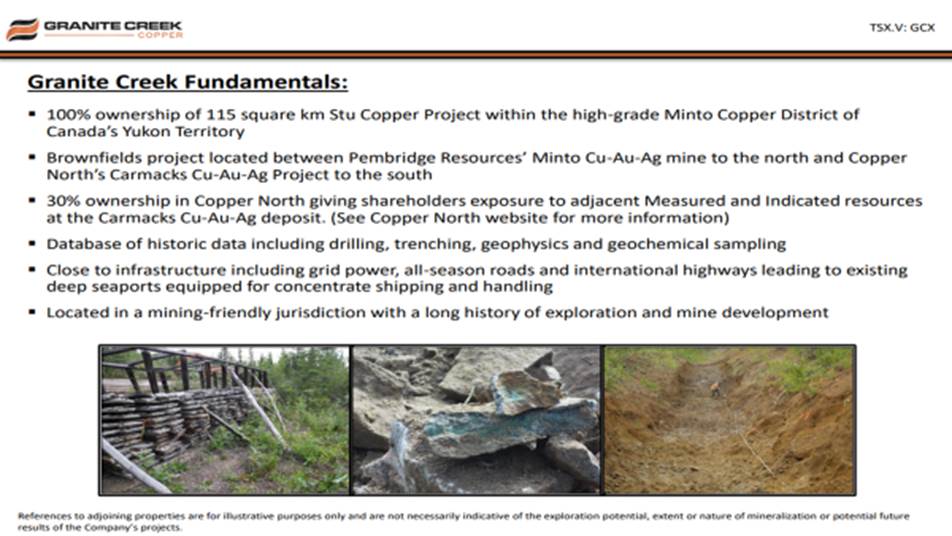
Tim Johnson: Granite Creek is a member of the Metallic Group of Companies, and why that’s significant is that all three companies in the group share a common philosophy and a common way of doing business, which is to identify a large, quality land position in what we’re calling a brownfields districtin our case, a brownfields district is something that has already been explored previously, has an operating mine or near to an operating mine in the district, and it gives us multiple exit strategies.
We don’t need to go all the way to a Measured and Indicated resource. We can find something that might be interesting to our neighbor and, in our case, we can bring the amount of contained copper in the district up to a point where we start to attract bigger attention to the belt for our benefit and to the other players in the belt as well.
Maurice Jackson: From a macro perspective, can you share the supply and demand fundamentals for copper?
Tim Johnson: We see a potential deficit in copper moving forward and some analysts say that we’re in deficit already. We see probably first or second quarter of 2020 being in a real deficit that’s going to start to come out on the books of the main major analysts. There’s a lot of reasons for that. People point to the electrification of transportation, but we see it as sort of an electrification of a bunch of other things. China is creating a middle class and when you do that, you need an awful lot of copper in vehicles and houses and industry. There’s a lot of different metrics driving it, whether it’s China or globally, including the move from internal combustion engines to electric vehicles.
One of the important points that we see in the copper market is when you do that transition, whether it’s houses or vehicles, you actually take a large amount of copper out of the market and you put it in things that might last longer than you would expect. It’s not electronics that are getting turned over every year. We’re hearing that some of these electric cars could have 15- to 20-year life. When you take an awful lot of copper and you sock it away in these things and it’s off the market, the supply has to come up to maintain the global economy.
Maurice Jackson: One of the reasons we have you on the program here is that we believe that copper may very well become one of the most valuable metals on the planet. More copper is going to be consumed in the next 25 years than all of combined history, and please correct me if I’m wrong, but there’s less than two weeks supply of copper on hand in the world today and germane to this point is that a number of copper mines are running out of materials in which we’re witnessing right now among your peers that are in production in the Minto Copper Belt, is that correct?
Tim Johnson: Yes. In the Minto copper belt itself, the Minto mine, owned by Pembridge, just recently went back into production and they went into production, I believe, with somewhere around a 3.5- to 4-year mine life. So that’s not a lot. Because this is a new company that has recently acquired this asset, we expect them to be aggressively exploring on their own ground, which is very close to us, to add resources. But we also expect them to have at least half an eye, if not a full eye, toward us and our progress as we build out our resources, as well. And you’re right on the global picture. Even some of the mines that still have resources, in Chile for instance, they’ve gotten down through the easily extracted materials.
They’ve gone through the oxide and they’re now looking at a sulfide resource that is a lot more expensive to extract. It’s entirely different economics. For instance, with an oxide resource, these big mines in Chile are producing copper at mine site. With a sulfide resource, you’re producing a concentrate at mine site that has to be then shipped to a smelter. We’re seeing this transition in a lot of the really large mines that have been producing for upwards of 50 years. This transition is going to be significant to our industry,
Maurice Jackson: Sir, for the person listening, how does Granite Creek Copper fit into the narrative?
Tim Johnson: We’re a brownfields project. We’ve got historical drilling on our ground and, after we acquired the project in January, we also acquired a large, historical database. We’ve been able to fast track drill targets and hope to be able to do what we’re calling discovery-focused drilling next season, where we’re taking those targets and drilling off a bunch of them and seeing in which area we are most likely to be able to quickly build a resource.
We see ourselves as an explorer and developer of resources. We don’t see ourselves as miners, but every year you evaluate where you are and see where you’re going to go. I think what we want to do is tie into something and rapidly grow a resource as the copper market turns and as a price starts to push north of $3 to $3.50 a pound, which is going to make production decisions in anything that we discover much easier.
Maurice Jackson: Granite Creek Copper has successfully expanded its footprint in the prolific Minto Copper District by completing a strategic acquisition of 30% in Copper North mining (Press Release). Can you share the details with us?
Tim Johnson: That was a good acquisition for us. It gives our shareholders just under 30% exposure to an already drilled off and identified resource within the Minto Copper Belt itself. We think the synergies are really good with whatever we discover on our ground. There’s a potential to combine resources at some point and look at what we do with that 30%. We’re open to either further acquisition or even developing jointly with Copper North. There are many different possibilities we can do with that interest.
Maurice Jackson: Take us behind the scenes and walk us through on why this was the right acquisition for shareholders and why now?
Tim Johnson: The copper market has been depressed; prices have been down around $2.50 to $2.60 over the past few months. The resource that Copper North had isn’t economic at these prices. I think there was a frustration amongst shareholders that maybe they got in too early. And they were looking for an exit and they were looking for a block exit. They didn’t want to trickle their shares out, and there was really no market for their shares.
The share exchange that we did, we, in a way, offered them an exit strategy. We have a little bit longer term view; we see the price of copper starting to turn and we see a very strong copper price moving into 2020 and beyond. For our shareholders, I think it was a very good acquisition and I think you’ll see that reflected as copper price increases, which it should do very well for our share price.
Maurice Jackson: Does this transaction change the thesis on your genetic model and or your exploration model?
Tim Johnson: Not really. Our focus this field season this year had been on looking for resources that are right close to the claim boundary. Readers should note that the two properties, the two projects owned by Copper North and by us, are adjacent and we see potential just across the claim boundary for extensions of mineralization that’s been identified on their ground. It doesn’t really change anything in that regard. And we will be looking at what further transactions we might make within the belt.
Exploration focus isn’t going to change and our development track is to find combined pounds in the ground that will attract significant players to the belt. Whether it’s one of the big copper players or a multi-metal player. Once we get to a certain threshold, whether it’s Copper North, or us, or combined, we’re going to attract the big players. That’s been our narrative and that’s going to continue to be our narrative.
Maurice Jackson: Speaking of what’s next, multilayered question: what is the next unanswered question for Granite Creek Copper, when can we expect a response, and what determines success?
Tim Johnson: Our big thing is whether or not we can identify and drill resources in an initial drill program on the project that should start as soon as winter breakup is completed. That will be around MayJune, somewhere in there. We will be seeking a financing in order to raise funds for that in the next few months. Our success is finding something that we can point to and say, yes, we can start to drill off a resource around this and you’ll see that second quarter to mid-next year.
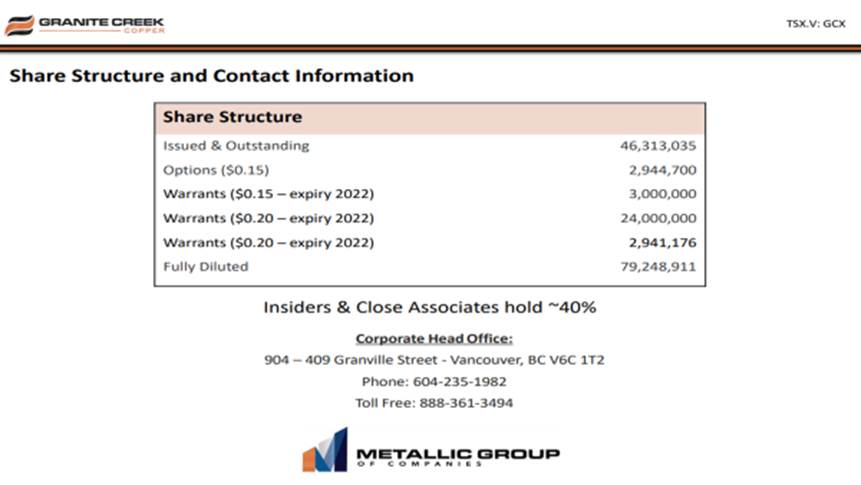
Maurice Jackson: Let’s review some numbers. Mr. Johnson, please share the capital structure for Granite Creek Copper.
Tim Johnson: We’ve got 46 million shares out right now. That was recently bumped up by our acquisition. We issued roughly 10 million shares for the acquisition of the Copper North shares. Currently we’ve got about 27 million warrants out at 20 cents and another 3 million warrants out at 15 cents. So fully diluted, we’re at 79 million shares. Insiders and close associates of insiders hold roughly 40% to 45% of that. And we’re all very incentivized to work hard and to increase shareholder value.
Maurice Jackson: In closing, Tim, what keeps you up at night that we don’t know about?
Tim Johnson: So, the extension of the low copper prices that we see now, as I said, I think they’ve just started to turn and hopefully they continue to strengthen throughout the rest of this year and into next year. But, if there was a protracted sub $2.50 copper, it would be very difficult for us and we’d have to revise our strategy. That’s the biggest worry for us. Global markets are going to mitigate that. So, there’s not a lot we can do about that other than just keep an eye on it.
Maurice Jackson: Mr. Johnson, last question. What did I forget to ask?
Tim Johnson: You’ve done a really good job. I can’t think of a single question you forgot to ask.
Maurice Jackson: For more information about Granite Creek Copper, please visit www.gcxcopper.com. For direct inquires call 604-235-1982 or you may email: [email protected]. Granite Creek Copper trades on the TSX.V symbol: GCX.
Before you make your next bullion purchase, make sure you call me. I’m a licensed representative from Miles Franklin Precious Metals Investments, where we provide a number of options to expand your precious metals portfolio from physical delivery, off-shore depositories, precious metal IRAs, and private blockchain distributed ledger technology. Call me directly at 855.505.1900, or you may email [email protected].
Tim Johnson of Granite Creek Copper, thank you for joining us today on Proven and Probable.
Maurice Jackson is the founder of Proven and Probable, a site that aims to enrich its subscribers through education in precious metals and junior mining companies that will enrich the world.
Disclosure: 1) Maurice Jackson: I, or members of my immediate household or family, own shares of the following companies mentioned in this article: Granite Creek Copper. I personally am, or members of my immediate household or family are, paid by the following companies mentioned in this article: None. My company has a financial relationship with the following companies mentioned in this article: Granite Creek Copper is a sponsor of Proven and Probable. Proven and Probable disclosures are listed below. 2) The following companies mentioned in this article are billboard sponsors of Streetwise Reports: Metallic Group of Companies and Granite Creek Copper. Click here for important disclosures about sponsor fees. As of the date of this article, an affiliate of Streetwise Reports has a consulting relationship with Metallic Group of Companies and Granite Creek Copper. Please click here for more information. 3) Statements and opinions expressed are the opinions of the author and not of Streetwise Reports or its officers. The author is wholly responsible for the validity of the statements. The author was not paid by Streetwise Reports for this article. Streetwise Reports was not paid by the author to publish or syndicate this article. The information provided above is for informational purposes only and is not a recommendation to buy or sell any security. Streetwise Reports requires contributing authors to disclose any shareholdings in, or economic relationships with, companies that they write about. Streetwise Reports relies upon the authors to accurately provide this information and Streetwise Reports has no means of verifying its accuracy. 4) This article does not constitute investment advice. Each reader is encouraged to consult with his or her individual financial professional and any action a reader takes as a result of information presented here is his or her own responsibility. By opening this page, each reader accepts and agrees to Streetwise Reports’ terms of use and full legal disclaimer. This article is not a solicitation for investment. Streetwise Reports does not render general or specific investment advice and the information on Streetwise Reports should not be considered a recommendation to buy or sell any security. Streetwise Reports does not endorse or recommend the business, products, services or securities of any company mentioned on Streetwise Reports. 5) From time to time, Streetwise Reports LLC and its directors, officers, employees or members of their families, as well as persons interviewed for articles and interviews on the site, may have a long or short position in securities mentioned. Directors, officers, employees or members of their immediate families are prohibited from making purchases and/or sales of those securities in the open market or otherwise from the time of the interview or the decision to write an article until three business days after the publication of the interview or article. The foregoing prohibition does not apply to articles that in substance only restate previously published company releases. As of the date of this article, officers and/or employees of Streetwise Reports LLC (including members of their household) own shares of Granite Creek Copper, a company mentioned in this article.
Proven and Probable LLC receives financial compensation from its sponsors. The compensation is used is to fund both sponsor-specific activities and general report activities, website, and general and administrative costs. Sponsor-specific activities may include aggregating content and publishing that content on the Proven and Probable website, creating and maintaining company landing pages, interviewing key management, posting a banner/billboard, and/or issuing press releases. The fees also cover the costs for Proven and Probable to publish sector-specific information on our site, and also to create content by interviewing experts in the sector. Monthly sponsorship fees range from $1,000 to $4,000 per month. Proven and Probable LLC does accept stock for payment of sponsorship fees. Sponsor pages may be considered advertising for the purposes of 18 U.S.C. 1734.
The Information presented in Proven and Probable is provided for educational and informational purposes only, without any express or implied warranty of any kind, including warranties of accuracy, completeness, or fitness for any particular purpose. The Information contained in or provided from or through this forum is not intended to be and does not constitute financial advice, investment advice, trading advice or any other advice. The Information on this forum and provided from or through this forum is general in nature and is not specific to you the User or anyone else. You should not make any decision, financial, investments, trading or otherwise, based on any of the information presented on this forum without undertaking independent due diligence and consultation with a professional broker or competent financial advisor. You understand that you are using any and all Information available on or through this forum at your own risk.
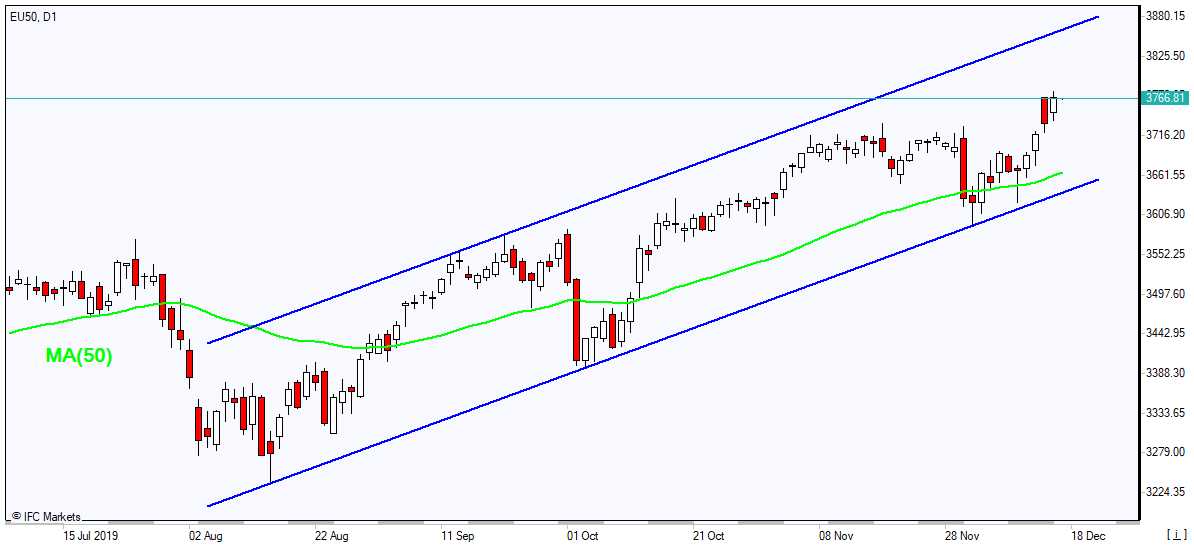
The current structure hints to a double zigzag consisting of primary sub-waves Ⓦ -Ⓧ and Ⓨ with the corrective move seeming to be part of a cycle degree wave IV.
In the primary degree, wave Ⓨ, which is under development at the time of writing, suggests that intermediate sub-wave (B) is a triple combination (W-X-Y-X-Z). This points to further upside in the short-term.
We could then see a bullish 5-wave impulse in the minute degree (wave ⓒ) driving prices near 1493.6 as part of the last corrective “three.” Then prices could slide into a bearish trend, completing intermediate impulse (C) near 1422.
A different view of the current structure offers an alternative scenario that could still play out, where intermediate wave (B) is completed. This possibility sees minor wave Z as a standard zigzag.
Based on this alternative, we can assume that the market has already completed the first bearish minor impulse of the potential 5-wave leg to the downside.
This suggests that a minor correction 2 could be well completed near 1481.8. And this could be then followed by a decline near 1422.0.
The focus should turn to the previous high (alternative intermediate (B)) and whether prices register a fresh high in an upside attempt.
The US dollar has started the week on a soft footing, though trading has been quiet so far today as traders digest the moves seen late last week. News of a last-minute trade deal between the US and China was greeted with a surge in equities prices which sent USD lower.
Though we have seen some recovery off the very lows of the move, further losses look likely if equities continue higher. USD index trades 96.66 last.
EUR Lower on Data Dump
EURUSD has fallen lower over the first European session of the week. Price is trading 1.1131 last, pulling back from overnight highs as a slew of eurozone, German and French PMI data sets came in below expectations.
The data highlights the ongoing issues facing the eurozone. And, despite a more optimistic tone at the last meeting, traders still eye further ECB easing in the near term.
GBP Down On PMI Weakness
GBPUSD has come under pressure today also as data released this morning showed the manufacturing and services PMIs both moving deeper into contractionary territory last month.
While uncertainty ahead of the UK elections was the likely driver, these readings have been trending worryingly lower all year. GBPUSD trades 1.3336 last, back below the 1.3377 level for now.
Risk Rallies on Monday
Risk assets have been higher again at the start of the week, extending last week’s gains seen in response to the news of a trade deal. With both US and Chinese legal teams reviewing the document as a formality ahead of the official signing, risk sentiment has been well supported. SPX500 trades 3181.68 last, challenging last week’s new, all-time highs as of writing.
JPY Down, Gold Up
Safe havens have had a mixed start to the week. JPY is lower against USD in light of the strong rally in equities,. Meanwhile, gold has been a little higher against USD in light of the weakness in USD this morning. USDJPY trades 109.41 last while XAUUSD trades 1477.96.
Oil Higher on Trade News
Oil prices were initially firmly higher over the European session today. However, we have seen gains softening a little recently, taking price back below the 60 level, to trade 59.92 last. News of the trade deal has been a major supporting factor for crude. And, along with the recently announced increased OPEC+ production cuts, this is keeping the near-term outlook bullish for crude.
Loonie Lower As CAD Climbs
USDCAD has been sharply lower over the European morning on Monday with price breaking down below the 1.3145 level. The rally in crude, along with the firmly bullish outlook for crude prices, is keeping CAD supported here. Along with USD weakness, this is likely to keep USDCAD trading lower in the near term.
Aussie Higher on Trade Deal News
AUDUSD has been higher so far today, taking advantage of weakness in USD as well as the better tone to risk assets following news of the trade deal. With the US & China set to commence negotiations on the second phase of the deal shortly after the New Year, the Aussie looks set to enjoy some further upside. AUDUSD trades .6885 last.
Euphoria is a type of market rally where valuations, real market expectations, and global market concerns are pushed away from view while a trader based rush to rally takes place. One of the clearest examples is the 1995 to 2000 DOT COM US stock market rally. As the Internet burst into homes and businesses across the world, the US-led the way with dozens of new Internet-based IPOs touting glorious expectations, potential earnings and more. Everyone had the idea this new medium would dramatically change the economy for the better and breakthrough traditional economic boundaries.
The rally that took place in 1995 through 2000 was incredible. The S&P 500 rallied from 463 to 1535 – +235.57%. What we find interesting is the “price wave formation” that took place within that rally. There were a number of key price rotations that took place as the market continued to rally, we’ve labeled them A, B, and C. The first rotation, A, took place in July~Dec 1997. The second, B, took place from May 1998 to November 1998. The last, C, took place between January 1999 and November 1999. Technically, these rotations are significant because they represent “true price exploration” related to price advancement. The price must always attempt to identify true support/resistance levels while trending.
When we compare the rally from 1995 to 2000 with the current rally in the US stock market, we can see a defined level of euphoric price advance after the 2016 US elections. We must also pay attention to the previous price advance from the 2009 price lows as the global markets were struggling to recover from the Credit Crisis. Our research team identified the A, B, C rotations in the current price and associated them to the similar rotations in the 1995-2000 price rally as “key components of the current rally and a potential warning sign of a pending top formation”.
Our researchers believe the QE processes of the global central banks have set up a similar type of euphoric price rally in the current global markets even though current economic metrics are warning of weakening economic activity and weakening global market output. The US Fed and global central banks seem to want to keep pumping money/credit into the global markets to keep the rally going – most likely because they are fearful of what a crash/correction may do to the future growth opportunities around the planet.
Yet, our research team focused on the C rotation in 1999 and 2019 – a full 20 years apart. What interested our research team the most was the fact that the rotation in 1999 set up a full 21 months before the November 2000 US Presidential election. The current C rotation initiated in January 2018 – a full 34 months before the November 2020 US Presidential Elections. Anyone paying any attention will recognize the 21 and 34 are both Fibonacci Numbers – relating a 1.619 ratio advancement.
Are we setting up a massive top in the US stock market based on a Fibonacci price range expansion related to the patterns we have identified in this SP500 chart? Have we advanced from the 2000 peak and 2009 bottom in some form of Fibonacci Ratio expansion that aligns with the C rotation pattern we have identified?
The rally from Bill Clinton’s second term start date to the peak in 2000 totaled 932.9 pts – +153.61%. the rally from Donald Trump’s first term start date to our projected peak level totals 997.5 pts – +44.38%. The rally in 2000 peaked at a range that is 200% larger than the ration between the two separate percentage point ranges. Is this significant to traders? Does it help to align our peak with the 1.619 Fibonacci ratio?
153.61 / 44.38 = 3.4612
3.4612 / 2 = 1.7306
Given the alignment of these values with a potential 200% range expansion theory, we need to start to look at TIME/PRICE ratios to determine if these rallies are aligned efficiently.
The rally from 1995 to the peak in 2000 consisted of 63 Months. The rally from 2009 to our projected peak consists of 131 bars. This represents a price TIME expansion of 207.9%
The rally from 1995 to the peak in 2000 consisted of a price move of +1081.2 pts (+235.57%). The rally from 2009 to our projected peak consists of a price move of 2585.6 pts (390.49%). The ratio between these two price expansions is 1.657.
The correction from the peak in 2000 to the low in 2009 consisted of 109 months. The ratio between the 63 months (1995~2000 peak) to this correction time is 1.73. The ration of the 2009~2019 rally time span is 1.20. Thus, the correction between the peak in 2000 to the bottom in 2009 expanded at a rate of 1.73x the time it took to complete the DOT COM rally from 1995 to 2000. The recovery that has taken place from the 2009 bottom to our projected top in 2019 would expand at a rate of 1.20x the correction time rate. All of these levels align with common Fibonacci numbers and ratios.
In other words, we believe the current expansion in price is nearing a completed Elliot Wave/Fibonacci ratio peak (likely wave C) that maintains proper aspect ratios related to previous major price rotations.
Our Custom Volatility Index shows extended volatility is increasing with price nearing the upper range for December 2019. Notice the increase in the range of these bars since the just before the peak in January 2018. This increased range suggests extreme price volatility has been pushing the markets for the past 24+ months. If this volatility continues into early 2020 as our projected peak sets up, we may see some very big rotation in 2020.
2000 and 2019 Price Similarities in S&P 500
This 2000 peak to 2019 peak comparison chart highlights the similarities in the C price pattern that has setup. In 1999, the C pattern set up with an initial peak, followed by minor downside rotation – just like in January 2018. The second peak was higher, followed by a much deeper downside price rotation – just like in Nov/Dec 2018. And the final rally broke upward after a Pennant/Flag formation pushing higher by +25% in 2000. The current upside breakout from the December 2018 lows suggests a 39.5% price peak – just above our predicted 32% scaled Fibonacci rally expectation.
Fibonacci Price Amplitude Top Level Is Not Much Higher
The total scope of this price move over the past 40+ years is impressive. These longer-term patterns still drive the markets to establish major peaks and valleys. Take a look at this chart and try to understand the ratios that are being presented here. 21%, 34%, 50%, 62%, 100% and any combination of these levels using 2x, 3x or any multiplier constitute a Fibonacci structure. One of the most important facets of attempting to understand the Fibonacci price theory is that the ratios must be somewhat aligned.
Pay attention to the Fibonacci Price Amplitude arcs (the circles) drawn on this chart. They represent the price range from the peak in 2000 to the low in 2009. The reason this range is important to our researchers is that it will properly measure the previous upward price rally and the current price rally in terms of price amplitude. Pay attention to how the current price rally stalled and rotated near these arcs. We believe the upper GREEN arc level will operate as major resistance for the markets – possibly setting up another “rollover” type of top similar to the one in 1999~2000.
Skilled technical traders still need to be cautious headed into 2020. The current rally, and most of 2018 and 2019, have been setting up a very serious type of pre-top setup. Any downside rotation in early 2020 may attempt to move lower in multiple waves – possibly spanning multiple years.
Currently, our research suggests a limited 2.5% upside price range before the SP500 will reach the GREEN resistance arc. The US markets may reach this level before the end of 2019 and may begin a topping pattern before you finish reading this article. Please stay informed and understand the structures, trends, and dynamics that are at play in these markets to attempt to reduce your risk. Now is the time to trim your equity/stock positions and prepare for a much bigger swing in price/volatility.
As a technical analysis and trader since 1997, I have been through a few bull/bear market cycles. I believe I have a good pulse on the market and timing key turning points for both short-term swing trading and long-term investment capital. The opportunities are massive/life-changing if handled properly.
We’ll keep you informed as this plays out with Wealth Building & Global Financial Reset Newsletter if you like what I offer, join me with the 1 or 2-year subscription to lock in the lowest rate possible and ride my coattails as I navigate these financial market and build wealth while others lose nearly everything they own during the next financial crisis. Join Now and Get a Free 1oz Silver Round or Gold Bar Shipped To You!