The US dollar continued to keep the bullish momentum intact. The latest economic report from the United States showed that factory orders beat estimates, rising 1.8% on the month. The data beat estimates of a 0.7% increase. However, previous month’s report was revised down to show a 1.2% decline.
Eurozone Producer Prices Stays Flat in January
The latest producer prices data for the eurozone showed an unchanged print for January. The data was below estimates of a 0.1% increase and down from a revised 0.1% increase in December. Meanwhile, in a separate report, Italy’s preliminary inflation data saw a 0.2% increase, beating estimates of a 0.2% decline.
EURUSD Keeps the Downtrend Intact
The common currency continues to maintain a bearish outlook. Price action remains poised for a test of the lower support level at 1.1000. However, price needs to close below 1.1021 low to confirm this. A reversal above this price point could signal a higher high in price and potentially renew a price correction.
UK Construction Rises in January
Growth in the construction sector in the UK was stronger in January. Data from IHS Markit showed that construction activity rose from 44.4 in December to 48.4 in January. The data comes on the back of the manufacturing sector also posting a strong rebound during the month. Sterling, however, remains muted to the economic data amid the Brexit negotiations.
GBPUSD Bounces off Support – But Will it Hold?
The cable drifted down to briefly test the 1.2960 level of support. But prices were rejected quickly leading to a modest bound in price. A firm test of this support level could build the basis for an upside bias. Therefore, there is a risk of a decline back to this level. Alternately, if the rebound holds, then we expect a move back to the 1.3100 level.
Gold Prices Slip on Rising Risk Sentiment
The gains in the equity markets put the price of gold in check. The precious metal is falling for the second consecutive day. Despite investor concerns of the impact of Coronavirus, equities are holding on to the gains. The declines also come amid the USD trading stronger on the back of positive economic reports.
XAUUSD Could Test Support at 1534
The precious metal maintains a bearish outlook. Price action is likely to slide toward the 1534 level of support initially. In the short term, the price level at 1561 could be tested from the downside. If resistance holds, then we anticipate further declines lower, on a break below the 1534 level.
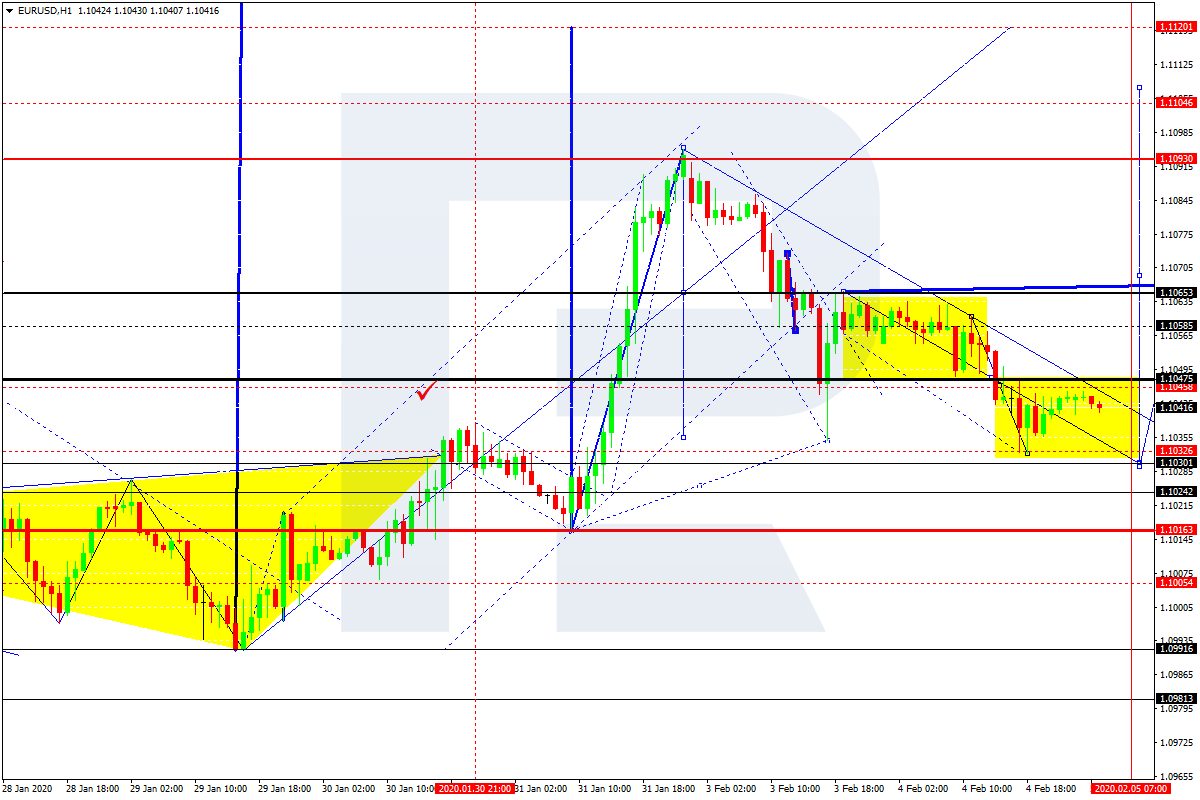
After forming another consolidation range above 1.1045, EURUSD has broken it to the downside. Possibly, the pair may form a new descending structure towards 1.1030 and then start another growth to reach 1.1065.
GBPUSD, “Great Britain Pound vs US Dollar”
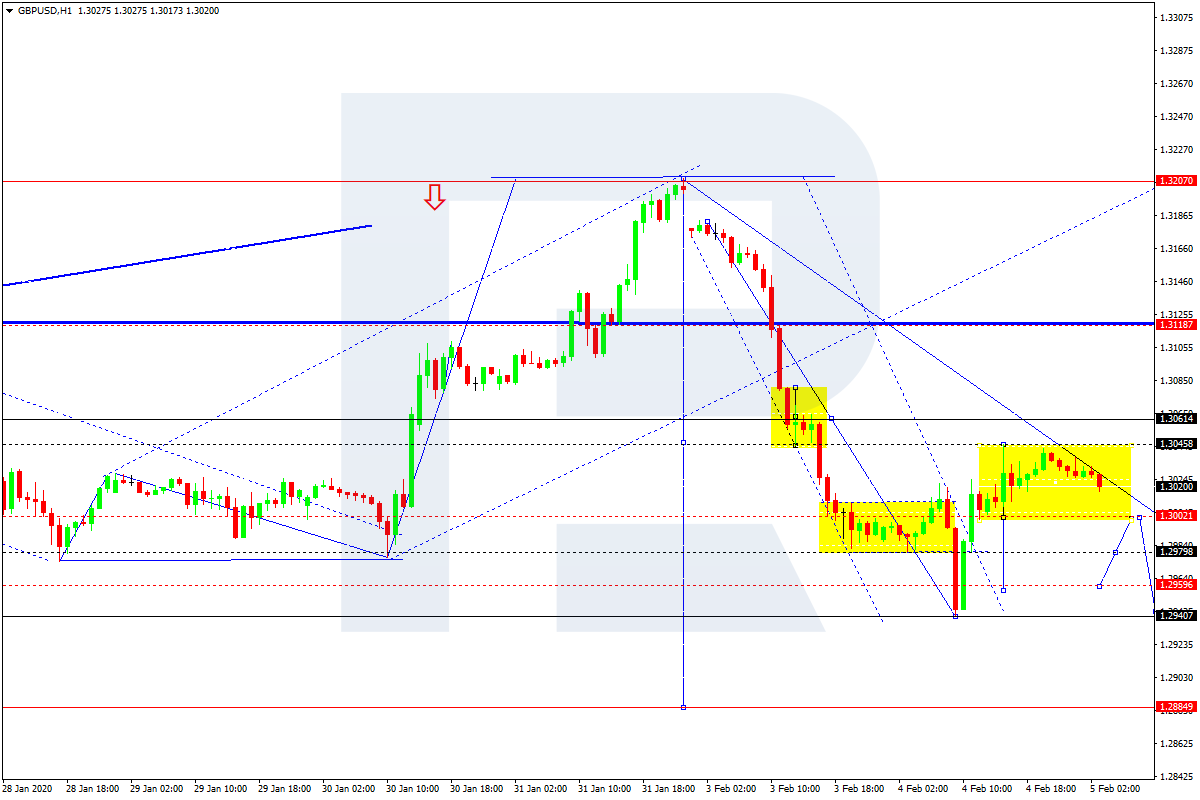
After breaking 1.2980 to the downside and reaching 1.2940, GBPUSD has formed a new ascending impulse towards 1.3045; right now, it is consolidating above 1.3000. If later the price breaks this range to the downside, the market may resume moving downwards to reach 1.2960; if to the upside – start a new growth towards 1.3090.
USDCHF, “US Dollar vs Swiss Franc”
After forming another consolidation range around 0.9666, USDCHF has broken it upwards. Today, the pair may continue growing to reach 0.9705 and then resume trading inside the downtrend with the target at 0.9666.
USDJPY, “US Dollar vs Japanese Yen”
After reaching 108.90 and forming one more consolidation range, USDJPY has broken it upwards. Possibly, today the pair may grow to reach 109.57. After that, the instrument may form a new descending structure to test 108.90 from above.
AUDUSD, “Australian Dollar vs US Dollar”
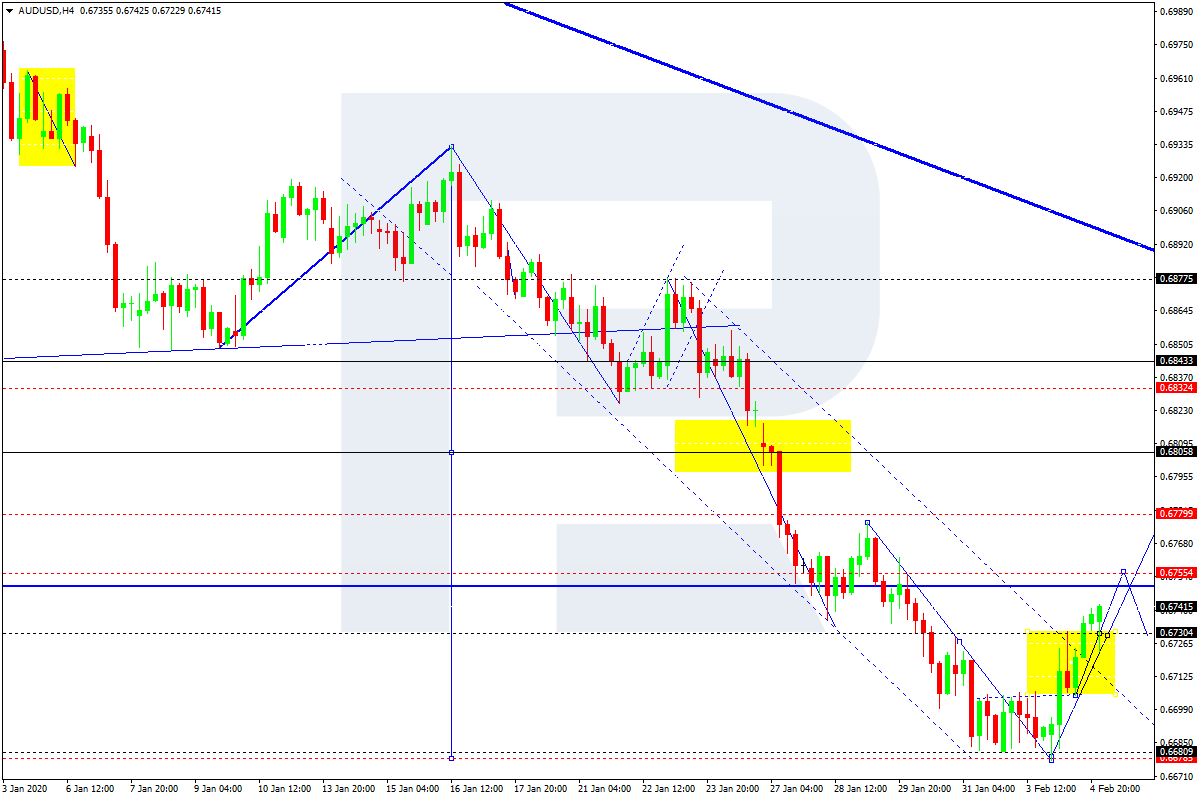
AUDUSD is consolidating above 0.6730. Today, the pair may grow to reach 0.6755 and resume trading downwards with the target at 0.6730. After that, the instrument may start a new growth towards 0.6780.
USDRUB, “US Dollar vs Russian Ruble”
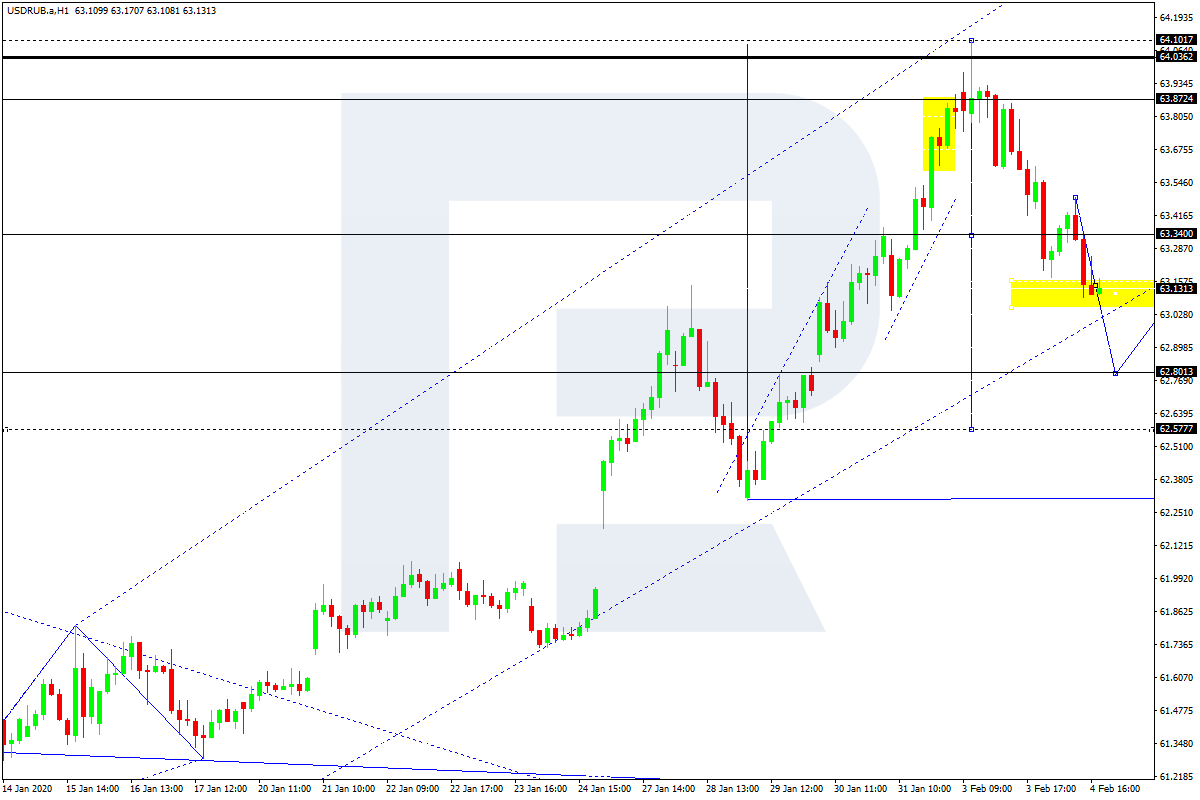
USDRUB is moving downwards. Possibly, today the pair may reach 62.80 and then form one more ascending structure towards 63.34. Later, the market may resume falling with the target at 62.60.
USDCAD, “US Dollar vs Canadian Dollar”
USDCAD is consolidating above 1.3267. Possibly, the pair may expand the range up to 1.3309. After that, the instrument may start a new decline with the target at 1.3216.
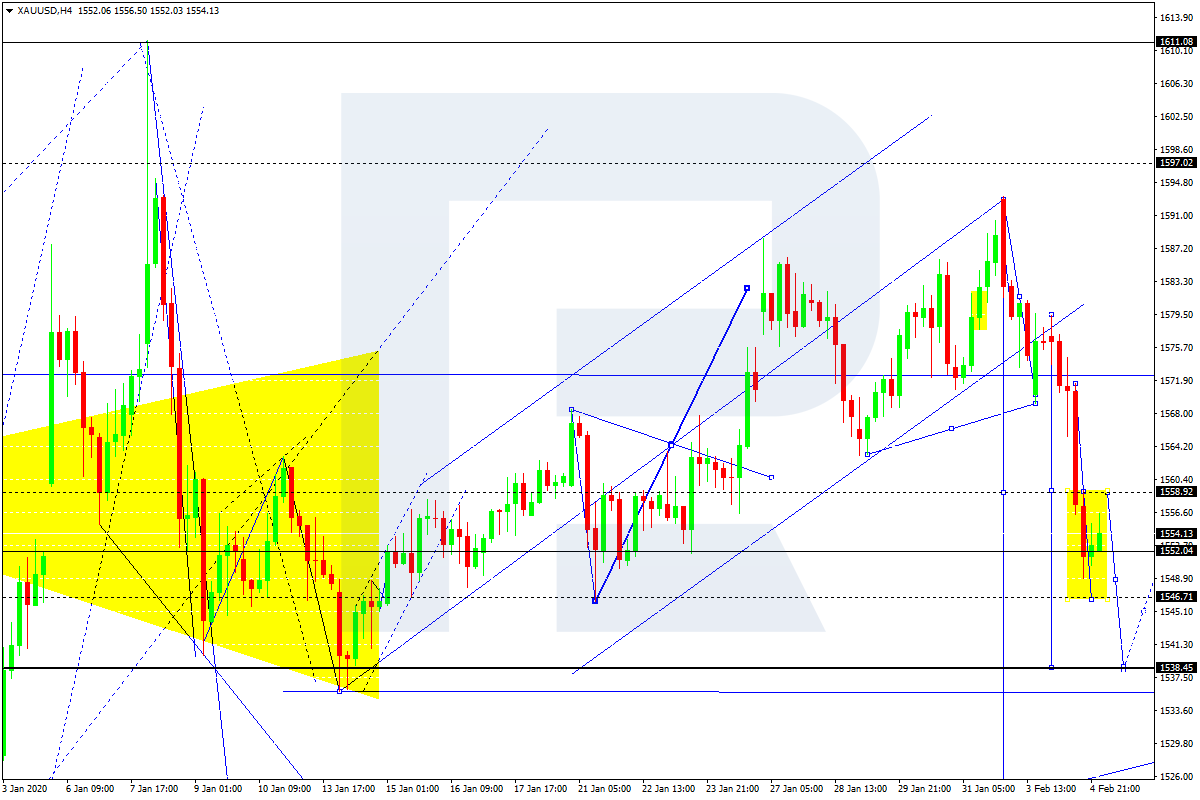
XAUUSD, “Gold vs US Dollar”
Gold is moving downwards. Today, the pair may consolidate around 1558.90. If later the price breaks this range to the downside, the market may reach 1538.45 and then start another correction to reach 1558.95. After that, the instrument may form a new descending structure with the target at 1524.50.
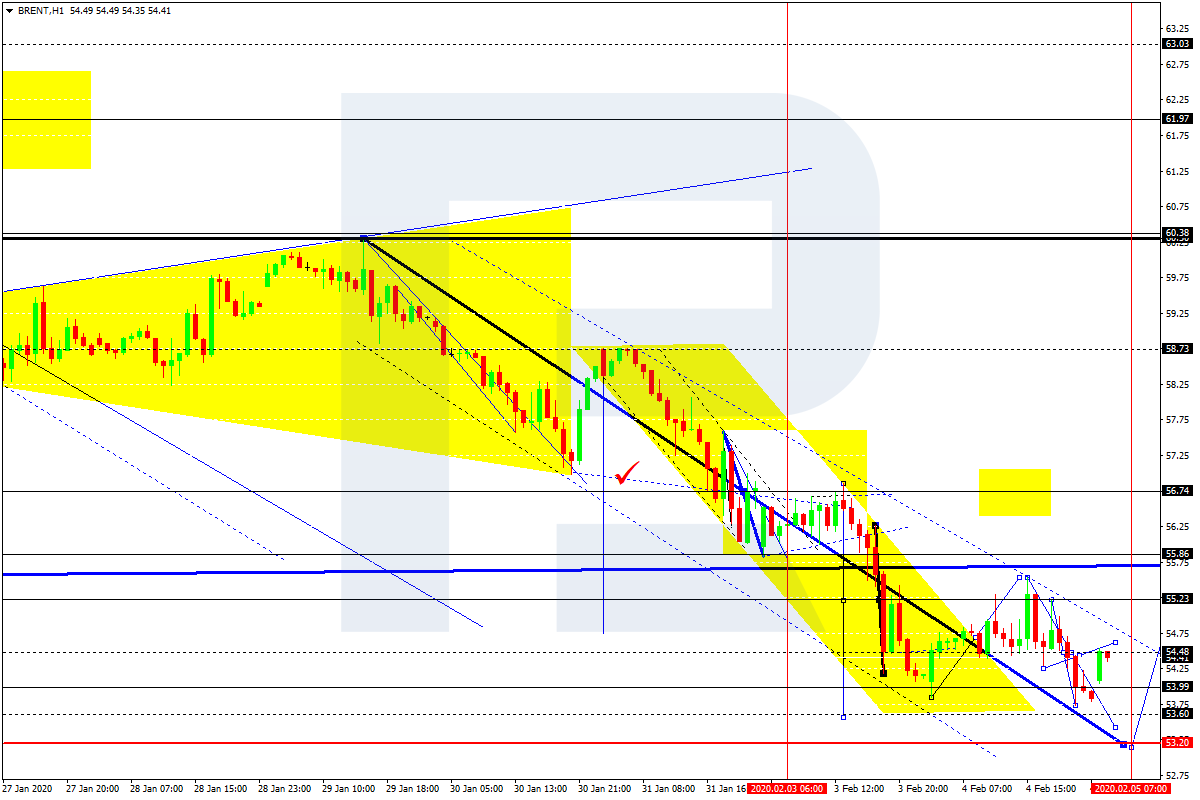
BRENT
Brent is consolidating around 54.50. Possibly, the pair may expand the range down to 53.60 and then resume growing to return to 54.50. Later, the market may form a new descending impulse to update 53.20 and then start another growth with the first target at 56.75.
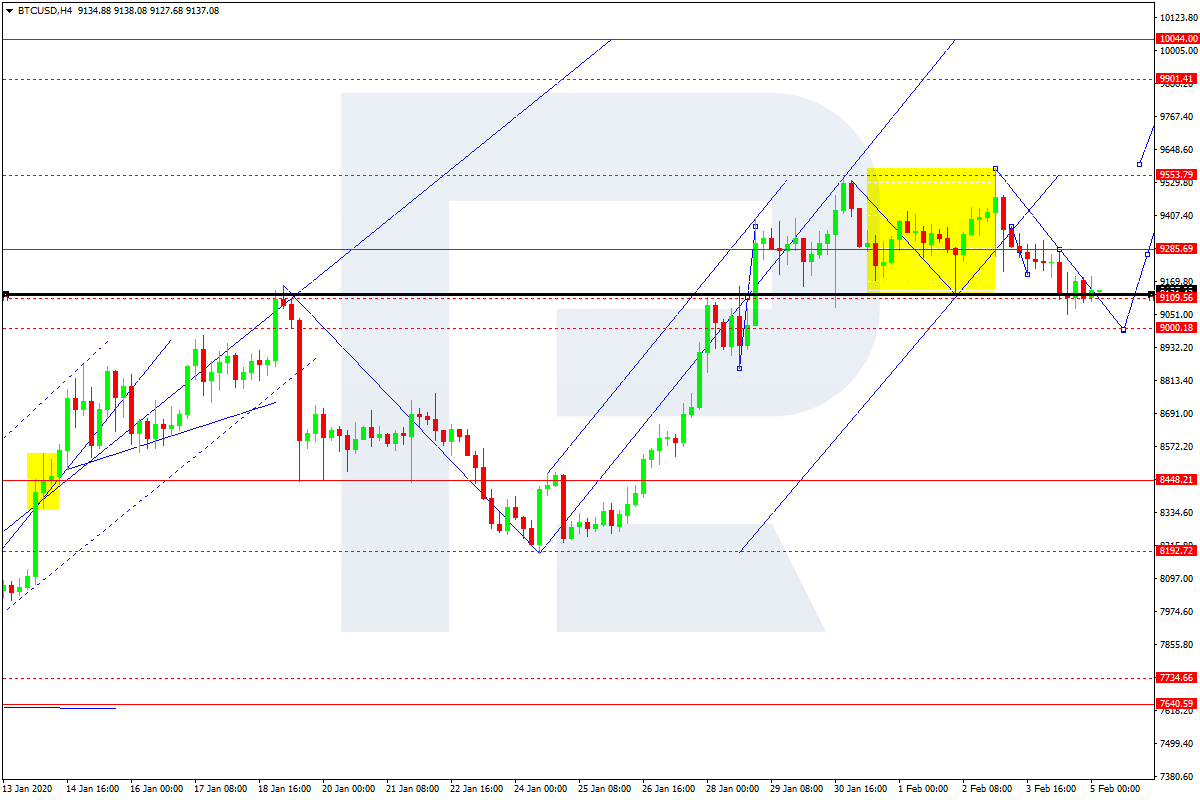
BTCUSD, “Bitcoin vs US Dollar”
BTCUSD is consolidating around 9300.00; right now, it is falling to reach 9000.00 and may later grow to return to 9300.00, thus forming a new consolidation range. If later the price breaks this range to the upside, the market may resume moving upwards to reach 10044.00; if to the downside – start a new correction towards 8500.00.
Attention! Forecasts presented in this section only reflect the author’s private opinion and should not be considered as guidance for trading. RoboForex LP bears no responsibility for trading results based on trading recommendations described in these analytical reviews.
As we can see in the H4 chart, GBPUSD is still forming expanding Triangle pattern, which means that the pair may continue falling to reach the low at 1.2904. If the price breaks this level, the instrument may continue its decline towards 50.0% and 61.8% fibo at 1.2856 and 1.2700 respectively.
The H1 chart shows a slight pullback after a quick decline. Judging by MACD dynamics, after completing the pullback the pair may resume moving downwards to reach 50.0% fibo (1.2855).
EURJPY, “Euro vs. Japanese Yen”
As we can see in the H4 chart, after falling and reaching 38.2%, EURJPY has started a new pullback to the upside. Possibly, the pair may break the resistance at 23.6% fibo (121.21) and then continue growing towards the high at 122.87 or even mid-term 61.8% fibo at 123.05. However, this scenario won’t be valid as long as the price hasn’t broken the resistance. In this case, the instrument is expected to continue its decline towards 50.0% and 61.8% fibo at 119.36 and 118.55 respectively.
The H1 chart shows a new pullback to the upside, which has already reached 38.2% fibo. The next targets may be 50.0% and 61.8% fibo at 121.32 and 121.68 respectively. The support is the low at 119.77. If the price breaks it, the mid-term decline will continue.
Attention! Forecasts presented in this section only reflect the author’s private opinion and should not be considered as guidance for trading. RoboForex LP bears no responsibility for trading results based on trading recommendations described in these analytical reviews.
The US dollar strengthened slightly against a basket of major currencies. The dollar index (#DX) closed in the green zone (+0.15%) yesterday. Speech by US President Donald Trump in the American Congress addressing the nation supported the US currency. He said about the “incredible results” of the economic policies of his administration and the excellent prospects for the US economy. During the speech, he painted an encouraging picture of his presidency in the hope of convincing the Americans to give him another chance in the November 3, 2020 election.
The Chinese yuan has been growing after the World Health Organization (WHO) confirmed that coronavirus could be localized. The death toll in mainland China increased to 490, and the number of confirmed cases rose to 24,324. However, despite the increase in deaths, WHO is confident that the spread of the virus can be stopped, as 99% of infections so far are attributed to China. These reports have weakened the demand for safe assets.
The “black gold” prices have been growing after a protracted fall. Currently, futures for the WTI crude oil are testing the $50.80 mark per barrel. At 17:30 (GMT+2:00), US crude oil inventories will be published.
Market Indicators
Yesterday, there was the bullish sentiment in the US stock market: #SPY (+1.52%), #DIA (+1.43%), #QQQ (+2.29%).
The 10-year US government bonds yield has been growing. At the moment, the indicator is at the level of 1.62-1.63%.
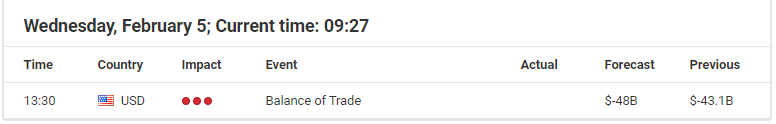
The Economic News Feed for 05.02.2020:
– UK composite PMI at 11:30 (GMT+2:00);
– UK services PMI at 11:30 (GMT+2:00);
– ADP nonfarm employment change in the US at 15:15 (GMT+2:00);
The technical picture on the EUR/USD currency pair is ambiguous. At the moment the trading instrument is being consolidated. Investors are waiting for additional drivers. The local support and resistance levels are 1.10300 и 1.10500, respectively. Today, participants in financial markets will assess important economic releases from the United States. We recommend opening positions from key levels.
The Economic News Feed for 05.02.2020:
– Composite business activity index from Markit (EU) – 11:00 (GMT+2:00);
– Retail sales volume (EU) – 12:00 (GMT+2:00);
– Change in the employment numbers in the non-agricultural sector from ADP (US) – 15:15 (GMT+2:00);
– ISM’s supply manager index for the non-agricultural sector (US) – 17:00 (GMT+2:00);
The indicators do not give an accurate signal: 50 MA started crossing 100 MA.
MACD is in the negative zone, which indicates a bearish sentiment.
The Stochastic Oscillator is in the oversold area, the %K line is above the %D line, which gives a signal to buy EUR/USD.
Trading recommendations
Support levels: 1.10300, 1.10100, 1.09900
Resistance levels: 1.10500, 1.10650, 1.10950
If the price fixes above 1.10500, EUR/USD quotes are expected to rise to 1.10700-1.10900.
Alternatively, the quotes could descend toward EUR/USD currency pair to 1.10100-1.09900.
The GBP/USD currency pair
Technical indicators of the currency pair:
Prev Open: 1.29894
Open: 1.30316
% chg. over the last day: -0.27
Day’s range: 1.30088 – 1.30379
52 wk range: 1.1959 – 1.3516
GBP/USD quotes have retreated from local lows. At the moment the technical pattern is ambiguous. Sterling tests local support and resistance levels: 1.30050 and 1.30450, respectively. The trading instrument has potential for further recovery. Investors are waiting for important economic releases from UK. We also recommend you to pay attention to the news background on the US economy. Positions should be opened from key levels.
The UK news feed is calm.
Indicators do not give accurate signals: the price consolidates near 50 MA.
MACD is near the 0 mark.
The Stochastic Oscillator is located in the neutral zone, the %K line is above the %D line, indicating a correction in GBP/USD quotes.
Trading recommendations
Support levels: 1.30050, 1.29800, 1.29450
Resistance levels: 1.30450, 1.30850, 1.31100
If the price fixes below 1.30050, you should consider selling GBP/USD.
Alternatively, the quotes could grow toward 1.30800-1.31000.
The USD/CAD currency pair
Technical indicators of the currency pair:
Prev Open: 1.32869
Open: 1.32765
% chg. over the last day: -0.02
Day’s range: 1.32758 – 1.32981
52 wk range: 1.2949 – 1.3566
USD/CAD currency pair has stabilized after a long rally. At the moment, the CAD is in sideways motion. The local support and resistance levels are: 1.32650 and 1.33000, respectively. Technical correction is not ruled out in the nearest future. Today we recommend you to pay attention to the dynamics of oil quotations, as well as to economic releases from the United States. Positions should be opened from key levels.
The Economic News Feed for 05.02.2020:
– Trade balance (CAD) – 15:30 (GMT+2:00)
The indicators signal the strength of buyers: the price has fixed above 50 MA and 100 MA.
Histogram of MACD is in the positive zone, which indicates a bullish sentiment.
The Stochastic Oscillator is located near the overbought zone, the %K line is above the %D line, which indicates that the price is above 50 MA and 100 MA.
Trading recommendations
Support levels: 1.32650, 1.32450, 1.32200
Resistance levels: 1.33000, 1.33400
If the price fixes above 1.33000, expect further growth toward 1.33300-1.33500.
Alternatively, the quotes could correct toward 1.32300-1.32100.
The USD/JPY currency pair
Technical indicators of the currency pair:
Prev Open: 108.687
Open: 109.515
% chg. over the last day: +0.69
Day’s range: 109.317 – 109.516
52 wk range: 104.45 – 113.53
Yesterday aggressive purchases were observed on USD/JPY currency pair. The growth of quotations exceeded 80 points. The trading instrument has set new local maximums. Demand for currencies save haven currencies has shrunk as investors have been encouraged by the Chinese government’s measures to to contain the coronavirus and limit its economic impact. At the moment, the USD/JPY currency pair is consolidating in the range 109.250-109.550. We do not rule out further weakening of the yen against USD. Positions should be opened from of key levels.
The news background on the Japanese economy is quite calm.
The indicators signal the strength of buyers: the price has fixed above 50 MA and 100 MA.
The MACD histogram is in the positive zone but below the signal line. It’s a weak signal to buy USD/JPY.
The Stochastic Oscillator is located in the neutral zone, the line %K is below the line %D, which indicates a bearish sentiment.
Trading recommendations
Support levels: 109.250, 109.100, 108.800
Resistance levels: 109.550, 109.750, 110.000
If the price fixes above 109.550, expect further growth of USD/JPY quotes toward 110.000.
Alternatively, the USD/JPY pair may decline to 109.000-108.800.
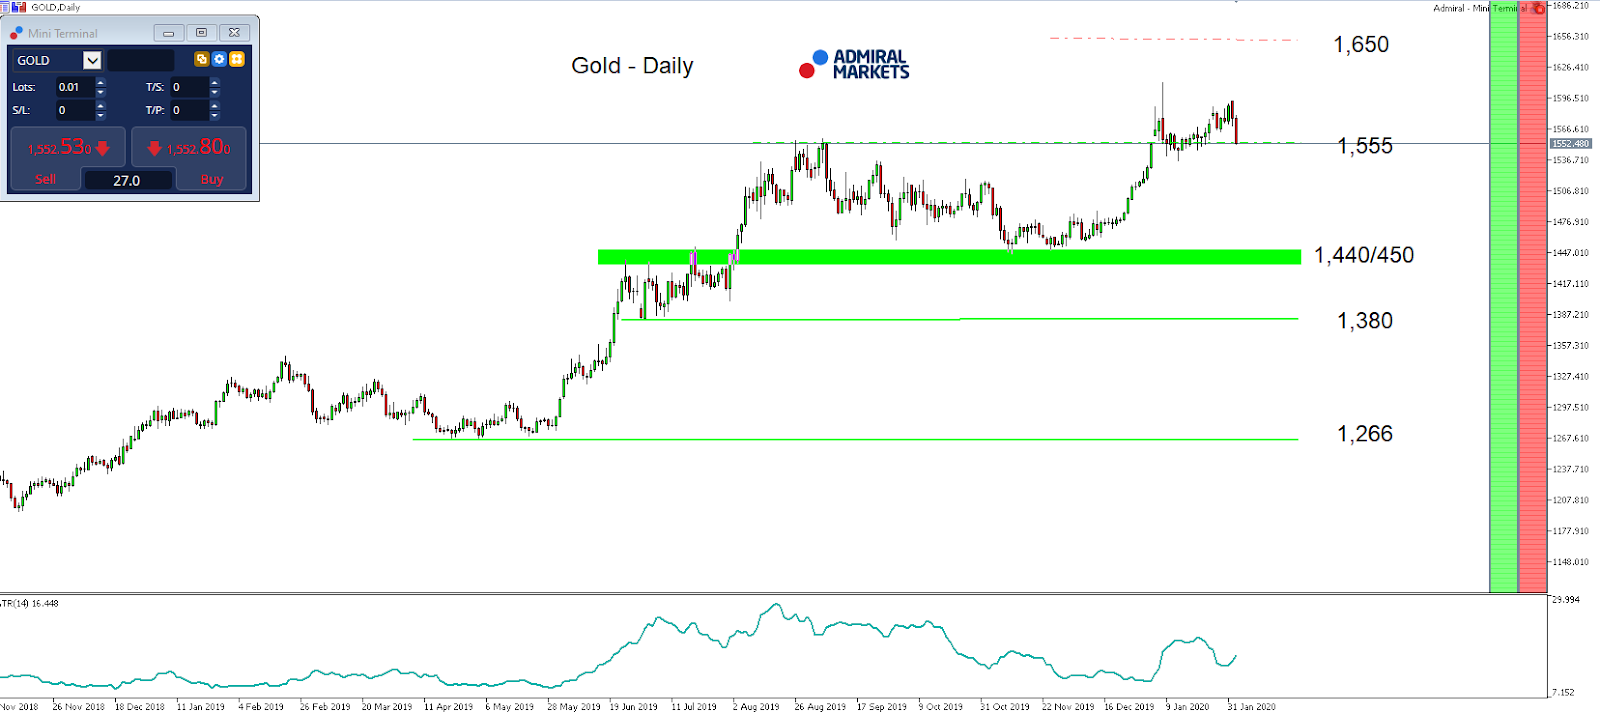
Gold showed a clear bullish tendency over the last week of trading, with clear attention being on the region around 1,555 USD, around 2019’s yearly highs.
The main driver certainly came from the latest news and developments concerning the Coronavirus, which resulted in a risk-off mode, driving US yields lower and thus Gold higher.
While the main question is how long these risk-off tendencies will last (based on a 2017 paper, economists calculated that the expected annual losses from pandemic risk could amount to ‘only’ about $500 billion (ca. 0.6% of global income) per year)), Gold still has other, still bullish drivers.
After the Fed rate decision didn’t deliver anything new last Wednesday, pressure on US yields diminished a little after ISM Manufacturing data jumped to 50.9 in January of 2020 from 47.8 in December, beating market forecasts of 48.5 and pointing to the first increase in factory activity in six months.
Still, the question is if today’s ADP Employment data set and ISM Non-Manufacturing can show similar tendencies. If they don’t and they come in below expectations, a drop in 10-year US Treasury yields below 1.5% could follow, levelling the path up to 1,600 USD in Gold again.
Such a push higher is also favoured from a technical perspective as long as we trade above 1,440/450 USD. The potential next target on the upside can then be found in the region around 1,650/700 USD.
A drop back below 1,550 USD would be short-term bearish, activating the region around 1,510/515 USD:
Source: Admiral Markets MT5 with MT5-SE Add-on Gold Daily chart (between November 2, 2018, to February 4, 2020). Accessed: February 4, 2020, at 10:00pm GMT – Please note: Past performance is not a reliable indicator of future results, or future performance.
In 2015, the value of Gold fell by 10.4%, in 2016, it increased by 8.1%, in 2017, it increased by 13.1%, in 2018, it fell by 1.6%, in 2019, it increased by 18.9%, meaning that after five years, it was up by 28%.
Discover the world’s #1 multi-asset platform
Admiral Markets offers professional traders the ability to trade with a custom, upgraded version of MetaTrader 5, allowing you to experience trading at a significantly higher, more rewarding level. Experience benefits such as the addition of the Market Heat Map, so you can compare various currency pairs to see which ones might be lucrative investments, access real-time trading data, and so much more. Click the banner below to start your FREE download of MT5 Supreme Edition!
Disclaimer: The given data provides additional information regarding all analysis, estimates, prognosis, forecasts or other similar assessments or information (hereinafter “Analysis”) published on the website of Admiral Markets. Before making any investment decisions please pay close attention to the following:
This is a marketing communication. The analysis is published for informative purposes only and are in no way to be construed as investment advice or recommendation. It has not been prepared in accordance with legal requirements designed to promote the independence of investment research, and that it is not subject to any prohibition on dealing ahead of the dissemination of investment research.
Any investment decision is made by each client alone whereas Admiral Markets shall not be responsible for any loss or damage arising from any such decision, whether or not based on the Analysis.
Each of the Analysis is prepared by an independent analyst (Jens Klatt, Professional Trader and Analyst, hereinafter “Author”) based on the Author’s personal estimations.
To ensure that the interests of the clients would be protected and objectivity of the Analysis would not be damaged Admiral Markets has established relevant internal procedures for prevention and management of conflicts of interest.
Whilst every reasonable effort is taken to ensure that all sources of the Analysis are reliable and that all information is presented, as much as possible, in an understandable, timely, precise and complete manner, Admiral Markets does not guarantee the accuracy or completeness of any information contained within the Analysis. The presented figures refer that refer to any past performance is not a reliable indicator of future results.
The contents of the Analysis should not be construed as an express or implied promise, guarantee or implication by Admiral Markets that the client shall profit from the strategies therein or that losses in connection therewith may or shall be limited.
Any kind of previous or modeled performance of financial instruments indicated within the Publication should not be construed as an express or implied promise, guarantee or implication by Admiral Markets for any future performance. The value of the financial instrument may both increase and decrease and the preservation of the asset value is not guaranteed.
The projections included in the Analysis may be subject to additional fees, taxes or other charges, depending on the subject of the Publication. The price list applicable to the services provided by Admiral Markets is publicly available from the website of Admiral Markets.
Leveraged products (including contracts for difference) are speculative in nature and may result in losses or profit. Before you start trading, you should make sure that you understand all the risks.
“On a long enough timeline, the survival rate for everyone [and everything] drops to zero.”
For better or for worse, that grim and almost cynical quote by the charismatic anarchist Tyler Durden of Fight Club is set to one day become an existential crisis for the non-renewable energy sector.
The jury is still out regarding how close we are to hitting Peak Oil or even whether abiotic oil is a real thing.
Granted, the sun and other renewable sources will someday share the same fate as their more ephemeral cousins and succumb to the second law of thermodynamics–only that we are talking about some seriously dizzying timelines measured in the billions, not tens or hundreds of years–hence the distinction.
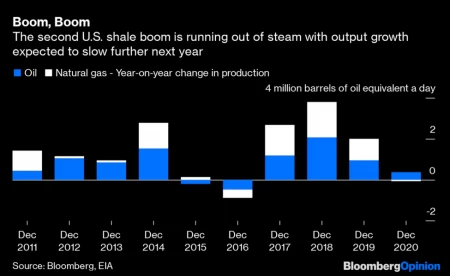
For the US shale industry, the future hangs in the balance. It’s now official: after a phenomenal decade-long run that has propelled the United States to the top of the oil producers’ league, America’s second shale boom is running out of gas.
According to the US Energy Information Administration, drilling in the Permian–easily the most prolific of the shale basins–declined 11% in the nine months to August. Output growth over the next year is expected to clock in at just 370,000 barrels a day–the slowest clip in four years. With oil prices remaining stubbornly low and no respite in sight, drillers in the shale patch are struggling and rig count has seen a steady decline.
The only thing supporting growth is a ‘fracklog’ of drilled but uncompleted (DUC) wells that are now coming online as shale producers like Apache Corp. focus more on well completion and less drilling under squeezed budgets.
The situation could get a lot more dire for the industry if Democratic presidential front-runners senators Bernie Sanders and Elizabeth Warren have their way and ban fracking after ascending to the Oval Office.
That’s decidedly gloomy.
But what’s the outlook for other parts of the globe?
Texas-based Permian and Eagle Ford might boast the most street cred of any shale plays, anywhere on the planet.
However, there are other regions that are pretty well endowed. Not only are they ready and willing to seize the moment, but they’re positioned to be the next major shale boom venues.
#1 Argentina’s Vaca Muerta
Vaca Muerta might mean ‘dead cow’ in Spanish; however, Argentina’s prized gem might soon become one of its leading cash cows instead.
Located on an arid steppe nestled against the Andes mountains along the western edge of Patagonia, Vaca Muerta is a continuous tight oil and shale gas reservoir that’s reputed to be one of the largest of its kind. The 30,000 square kilometers (12,000 sq mi.) patch of land consisting of lime mudstones, black shale and marl and is estimated to hold approximately 16.2 billion barrels of oil and 308 trillion cubic feet of natural gas as per the EIA. The shale is found at a depth of about 9,500 feet (2,900 m).
In comparison, the Permian Shale contains 20 billion barrels of oil and 16 Tcf of associated natural gas.
Unfortunately, Vaca Muerta has little to show for its vast riches with proper production yet to commence a century since oil was first discovered there by American geologist Charles E. Weaver–thanks to the region’s checkered history.
Over the past eight years, Chevron and YPF SA, the local oil giant, Royal Dutch Shell and Total have sunk between them $13 billion into exploration into this unconventional play. No company though had much to show for its efforts with obstacles popping up everywhere and production marginal.
That’s until this year when two companies managed to export light oil and liquefied natural gas in what the country’s officials said foreshadows a steady flow of shipments by year-end. Unfortunately, that too looks unlikely after the Argentina Energy Secretariat once again extended the deadline for bidding for a project to build a 1,000 km pipeline to carry gas from the giant formation.
With the Argentinian economy so weak, it could be years or maybe even decades before Vaca Muerta can rival US Permian Shale but make no mistake about it, the country appears dead-set at making this a reality. And Chevron, Shell and Total are likely to see their massive investments begin to pay off when it the region begins to turn around.
#2 Kavango Basin, Namibia
And if Karoo is a shale windfall, Kavango is its likely extension, according to geologists.
The Kavango Basin has the same Karoo geology, and it’s also been shown to have the same depositional environment as Shell’s Whitehill Permian shale play, part of the Karoo Supergroup in South Africa.
The 6.3-million-acre (25,000 square kilometers) Kavango Basin is similar in size to the Eagle Ford basin.
And right now, a 90% interest in the exploration license for the entire basin is owned by one small-cap explorer: Recon Energy Africa (TSX.V: RECO, OTCMKTS:LGDOF), with a market cap of only $40 million and shares selling for under $0.80.
It’s pretty unique for a company this small to have a basin this big, but while few have heard of the company, everyone in the business has heard of the geophysicist who examined the data on this basin. They’ve also heard of Recon’s CEO, Jay Park QC—the former director of Caracal Energy, which was acquired by giant Glencore in 2014 for $1.3 billion.
Bill Cathey is the geophysicist to some majors. When Recon brought the magnetic survey data from Namibia’s Kavango Basin to Cathey, Cathey said the data showed a 30,000-foot sedimentary basin. He also said that a basin this deep, everywhere else in the world, produces commercial hydrocarbons. Management of Recon dropped everything, so the story goes, got on a plane, and finalized the deal for an exploration permit for the petroleum and natural gas rights to the giant Kavango Basin.
So, now, tiny Recon (TSX.V: RECO, OTCMKTS:LGDOF) is sitting on a basin that’s the same size as the Eagle Ford.
Recon has a 4-year exploration license leading to a 25-year production license starting when it has made a commercial discovery.
Sproule–a tier 1 resource assessment company–estimated that Kavango has a potential 12 billion barrels of oil or 119 trillion cubic feet of natural gas. That’s for the shale and doesn’t count any conventional potential.
The first test wells are slated to be drilled in Q2 2020.
That’s just a few months away.
Namibia is one of the most oil-friendly up-and-coming oil venues in the frontier of Africa. Ask Shell, or Exxon, both of whom are acquiring assets there.
Shell (NYSE:RDS.A), for its part, is a veteran in the African oil and gas game. The company began drilling in the region in the 1950s, and now has assets in over 20 countries across the continent. Though it has sold off a number of assets in the region in recent years due to unfavorable regimes, it continues to maintain a strong presence in South Africa and Namibia.
Exxon (NYSE:XOM), on the other hand, is relatively new, but quickly upping its stake. The company has already added over 7 million acres in four additional deepwater blocks just this year. What Exxon’s banking on is that Namibia, which according to theory once fit together with Brazil, shares the same geology as Brazil’s pre-salt basins, Santos and Campos, which have already proved resource-rich, according to Deloitte.
Whether it’s Namibia, Argentina or South Africa, what we do know is that the U.S. has already had its shale boom, and the next multi-million-dollar oil play is probably going to come from somewhere else.
#3 Karoo, South Africa
The Karoo is a vast sedimentary basin covering more than 600,000 square kilometers in central and southern South Africa.
Although the sheep- and ostrich-dotted expanse is better known for its arid beauty and aching poverty, it could hold untold riches underneath the surface in the form of natural gas. Former South African governments placed restrictions that made Karoo out of reach for foreign companies. However, President Zuma’s government lifted the shale fracking ban in 2012 thus opening up 485 Tcf of gas reserves for drilling.
If the EIA estimates are accurate, the Karoo shale gas fields would qualify as the fifth largest in the world. The gas extracted could power the entire country for a good 400 years and create thousands of much-needed jobs.
The South African Journal of Science has, however, disputed the EIA reserve estimates saying that actual shale gas deposits are only 13 Tcf thus ranking the country 34th out of 46 nations in EIA estimates.
Although local farmers and environmentalists are opposed to any fracking activity in Karoo, three foreign companies-Falcon Oil, Royal Dutch Shell and Sunset Energy–have already been granted licenses to explore for gas in the basin.
Bonus: Big Oil Diving Into Uncharted Waters
Though there are a number of exciting hotspots popping up across the globe, it’s also important to pay attention to oil companies taking big risks on little-known exploratory projects.
Take Total (TOT), for example. It recently announced a major oil discovery offshore Suriname with its partner, Apache (APA). Apache’s agreement with Total included $100 million upfront payment and expenses incurred in exploration. The find was a major boon for both Total and Apache, especially considering there had not previously made any commercially viable oil discoveries. The find is doubly beneficial for Suriname, which could be a significant turning point for the small country’s economy.
Though it’s not entirely off the beaten path, Egypt has also captured the attention of Big Oil in recent years. Just last month, in fact, the country awarded Chevron (NYSE:CVX) and Shell key exploration blocks in the red-hot Red Sea. The blocks cover a total area of around 10,000 sq km and carry combined minimum investment of $326 million, Egypt’s petroleum ministry said, adding that potential investment would rise to “several billion dollars” if discoveries were made.
By. Joao Piexe
**IMPORTANT! BY READING OUR CONTENT YOU EXPLICITLY AGREE TO THE FOLLOWING. PLEASE READ CAREFULLY**
Forward-Looking Statements. Statements contained in this document that are not historical facts are forward-looking statements that involve various risks and uncertainty affecting the business of Recon. All estimates and statements with respect to Recon’s operations, its plans and projections, oil prices, recoverable oil, production targets, production and other operating costs and likelihood of oil recoverability are forward-looking statements under applicable securities laws and necessarily involve risks and uncertainties including, without limitation: risks associated with oil and gas exploration, development, exploitation and production, geological risks, marketing and transportation, availability of adequate funding, volatility of commodity prices, imprecision of reserve and resource estimates, environmental risks, competition from other producers, government regulation, dates of commencement of production and changes in the regulatory and taxation environment. Actual results may vary materially from the information provided in this document, and there is no representation that the actual results realized in the future will be the same in whole or in part as those presented herein. Other factors that could cause actual results to differ from those contained in the forward-looking statements are also set forth in filings that Recon and its technical analysts have made, We undertake no obligation, except as otherwise required by law, to update these forward-looking statements except as required by law.
Exploration for hydrocarbons is a speculative venture necessarily involving substantial risk. Recon’s future success will depend on its ability to develop its current properties and on its ability to discover resources that are capable of commercial production. However, there is no assurance that Recon’s future exploration and development efforts will result in the discovery or development of commercial accumulations of oil and natural gas. In addition, even if hydrocarbons are discovered, the costs of extracting and delivering the hydrocarbons to market and variations in the market price may render uneconomic any discovered deposit. Geological conditions are variable and unpredictable. Even if production is commenced from a well, the quantity of hydrocarbons produced inevitably will decline over time, and production may be adversely affected or may have to be terminated altogether if Recon encounters unforeseen geological conditions. Adverse climatic conditions at such properties may also hinder Recon’s ability to carry on exploration or production activities continuously throughout any given year.
DISCLAIMERS
ADVERTISEMENT. This communication is not a recommendation to buy or sell securities. Oilprice.com, Advanced Media Solutions Ltd, and their owners, managers, employees, and assigns (collectively “the Company”) may in the future be paid by Recon to disseminate future communications if this communication proves effective. In this case the Company has not been paid for this article. But the potential for future compensation is a major conflict with our ability to be unbiased, more specifically:
This communication is for entertainment purposes only. Never invest purely based on our communication. We have not been compensated but may in the future be compensated to conduct investor awareness advertising and marketing for TSXV:RECO. Therefore, this communication should be viewed as a commercial advertisement only. We have not investigated the background of the company. Frequently companies profiled in our alerts experience a large increase in volume and share price during the course of investor awareness marketing, which often end as soon as the investor awareness marketing ceases. The information in our communications and on our website has not been independently verified and is not guaranteed to be correct.
SHARE OWNERSHIP. The owner of Oilprice.com owns shares of this featured company and therefore has an additional incentive to see the featured company’s stock perform well. The owner of Oilprice.com will not notify the market when it decides to buy more or sell shares of this issuer in the market. The owner of Oilprice.com will be buying and selling shares of this issuer for its own profit. This is why we stress that you conduct extensive due diligence as well as seek the advice of your financial advisor or a registered broker-dealer before investing in any securities.
NOT AN INVESTMENT ADVISOR. The Company is not registered or licensed by any governing body in any jurisdiction to give investing advice or provide investment recommendations. ALWAYS DO YOUR OWN RESEARCH and consult with a licensed investment professional before making an investment. This communication should not be used as a basis for making any investment.
PAST PERFORMANCE IS NOT INDICATIVE OF FUTURE RESULTS. Investing is inherently risky. Don’t trade with money you can’t afford to lose. This is neither a solicitation nor an offer to Buy/Sell securities. No representation is being made that any account will or is likely to achieve profits similar to those discussed.
Asian stocks are building on Tuesday’s gains, taking their cues from Wall Street overnight, as the former attempts some form of recovery after Monday’s selloff. Most Asian currencies however are weakening against the US Dollar, while Gold is stabilising around the mid-$1500 region.
The rebound currently seen in equities may be on feeble footing, as the coronavirus outbreak casts a wider net, with the death toll now approaching 500, while confirmed cases have exceeded 24,000. Once the US earnings season is over, the support for global equities could be eroded, as investors focus primarily on the coronavirus outbreak and its impact on the fragile global economic recovery. The near-term demand for safe haven assets is expected to remain elevated, while assets across the emerging-markets complex are expected to remain susceptible to further bouts of risk aversion.
China PMI still expanding at onset of coronavirus outbreak
China’s just-released Caixin PMI figures indicate that key sectors of the world’s second largest economy remained in expansionary territory in January, although it marked a deceleration from December’s figures. The economic data will continue to be in keen focus over the coming months, leading up to April’s Q1 GDP reading for the Chinese economy, as investors attempt to ascertain the fallout from the coronavirus outbreak. Still, as evidenced by recent measures, policymakers have enough buffers and willingness to support the economy if the need arises, which should also help mitigate the downside risks from the coronavirus outbreak.
Dollar to snub political risks, focus on hard data
The Dollar index edged higher during US President Donald Trump’s State of the Union address, crossing above the psychological 98.0 level. Still, neither the speech, nor the impeachment proceedings, are expected to have a meaningful effect on markets for the time being, as investors have bigger and more pressing factors to contend with. US assets’ inclination to react to domestic political events and risks should only grow as we draw closer to the November presidential elections.
In the interim, the Greenback remains exposed to overall global risk sentiment, the Fed’s policy bias, and the economic data. The US Dollar has defied expectations for a moderating performance so far this year, aided by the risk aversion stemming from unforeseen events, such as the ongoing coronavirus outbreak. Having been buoyed by the positive surprise in the January ISM Manufacturing print earlier this week, Dollar bulls will be keeping their eyes on the January non-farm payrolls due Friday as the Dollar’s next major catalyst. Markets are currently expecting a print of 162,000 new jobs added last month. Should the US economy demonstrate that it has a solid enough foundation to potentially offset the downside risk stemming from the coronavirus outbreak, that could buffer the DXY’s presence above the 98.0 line.
Disclaimer: The content in this article comprises personal opinions and should not be construed as containing personal and/or other investment advice and/or an offer of and/or solicitation for any transactions in financial instruments and/or a guarantee and/or prediction of future performance. ForexTime (FXTM), its affiliates, agents, directors, officers or employees do not guarantee the accuracy, validity, timeliness or completeness, of any information or data made available and assume no liability as to any loss arising from any investment based on the same.
Insmed Inc.’s shares traded higher today after the company reported positive top-line results from its Phase 2 WILLOW Study of INS1007 in patients with non-cystic fibrosis bronchiectasis.
Global biopharmaceutical company Insmed Inc. (INSM:NASDAQ), which is focused on treatment of serious and rare diseases, today announced positive top-line results from its Phase 2 WILLOW study evaluating the safety and efficacy of INS1007, an oral, selective, reversible inhibitor of dipeptidyl peptidase 1 (DPP1), in adults with non-cystic fibrosis bronchiectasis (NCFBE).
The company reported that in the WILLOW study, INS1007 achieved its primary endpoint of time to first pulmonary exacerbation and in addition, met a key secondary endpoint, a reduction in the frequency of pulmonary exacerbations. The firm indicated that INS1007 was also generally well-tolerated in the study.
Lead study investigator James Chalmers, MBChB, Ph.D., professor and consultant respiratory physician at the School of Medicine, University of Dundee, UK, commented, “These results are incredibly encouraging and highlight the potentially important role INS1007 may play in the management of bronchiectasis…many bronchiectasis patients suffer from persistent symptoms and frequent exacerbations with no pharmaceutical therapies available that are approved to help them manage this disease. There is an urgent need for approved, effective therapies that can break the vicious cycle of inflammation, lung damage, and infection for these patients.”
The company’s Chief Medical Officer Martina Flammer, M.D., MBA, remarked, “This molecule represents a novel, potentially first-in-class mechanism that utilizes an anti-inflammatory approach to treat the debilitating cycle of inflammation, infection, and lung damage associated with NCFBE…Importantly, in addition to achieving the primary and a key secondary endpoint, we saw significant reductions in sputum neutrophil elastase, an important biomarker that reflects the mechanism of action of INS1007. These data provide a strong rationale for continued development in this disease and potentially other neutrophil-driven inflammatory conditions. We look forward to further analyzing the data and discussing next steps with regulatory authorities.”
Insmed’s Chairman and CEO Will Lewis added, “The entire Insmed team is elated by the positive results observed in this study. This is a day of incredible promise for the hundreds of thousands of patients around the world who currently suffer from NCFBE. We believe these results further validate both our business and clinical development capabilities…With INS1007, Insmed has a unique and significant opportunity with a potential first-in-class therapy for NCFBE. There are currently no approved therapies specifically targeting this severe and chronic pulmonary disease in the U.S., Europe, or Japan.”
The company explained that NCFBE is a severe, chronic pulmonary disorder that affects approximately 340,000 to 520,000 patients in U.S. In NCFBE, a condition marked by frequent pulmonary exacerbations requiring antibiotic therapy and often hospitalizations, the bronchi become permanently dilated due to a cycle of infection, inflammation, and lung tissue damage.
Insmed is a global biopharmaceutical company headquartered in Bridgewater, N.J., that specializes in the treatment of serious and rare diseases. In addition to INS1007 for use in the treatment of NCFBE, the firm noted that “its first commercial product, ARIKAYCE® (amikacin liposome inhalation suspension), is the first and only therapy approved in the U.S. for the treatment of refractory Mycobacterium avium complex (MAC) lung disease as part of a combination antibacterial drug regimen for adult patients with limited or no alternative treatment options.”
Insmed started off the days with a market capitalization of around $1.8 billion with approximately 89.34 million shares outstanding and a short interest of about 14.50%. INSM shares opened more than 45% higher today at $30.085 (+$9.545, +46.47%) over Friday’s $20.54 closing price. The stock has traded today between $27.02 and $30.44 per share today and is currently trading at $29.18 (+$8.65, +42.04%).
Disclosure: 1) Stephen Hytha compiled this article for Streetwise Reports LLC and provides services to Streetwise Reports as an independent contractor. He or members of his household own securities of the following companies mentioned in the article: None. He or members of his household are paid by the following companies mentioned in this article: None. 2) The following companies mentioned in this article are billboard sponsors of Streetwise Reports: None. Click here for important disclosures about sponsor fees. 3) Comments and opinions expressed are those of the specific experts and not of Streetwise Reports or its officers. The information provided above is for informational purposes only and is not a recommendation to buy or sell any security. 4) The article does not constitute investment advice. Each reader is encouraged to consult with his or her individual financial professional and any action a reader takes as a result of information presented here is his or her own responsibility. By opening this page, each reader accepts and agrees to Streetwise Reports’ terms of use and full legal disclaimer. This article is not a solicitation for investment. Streetwise Reports does not render general or specific investment advice and the information on Streetwise Reports should not be considered a recommendation to buy or sell any security. Streetwise Reports does not endorse or recommend the business, products, services or securities of any company mentioned on Streetwise Reports. 5) From time to time, Streetwise Reports LLC and its directors, officers, employees or members of their families, as well as persons interviewed for articles and interviews on the site, may have a long or short position in securities mentioned. Directors, officers, employees or members of their immediate families are prohibited from making purchases and/or sales of those securities in the open market or otherwise from the time of the interview or the decision to write an article until three business days after the publication of the interview or article. The foregoing prohibition does not apply to articles that in substance only restate previously published company releases. 6) This article does not constitute medical advice. Officers, employees and contributors to Streetwise Reports are not licensed medical professionals. Readers should always contact their healthcare professionals for medical advice.
Bob Moriarty of 321gold discusses the path he would like the company to take as it plans to bring a historical gold and silver mine into production.
Prime Mining Corp. (PRYM:TSX.V) has picked up an existing gold mine in Sinaloa, Mexico with a production history going to the 18th Century. Guadalupe de los Reyes is estimated to have produced 500,000 to 600,000 ounces of gold and 40 million ounces of silver. Prime is buying the project for $6 million and a 1% NSR. The 6300 square km property comes with a 43-101 resource of 535,000 ounces of gold and over 10 million ounces of silver. To date only 40% of the project has been explored.
When I talked to management at Prime they told me of their plans for going into production on a small scale within two years at a low capital expense. I’m hoping they change their minds. Their plan calls for a low cost heap leach with production of somewhere in the 60,000 to 70,000 ounce per year range.
The project was bought from Vista Gold who spent in excess of $20 million on exploration. It lies in a nest of half a dozen other similar mines in the area including Minera Alamos, First Majestic, McEwen Mining and Chesapeake.
Mining companies love heap leach systems because they are cheap to set up and mine. While the recovery leaves something to be desired, the low capex can turn a low-grade mine, well, into a gold mine. But heap leach is suitable only for low-grade ore. Some of the material Prime is reporting is out of the range for a heap leach.
Here’s why.
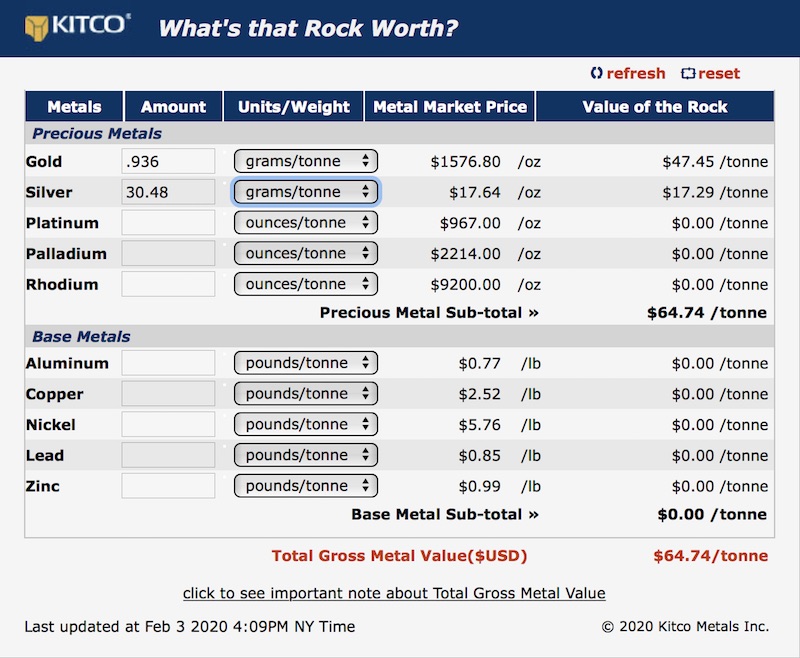
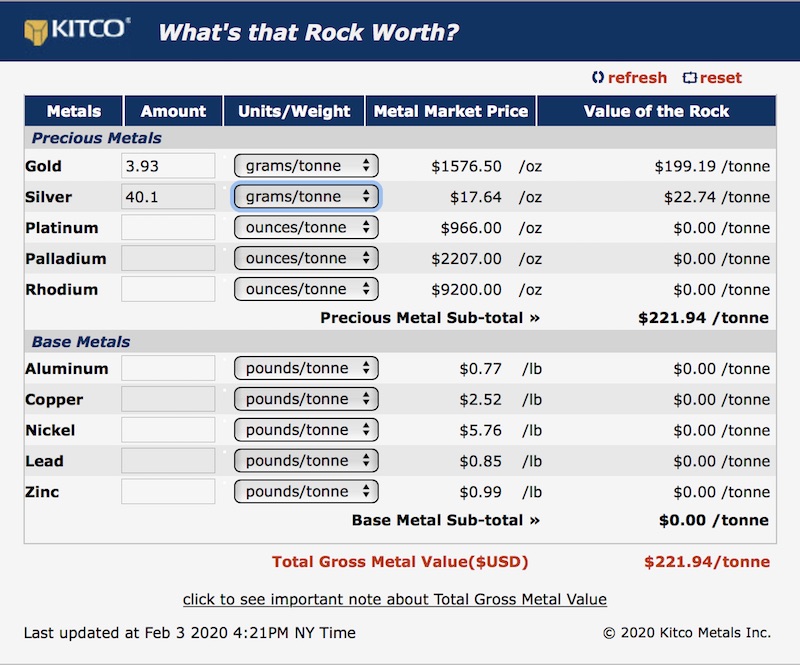
In their presentation Prime talks about “potential” to optimize gold recovery to over 76% and silver to over 24%. In their recent press release they give numbers for surface samples. One of the best, from Zapote Central showed 30 meters of 3.93 g/t gold and 40.1 g/t Ag. If you assume (and notice that the word makes an ass out of U and me) they manage to accomplish their potential to optimize gold and silver recovery. If you take 24% of 3.93 and 76% of 40.1 grams of silver, by their own numbers they are leaving 0.935 g/t Au and 30.48 g/t Ag on the heap leach pad due to the inefficiency of heap leach pads. That’s $65 rock and anyone in Mexico would love to start off with metal values that high.
In short, heap leach pads are cheap but when you have higher grade ore as Prime seems to be finding, you lose a lot of money by not building a mill. Heap leach pads are great for $50 rock. I’ve seen mines that had all in costs of under $8 a ton. But when you start off with $222 a ton rock, it pretty much demands you build a mill even if it costs more.
There is another even more practical reason for changing the plan that management is now contemplating. Their current business plan calls for production of 60,00070,000 ounces of gold a year by 2022. But in this market investors just don’t give a damn or a cent for anyone producing under the magic number of 100,000 ounces a year. It’s like selling diamonds. A 1.00 carat stone is worth 2550% more than a 0.98 carat stone even if you can’t possibly see any difference. Investors demand 100,000 ounces a year. You either give it to them or you pay a giant premium for not delivering what the market wants to see.
If it were me, I would make the priority to increase the resource by 50100% and build a mill with much better recovery rates than the 76% for gold and 24% for silver. This market demands a certain business model and from what I was told, management I think is going down the wrong path. They should either do it right or not do it at all. They bought the project at a great price. They have cash in the bank and are releasing a current up to date 43-101 shortly. At today’s price of the shares, the company is only getting $30 an ounce for resources in USD. Their peers who surround them are doing a lot better than that.
This is a new deal only put together in the last six months. Management is just now getting their feet on the ground. But their silver resource alone would justify the entire market cap. They have money and times are improving for the junior sector.
Prime is an advertiser. I have bought shares in their coming out private placement so naturally I am biased. Please do your own due diligence.
Prime Mining PRYM-V $0.43 (Feb 04, 2020) PRMNF-OTCQB 59.1 million shares Prime Mining Website.
Bob Moriarty founded 321gold.com, with his late wife, Barbara Moriarty, more than 16 years ago. They later added 321energy.com to cover oil, natural gas, gasoline, coal, solar, wind and nuclear energy. Both sites feature articles, editorial opinions, pricing figures and updates on current events affecting both sectors. Previously, Moriarty was a Marine F-4B and O-1 pilot with more than 832 missions in Vietnam. He holds 14 international aviation records.
Disclosure: 1) Bob Moriarty: I, or members of my immediate household or family, own shares of the following companies mentioned in this article: Prime Mining. My company has a financial relationship with the following companies mentioned in this article: Prime Mining is an advertiser on 321 Gold. I determined which companies would be included in this article based on my research and understanding of the sector. 2) The following companies mentioned are billboard sponsors of Streetwise Reports: None. Click here for important disclosures about sponsor fees. 3) Statements and opinions expressed are the opinions of the author and not of Streetwise Reports or its officers. The author is wholly responsible for the validity of the statements. The author was not paid by Streetwise Reports for this article. Streetwise Reports was not paid by the author to publish or syndicate this article. The information provided above is for informational purposes only and is not a recommendation to buy or sell any security. Streetwise Reports requires contributing authors to disclose any shareholdings in, or economic relationships with, companies that they write about. Streetwise Reports relies upon the authors to accurately provide this information and Streetwise Reports has no means of verifying its accuracy. 4) The article does not constitute investment advice. Each reader is encouraged to consult with his or her individual financial professional and any action a reader takes as a result of information presented here is his or her own responsibility. By opening this page, each reader accepts and agrees to Streetwise Reports’ terms of use and full legal disclaimer. This article is not a solicitation for investment. Streetwise Reports does not render general or specific investment advice and the information on Streetwise Reports should not be considered a recommendation to buy or sell any security. Streetwise Reports does not endorse or recommend the business, products, services or securities of any company mentioned on Streetwise Reports. 5) From time to time, Streetwise Reports LLC and its directors, officers, employees or members of their families, as well as persons interviewed for articles and interviews on the site, may have a long or short position in securities mentioned. Directors, officers, employees or members of their immediate families are prohibited from making purchases and/or sales of those securities in the open market or otherwise from the time of the interview or the decision to write an article until three business days after the publication of the interview or article. The foregoing prohibition does not apply to articles that in substance only restate previously published company releases.