It’s been another volatile session for gold prices this week. Following a gap higher at the start of the week, gold prices underwent a sharp reversal into the middle of the week which saw price trading lower to end the week in the red, as of writing.
The initial strength in gold prices this week was as a result of increased safe-haven inflows in response to the worsening spread of the coronavirus. The virus has now claimed the lives of nearly 600 people. This includes two outside of China where the spread has increased to over 26 countries globally.
Rising investor uncertainty had been favoring a flight to safety among investors, supporting gold. However, mid-week we saw a shift in response to reports from Sky News. They reported that Chinese researchers were close to finding a vaccine for the infection. These reports fuelled a sharp relief rally in risk assets, weighing on gold. While the WHO has downplayed hopes of finding a cure so early on, it seems that the market remains hopeful given the continued rally in equities which is keeping gold weighed on Friday.
Technical Perspective
Despite the sell-off this week, gold prices are still holding above the 1554.69 level for now. While above here, a further push higher within the bullish channel is still on course, eyeing an eventual break above the 1608.54 level. The only real downside risk at the moment is any breakthrough in containing the Chinese flu outbreak. Such an announcement could fuel a sharp reversal in gold. To the downside, any break of the 2019 highs would bring the 1522.75 level back into focus. 1571 is the weekly open.
Silver
Silver prices have been lower this week also. Along with the optimism around a potential cure for coronavirus. The market has also responded positively to news that Donald Trump has not been found guilty by the Senate during his impeachment trial. Consequently, Trump will retain his role as president and will now press ahead with his re-election campaign, which he is currently favored to win. The US dollar has also been stronger in the wake of Trump’s acquittal, further weighing on metals, keeping silver prices anchored into the end of the week.
Technical Perspective
Silver prices continue to range between the 17.3408–18.6397 level, caught between the two bearish trend lines. The downside action in silver this week was limited, with price staying within the range of the prior week. While price is still holding above the 17.3408 level, a further test of the 18.6397 level is still viable. To the downside, a break of 17.3408 would pave the way for a test of the 16.52 level next.
Euro continues to lose ground against USD. EUR/USD quotes have set new local lows. At the moment the trading instrument is consolidating in the range 1.09650-1.09900. Investors took a wait-and-see approach until the publication of the US labor market report for January. Experts predict improvements in the key indicators. We recommend you to pay attention to the difference between actual and forecast values of the indicators. Positions should be opened from key levels.
At 15:30 (GMT+2:00) the US labor statistics will be published.
The indicators signal the sellers’ strength: the price has fixed below 50 MA and 100 MA.
MACD histogram is in the negative zone, but above the signal line, which gives a weak signal to sell EUR/USD.
The Stochastic Oscillator is in the neutral zone, the %K line is below the %D line, which indicates that the sentiment is bearish.
Trading recommendations
Support levels: 1.09650, 1.09200, 1.09000
Resistance levels: 1.09900, 1.10100, 1.10300
If the price fixes below 1.09650, expect further decline toward 1.09000.
Alternatively, the quotes could grow toward 1.10200-1.10400.
The GBP/USD currency pair
Technical indicators of the currency pair:
Prev Open: 1.29994
Open: 1.29261
% chg. over the last day: -0.55
Day’s range: 1.29248 – 1.29463
52 wk range: 1.1959 – 1.3516
Bearish sentiment prevails on GBP/USD currency pair. During yesterday’s trading the drop in quotations exceeded 70 points. Sterling has updated the local lows. At the moment GBP/USD quotes are consolidated in the range of 1.29200-1.29600. The technical picture signals a further decline in the trading instrument. We recommend you to pay attention to the US economic releases. Positions should be opened from key levels.
The news background on the UK economy is quite calm.
The price is fixed below 50 MA and 100 MA, which signals the strength of the sellers.
The MACD histogram is in the negative zone, which indicates a bearish sentiment.
The Stochastic Oscillator is in the neutral zone, the %K line started crossing the %D line. There are no signals at the moment.
Trading recommendations
Support levels: 1.29200, 1.28700
Resistance levels: 1.29600, 1.30100, 1.30450
If the price fixes below 1.29200, expect the quotes to fall toward 1.28800-1.28600.
Alternatively, the quotes could grow toward 1.30000-1.30300.
The USD/CAD currency pair
Technical indicators of the currency pair:
Prev Open: 1.32821
Open: 1.32840
% chg. over the last day: +0.01
Day’s range: 1.32824 – 1.32960
52 wk range: 1.2949 – 1.3566
USD/CAD is still moving sideways. There is no defined trend. Investors are waiting for additional drivers. Local support and resistance levels are at 1.32650 and 1.33000 respectively. We expect the release of statistical data on the labor market in Canada and USA. We also recommend you to pay attention to the dynamics of oil prices. Positions should be opened from key levels.
At 15:30 (GMT+2:00) the Canadian labor market report will be published.
Indicators do not give accurate signals: the price is consolidating near 50 MA and 100 MA.
MACD histogram is near the 0 mark.
The Stochastic Oscillator is located in the neutral zone, the %K line is above the %D line, which indicates a bullish sentiment.
Trading recommendations
Support levels: 1.32650, 1.32450, 1.32200
Resistance levels: 1.33000, 1.33400
If the price fixes above 1.33000, expect further growth toward 1.33400-1.33600.
Alternatively, the quotes could correct toward 1.32300-1.32100.
The USD/JPY currency pair
Technical indicators of the currency pair:
Prev Open: 109.817
Open: 109.986
% chg. over the last day: +0.14
Day’s range: 109.813 – 110.018
52 wk range: 104.45 – 113.53
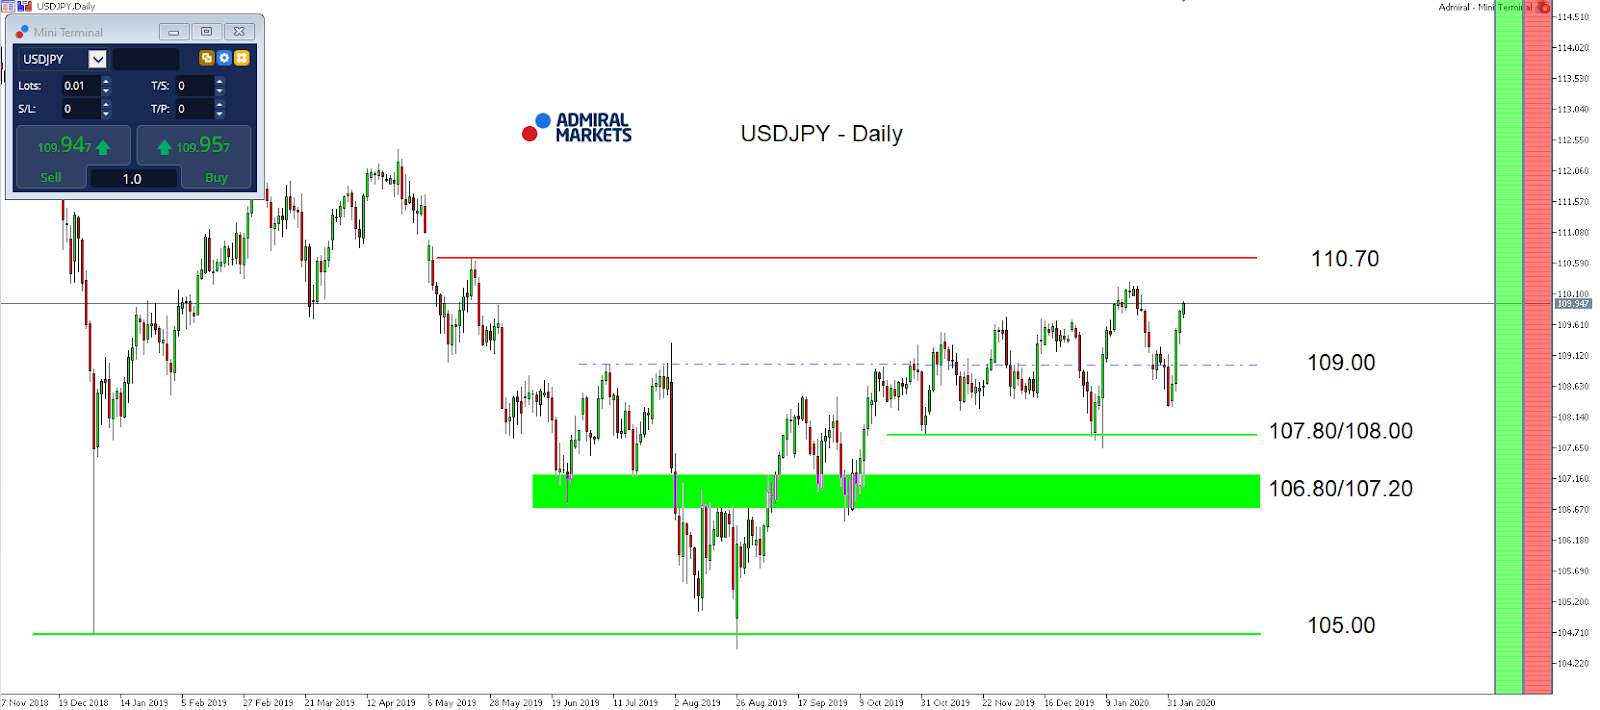
The USD/JPY currency pair has stabilized after a significant growth since the beginning of this week. At the moment the trading instrument is consolidating. Local support and resistance levels are at 109.700 and 110.000 respectively. The US labor market report for January is in the focus of attention. We also recommend you to pay attention to the US government securities yield dynamics. Positions should be opened from key levels.
The news background on the Japanese economy is quite calm.
The indicators signal the strength of buyers: the price has fixed above 50 MA and 100 MA.
MACD histogram is close to the 0 mark. There are no accurate signals at the moment.
The Stochastic Oscillator is located in the neutral zone, the %K line is above the %D line, which indicates a bullish sentiment.
Trading recommendations
Support levels: 109.700, 109.550, 109.300
Resistance levels: 110.00, 110.250
If the price fixes above 110.000, expect further growth toward 110.250-110.500.
Alternatively, the quotes could descend toward 109.400-109.200.
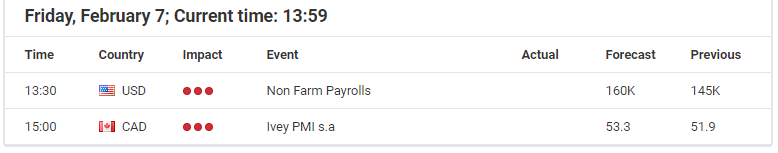
It’s the first Friday of the month, so forex traders, particularly of the USD/JPY, will watch for the release of the Non-Farm Payrolls with excitement.
This is particularly true after the strong ADP data set last Wednesday, which is usually positively correlated with, and a good indicator of, the NFPs. Here, private businesses in the US hired 291,000 workers in January 2020, the most since May 2015, handily beating market expectations of a 156,000.
With that in mind, today’s NFPs have a solid chance to also beat expectations, and add further fuel to the strong performance of the USD/JPY over the last few days, after the currency pair failed to sustainably break below 108.00.
While the overall technical mode in the USD/JPY stays neutral and choppy, a push above 110.00 brings the region around 110.70 into our focus again, and could potentially be traded on the shorter time-frames.
Still, we remain cautious as to long engagement in the USD/JPY. Because despite solid US economic data over the last few days, expectations among market participants point to the Fed cutting rates by a minimum of 25 basis points in 2020, with a likelihood of around 80% (according to the Fed Watch Tool as of last Thursday).
With that in mind, we think that any bullish moves in the US dollar may be short-lived, and should be cautiously reviewed.
Source: Admiral Markets MT5 with MT5-SE Add-on USD/JPY Daily chart (between November 27, 2018, to February 7, 2020). Accessed: February 7, 2020, at 10:00pm GMT – Please note: Past performance is not a reliable indicator of future results, or future performance.
In 2015, the value of USD/JPY increased by 0.5%, in 2016, it fell by 2.8%, in 2017, it fell by 3.6%, in 2018, it fell by 2.7%, in 2019, it fell by 0.85%, meaning that after five years, it was down by 9.2%.
Discover the world’s #1 multi-asset platform
Admiral Markets offers professional traders the ability to trade with a custom, upgraded version of MetaTrader 5, allowing you to experience trading at a significantly higher, more rewarding level. Experience benefits such as the addition of the Market Heat Map, so you can compare various currency pairs to see which ones might be lucrative investments, access real-time trading data, and so much more. Click the banner below to start your FREE download of MT5 Supreme Edition!
Disclaimer: The given data provides additional information regarding all analysis, estimates, prognosis, forecasts or other similar assessments or information (hereinafter “Analysis”) published on the website of Admiral Markets. Before making any investment decisions please pay close attention to the following:
This is a marketing communication. The analysis is published for informative purposes only and are in no way to be construed as investment advice or recommendation. It has not been prepared in accordance with legal requirements designed to promote the independence of investment research, and that it is not subject to any prohibition on dealing ahead of the dissemination of investment research.
Any investment decision is made by each client alone whereas Admiral Markets shall not be responsible for any loss or damage arising from any such decision, whether or not based on the Analysis.
Each of the Analysis is prepared by an independent analyst (Jens Klatt, Professional Trader and Analyst, hereinafter “Author”) based on the Author’s personal estimations.
To ensure that the interests of the clients would be protected and objectivity of the Analysis would not be damaged Admiral Markets has established relevant internal procedures for prevention and management of conflicts of interest.
Whilst every reasonable effort is taken to ensure that all sources of the Analysis are reliable and that all information is presented, as much as possible, in an understandable, timely, precise and complete manner, Admiral Markets does not guarantee the accuracy or completeness of any information contained within the Analysis. The presented figures refer that refer to any past performance is not a reliable indicator of future results.
The contents of the Analysis should not be construed as an express or implied promise, guarantee or implication by Admiral Markets that the client shall profit from the strategies therein or that losses in connection therewith may or shall be limited.
Any kind of previous or modeled performance of financial instruments indicated within the Publication should not be construed as an express or implied promise, guarantee or implication by Admiral Markets for any future performance. The value of the financial instrument may both increase and decrease and the preservation of the asset value is not guaranteed.
The projections included in the Analysis may be subject to additional fees, taxes or other charges, depending on the subject of the Publication. The price list applicable to the services provided by Admiral Markets is publicly available from the website of Admiral Markets.
Leveraged products (including contracts for difference) are speculative in nature and may result in losses or profit. Before you start trading, you should make sure that you understand all the risks.
On Thursday, February 6, the euro was down at the close of trading. The single currency made an attempt at a recovery at the beginning of the European session, but was soon pegged back upon the release of underwhelming data on German factory orders. This suggests that the Eurozone economy remains in a weak position.
The American session saw further pressure applied, with the drop in the rate accelerating in the wake of the breakout at 1.0990. The fall of the EURUSD pair came to a stop at the 1.0965-mark. GBP also fell, this was attributed to the decline in the number of price quotes and also the favourable economic stats coming out of the USA. The number of Americans applying for unemployment benefits fell to a nine-month low last week, down to 202,000. This report is considered important ahead of today’s release of the Non-Farm Payrolls (NFP) data.
Today’s news (GMT+3):
0:00 Germany: German Industrial Production n.s.a. and w.d.a. (YoY) (Dec), German Trade Balance (Dec).
16:30 Canada: Net Change in Employment (Jan), Unemployment Rate (Jan).
16:30 USA: Change in Non-farm Payrolls (Jan), Unemployment Rate (Jan).
18:00 Canada: Ivey Purchasing Managers Index s.a. (Jan).
21:00 USA: Baker Hughes U.S. Rig Count (Feb 7).
Current situation:
The expectations we had for the American session did not materialise. Bears were stronger than anticipated, stopping any chance of a correction to the balance line. The 1.0990-1.0995 zone was a strong support from the daily timeframe. The rebound required to initiate the formation of a double bottom did not come to fruition.
At the time of writing, the euro is worth 1.0973. Traders are waiting for the release of the NFP report (16:30 Moscow time) and are also keeping an eye on any news that might come out of China. Investors remain cautious, worried by the growth in numbers of those infected and killed by coronavirus in China. According to the latest official data, 31,485 people are ill with the virus, 638 people have died, and 1,603 people have been successfully treated and discharged from hospital.
On days when NFP data is due to be released, we do not make forecasts.This is down to the fact that the indicator is highly unpredictable, the actual figures almost always deviate from the forecast by an average of 30-40,000. Here, we are referring to the mean average deviation from the predicted values. Deviations can sometimes reach 100,000, this is down to the fact that the indicators for the previous two-to-three months are constantly being reviewed and revised. In order for bulls to turn the tide, they need to push the price up to 1.1020 by the close. For bears, their payrolls target is 1.0920.
The central bank of the Czech Republic raised its key interest rates for the first time since May 2019 as inflation is now seen accelerating faster than expected while economic growth is seen lower.
The Czech National Bank (CNB) raised its three main interest rates by 25 basis points, including the benchmark 2-week repo rate to 2.25 percent, the Lombard rate to 3.25 percent and the discount rate to 1.25 percent.
Pressure has been rising for the CNB board to hike rates in recent months, with two of the board’s seven members voting to raise rates in the last three meetings to curb inflationary pressures.
Today another two members joined the earlier minority with the result that four voted to raise the rate while the remaining three members voted to leave rates unchanged.
This is the first rate hike by CNB since May 2019 when it paused in its tightening cycle that began in August 2017 after 8 rate hikes that raised the key rate by a total of 1.95 percentage points.
Inflation in the Czech Republic has topped the central bank’s 2.0 percent midpoint target since May 2018 and in December inflation rose further to 3.2 percent, the highest since October 2012, and higher than CBN had expected.
CNB, which targets inflation of 2.0 percent within a tolerance range of plus/minus 1 percentage points, expects inflation to rise further at the start of this year, partly due to government measures to boost household consumption.
“Domestic inflation will increase appreciably above the upper boundary of the tolerance band around the target in the months ahead, mainly due to the price impacts of changes to indirect taxes amid persisting elevated inflation pressures in the domestic economy,” CNB said.
The CNB raised its forecast for annual inflation to average 2.3 percent in the first quarter of 2021 from an earlier forecast of 2.1 percent, before easing to 2.1 percent in the second quarter as inflationary pressures weaken, mainly due to slowing wage growth, falling growth in administered prices, and food prices.
Economic growth in the Czech Republic slowed in 2019 and is seen slowing further this year before it gradually accelerates in 2021, helped by an a gradual improvement in economic growth in the euro area along with rising consumption spending by households.
“The current downturn in private investment, reflecting the slowdown in euro area economic growth, will drop out during this year and total investment growth will turn positive again,” CNB said.
Growth in 2019 is estimated at 2.5 percent and is seen slowing to 2.3 percent this year, down from its previous forecast of 2.4 percent, before picking up in 2021 to 2.8 percent.
The Czech koruna, which has risen since October last year, jumped in response to the rate hike to just above 24.9 to the euro from 25.0 before it settled slightly lower just above 25.0.
During five years of extraordinary easy monetary policy from November 2012 to August 2017, the CNB not only cut its key rate to a rock-bottom 00.5 percent, but also intervened in the foreign exchange market to keep the koruna from rising against the euro as an addition tool of monetary easing.
As a first step toward tightening its monetary policy stance, CNB in April 2017 scrapped its commitment to keep the koruna below 27 to the euro. The koruna immediately soared before easing and settling around 25.8 to the euro between July 2018 and October last year.
Since then the koruna has been rising steadily and has now broken the psychological barrier of 25 to the euro, a level not seen since 2012.
CNB expects the koruna-euro exchange rate to remain stable for the rest of this year and then appreciate only slightly in 2021.
The Czech National Bank released the following statement:
“At its meeting today, the Bank Board of the Czech National Bank increased the two-week repo rate by 25 basis points to 2.25%. At the same time, it increased the Lombard rate to 3.25% and the discount rate to 1.25%. Four members voted in favour of this decision, and three members voted for leaving rates unchanged.
The decision adopted by the Bank Board is underpinned by a new macroeconomic forecast. Consistent with the forecast is a rise in domestic market interest rates initially, followed by a decline in the second half of this year.
According to the external assumptions of the new forecast, the currently muted economic growth in the effective euro area will be replaced by a gradual acceleration during this year. The recovery in economic growth will be reflected in a gradual increase in foreign producer price inflation. Consumer price inflation in the effective euro area will be below 2% over the entire forecast horizon. The market outlook for short-term euro rates has shifted to less negative levels.
According to the assumptions, the price of oil will fall gradually from an initial level of around USD 65 a barrel. However, world prices of oil have decreased markedly in recent days and are now below the assumptions of the forecast. The euro is expected to appreciate only marginally against the dollar.
Domestic inflation will increase appreciably above the upper boundary of the tolerance band around the target in the months ahead, mainly due to the price impacts of changes to indirect taxes amid persisting elevated inflation pressures in the domestic economy. These pressures will temporarily increase further at the start of this year, among other things as a result of government measures boosting household consumption. They will subsequently weaken gradually, mainly due to slowing wage growth. A temporary decline in import prices and falling growth in administered prices and subsequently food prices will also have an anti-inflationary effect. Inflation will thus decrease close to the 2% target over the monetary policy horizon, i.e. in the first half of next year. However, the decrease in inflation will be slowed by the assumed price impacts of changes to indirect taxes.
Monetary policy-relevant inflation, i.e. inflation adjusted for the first-round effects of changes to indirect taxes, will be lower than headline inflation and will return to the 2% target over the monetary policy horizon. This will be supported by a tightening of the monetary conditions at the start of this year.
The growth of the Czech economy slowed in 2019 but will gradually accelerate on the back of a steady recovery in external demand. GDP growth will continue to be driven mainly by rising consumption expenditure of households, reflecting continued, albeit gradually slowing, growth in household income. Fiscal policy will contribute to domestic demand growth via a rise in public sector pay, pensions and other social benefits. Government investment expenditure will also increase, supported by drawdown of EU funds. The current downturn in private investment, reflecting the slowdown in euro area economic growth, will drop out during this year and total investment growth will turn positive again. The recovery in external demand will be reflected in positive contributions of net exports to growth. As a result, economic growth will accelerate gradually and moderately. The unemployment rate will remain close to its current very low levels. Amid persisting labour shortages and weakening demand for labour, employment growth will remain subdued. Wage growth will decrease gradually, but its slowdown will be dampened by a further large increase in both the minimum wage and salaries in the non-market part of the economy from January 2020.
After appreciating at the start of 2020, the koruna-euro exchange rate will remain stable for the rest of the year. The effect of a temporary widening of the interest rate differential vis-à-vis the euro area will be offset by only weak economic and price growth abroad, amid only gradually fading negative global sentiment. Next year, the exchange rate will appreciate only slightly. Continued real convergence of the Czech economy will foster appreciation over the entire forecast horizon.
Consistent with the forecast is a rise in domestic market interest rates initially, followed by a decline in the second half of this year. The initial increase in interest rates mainly reflects persisting increased domestic inflation pressures, which will be temporarily intensified by a further large increase in the minimum wage and other government measures fostering growth in household consumption. The expected second-round effects of changes to indirect taxes, which will affect inflation in 2020 and early 2021, are also pushing up rates. The subsequent slight decline in domestic interest rates in the forecast will reflect a decrease in domestic inflation pressures in an environment of still very easy monetary policy in the euro area.
The headline inflation outlook has been increased by comparison with the previous forecast, owing to a revision of fundamental domestic inflation pressures, faster growth in administered prices and the incorporation of new changes to indirect taxes in 2021. The forecast for growth in domestic economic activity is slightly lower for this year and unchanged for next year. The new forecast predicts marginally higher interest rates in 2021 than the previous one did. Compared with the November forecast, the exchange rate of the koruna will be stronger this year.
The Bank Board assessed the balance of risks to the inflation forecast at the monetary policy horizon as being broadly balanced. The future exchange rate path is an anti-inflationary risk to the forecast. The external assumptions of the forecast continue to include the risk of a potential slower recovery of external demand growth. Potential higher inflation due to stronger domestic inflation pressures is an upside risk to the forecast.”
Asian stocks are mostly lower today, apparently taking a breather from the 3.7 percent climb over the past three days and unable to keep pace with their US counterparts that are sitting pretty on new record highs. The MSCI Asia Pacific Index still remains about two percent lower compared to its year-to-date high, which was marked on January 20. US stocks futures are in the red at the time of writing. Meanwhile, most Asian currencies are weaker against the Dollar, as investors continue fretting over whether the coronavirus outbreak could derail Asia’s economic trajectory.
Safe havens still keeping up their guard
Despite the surge in equities, the coast isn’t all clear. Lingering concerns among some investors are evident, judging by the price action in safe haven assets: Gold is advancing towards the $1570 psychological level, still up by 3.4 percent so far in 2020, while US 10-year Treasury yields remains some 15 percent lower compared to the start of the year. Investors have good reason to remain cautious considering that the recovery in global economic conditions remains patchy, with downside risks still featuring prominently on investors’ radars.
With so much uncertainty still around the coronavirus outbreak, especially about its implications on the global economy, perhaps investors are getting complacent about the severity of the total economic toll, hoping that monetary and fiscal support can come to the rescue. While stocks may continue riding on such hopeful sentiment, other assets such as Asian currencies and major commodities may be more reflective of the economic fundamentals, as the outbreak remains a major negative risk.
Dollar rises on expected resilience in US jobs market
The Dollar index (DXY) surged to its highest since October, breaching the 98.5 level before moderating slightly, as investors await the January US non-farm payrolls data. Markets are currently pricing in a print of 165,000 new jobs added last month, building on the recent rise in US consumer sentiment and the return-to-expansion in US manufacturing. As the US economy continues demonstrating to the world that its foundations are strong enough to potentially offset downside risks, that should serve as a platform for more Dollar gains, with the DXY boasting more headroom before it enters overbought territory.
Oil settles as investors hope for OPEC+ supply cuts
Brent futures are settling around the mid-$50/bbl region, after Russia agreed to the OPEC+ Joint Technical Committee’s recommendation for an output cut of 600,000 barrels per day through June. More OPEC+ output cuts may just be the only thing that could help stem Oil’s slide, especially if the coronavirus outbreak deals a larger-than-expected blow to the Chinese economy. Even as major Oil producers intervene by tightening the supply taps, it remains to be seen how much it can offset the still-uncertain drop in demand stemming from the coronavirus outbreak, a conundrum which may cap Oil’s upside.
Disclaimer: The content in this article comprises personal opinions and should not be construed as containing personal and/or other investment advice and/or an offer of and/or solicitation for any transactions in financial instruments and/or a guarantee and/or prediction of future performance. ForexTime (FXTM), its affiliates, agents, directors, officers or employees do not guarantee the accuracy, validity, timeliness or completeness, of any information or data made available and assume no liability as to any loss arising from any investment based on the same.
US stock market record rally was intact on Thursday against the background of China’s pledge to cut in half tariffs on some $75 billion of U.S. imports beginning February 14. The S&P 500 gained 0.3% to 3345.78. The Dow Jones industrial average gained 0.3% to 29379.77. Nasdaq composite index rose 0.7% to 9572.15. The dollar strengthening slowed despite report the number of people applying for first time jobless benefits fell by 15,000 to 202,000 last week: live dollar index data show the ICE US Dollar index, a measure of the dollar’s strength against a basket of six rival currencies, rose 0.2% to 97.46 and is higher currently. Futures on stock indexes point to higher openings today.
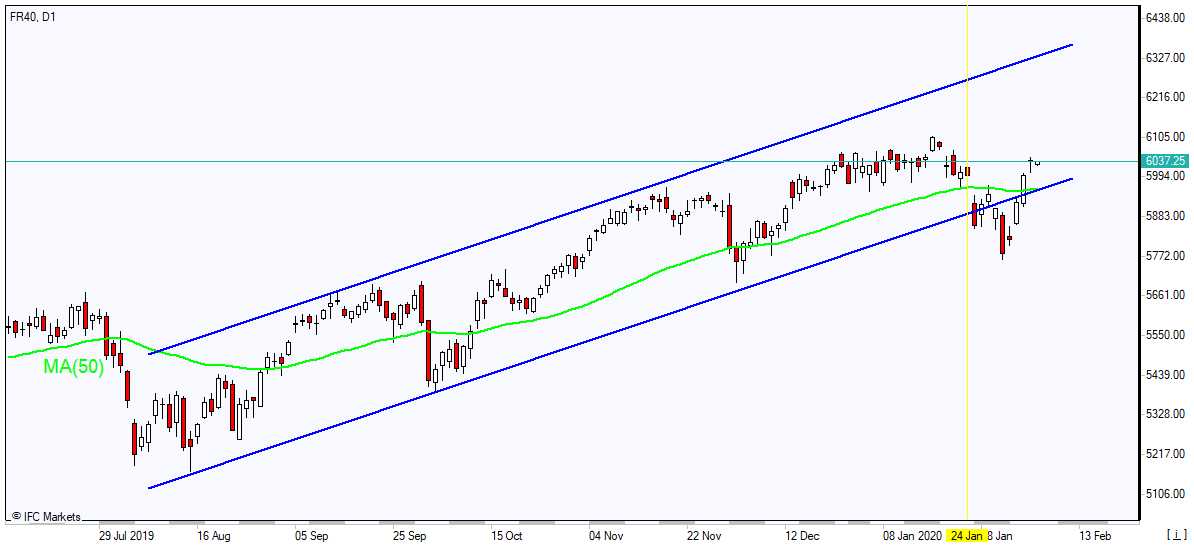
CAC 40 led European indexes advance
European stocks extended gains on Thursday. Both the GBP/USD and EUR/USD continued their sliding yesterday with Pound reversing higher while euro lower currently still. The Stoxx Europe 600 index added 0.45% led by bank shares. Germany’s DAX 30 gained 0.7% to 13574.82. France’s CAC 40 rose 0.9% while UK’s FTSE 100 edged up 0.3% to 7504.79.
Hang Seng leads Asian indexes retreat
Asian stock indices are mostly lower today. Nikkei ended down 0.2% at 23827.98 with yen little changed against dollar. Markets in China are mixed ahead of January trade report: the Shanghai Composite Index is up 0.3% while Hong Kong’s Hang Seng Index is 0.7% lower. Australia’s All Ordinaries Index pulled back 0.4% despite continued Australian dollar decline against the greenback.
Brent futures prices are extending losses today. Prices ended lower yesterday after reports Russia wasn’t willing to commit to crude oil output cut after the OPEC+ Joint Technical Committee recommended a cut to production of its members and other allies of 600,000 barrels a day: March Brent crude lost 0.6% to $54.93 a barrel on Thursday.
Gold slips as Dollar strengthens
Gold prices are retracing lower today. Prices rose yesterday: April gold added 0.5% to $1570 an ounce on Thursday.
Note: This overview has an informative and tutorial character and is published for free. All the data, included in the overview, are received from public sources, recognized as more or less reliable. Moreover, there is no guarantee that the indicated information is full and precise. Overviews are not updated. The whole information in each overview, including opinion, indicators, charts and anything else, is provided only for familiarization purposes and is not financial advice or а recommendation. The whole text and its any part, as well as the charts cannot be considered as an offer to make a deal with any asset. IFC Markets and its employees under any circumstances are not liable for any action taken by someone else during or after reading the overview.
Daniel Carlson of Tailwinds Research takes a close look at what he calls a “great value opportunity,” with a focus on subsidiary Avenue Therapeutics.
With a plethora of balls in the air, Fortress Biotech Inc. (FBIO:NASDAQ) is a very difficult company to value. The financials, being a combination of the multiple companies in which Fortress has a minority ownership yet a control position through ownership structure and control of the board, are virtually impossible to decipher unless you’re a forensic accountant. A conglomeration of 28 drugs in development under 10 different subsidiaries, three of which are public, come together in one balance sheet and income statement simply doesn’t lend itself to easy review.
The result of this compilation of financials is almost to be expected; most analysts don’t spend the time to get to know Fortress Biotech. I’ve seen it from personal experience: Smart financiers take one look at the financials and decide that this is a cash-burning business that needs financing. Then they turn their attention elsewhere.
This fairly common reaction has created a wonderful opportunity for those investors willing to take the time to peel back this onion. Simply put, by consolidating subsidiaries’ earnings in their financials, Fortress gives off the appearance of a weak company. This however, couldn’t be further from the truth.
In reality, Fortress is a company with several years’ cash on the books and a game plan in place to be cash-flow positive in 2020. Meanwhile, they have a development team in place that is bringing in new opportunities rapidly, and an experienced management team that has a track record of developing blockbuster drugs.
Fortress, in our opinion, has all the pieces in place to grow into becoming a major player in healthcare over the next few years. In November, the company ranked in the top 10 of Deloitte’s 2019 Technology Fast 500. It’s a great growth company. But, at the same time, FBIO trades at a fractional value to what a sum-of-the-parts liquidation would generate for investors. Fortress is a great value opportunity.
Often, sum-of-the-parts stories trade below fair market value until they hit critical mass and enough analysts do the work to see the value. This creates an opportunity for those of us who will take the time to explore the story and put the puzzle together. That’s just what we are going to do with Fortress; we are going to take this story apart piece by piece to understand each component that makes up FBIO and assign a value to each part.
Why are we starting with Avenue? There are a couple of reasons why Avenue is the best, first place to go when digging into Fortress.
First off, this is a one-product company, and that product is likely to be FDA approved by the end of the year, which makes it relatively easy to assess the assets.
Second, Avenue is under contract to be acquired (post-drug approval) for cash by Cipla Ltd. (CIPLA:NSE), an Indian generic drug manufacturer. Since it’s being acquired for cash, we can easily put a dollar value on the shares of Avenue that are owned by Fortress, assuming the acquisition closes.
Finally, Avenue is a big piece of the Fortress story and, likely, the first piece to be monetized, so a good place to start.
There are, of course, some caveats to the terms and value at which Avenue is being acquired, but we’ll dig into those later. For now, let’s start by looking at Avenue’s drug, which is an intravenous (IV) version of Tramadol.
Tramadol is a drug that has been approved and used in pain relief since 1963. In the U.S. it is available in a pill form only. Tramadol is used primarily to treat mild to severe pain, both acute and chronic and has about 1/10th the potency of morphine. As a drug that has been around for over fifty years, it is a very well-known therapeutic. Doctors are certainly familiar with it and many have a history of prescribing the drug.
Avenue is in the process of applying for FDA approval on an IV tramadol. By delivering the drug intravenously, they expect to see adoption by hospitals for post-operative pain, an area dominated by conventional intravenous opioids. The market for post-operative pain relief is a very large one, currently dominated by morphine and other opiates like fentanyl. It is estimated that there are 200 million use cases in the U.S. per annum.
IV tramadol stands to potentially gain a large piece of this market. This is because, while tramadol is classified as an opiate, it is much less addictive than those other drugs. According to Harvard Health Publishing, “Compared with other controlled substances, tramadol is at the safer end of the spectrum. Heroin, for example, is a Schedule I drug (high abuse potential and no acceptable medical use). OxyContin is a Schedule II drug (it also has high abuse potential, but has an accepted medical use). Classified as a Schedule IV drug, tramadol is considered useful as a pain reliever with a low potential for abuse.”
In addition to the 200 million cases cited above, there are 45 million uses of other pain killers intravenously in the U.S. as well. These are typically intravenous NSAIDS, similar to Advil, or even intravenous acetaminophen, like Tylenol, neither of which is as effective as tramadol.
Thus, if approved, the market for IV tramadol is potentially 245 million uses per annum. This for a well-known drug that has similar efficacy with those already on the market and a much better safety profile. Obviously, the potential for significant market share to be gained is quite realistic.
In order to achieve this market share, IV tramadol obviously needs to be approved by the FDA. This is something we believe is highly likely to occur. In 2019, the company released positive results from its second phase 3 study on tramadol, and on Dec. 11, Avenue announced they had filed a new drug approval (NDA) for approval:
“The NDA for IV tramadol is based on positive results from two pivotal Phase 3 clinical efficacy and safety trials in patients following bunionectomy and abdominoplasty surgeries, as well as an open-label safety study with a total of more than 500 patients who received the IV tramadol 50 mg dosing regimen. In addition, the NDA includes an epidemiology study on abuse of tramadol in the U.S. and in certain European countries where IV tramadol is available. The study finds that reports of abuse with tramadol are infrequent, both in absolute number and relative to other prescription opioids, and that abuse of tramadol via injection is uncommon relative to oral tramadol in countries where it is available.”
Based on the findings in their studies, and based on the data presented from other countries in which IV tramadol is used (the FDA routinely accepts data such as this), it appears that IV tramadol is highly likely to get approval. It should also, due to the lower levels of abuse, receive a clean label for marketing.
Therefore, it’s our opinion that IV tramadol will be approved by the end of 2020, and the wording around FDA approval will be positive enough that Avenue will be acquired, as per its contract with Cipla, before the end of the year.
This is where things start to get interesting for FBIO shareholders. The terms of the acquisition are for the remaining shares of Avenue that aren’t currently owned by Cipla to be purchased for $180 million in cash. This will result in an estimated takeover price of $13.92 per share, which will generate a roughly $45 million check to Fortress.
On top of this, Cipla has agreed to offer contingent value rights (CVRs) to the shareholders of Avenue. If you’re not familiar with CVRs (and I wasn’t before), they are basically future payouts to the current shareholders of Avenue based upon the sales and or income generated by IV tramadol over the next 16 years. Here’s the exact wording behind it:
“Each CVR represents the right of its holder to receive a contingent cash payment pursuant to the CVR Agreement upon the achievement of certain milestones. If, during the period commencing on the day following the closing of the Merger Transaction until December 31, 2028, IV Tramadol generates at least $325 million or more in Net Sales (as defined in the CVR Agreement) in a calendar year, each Holder shall entitled to receive their pro rata share of (i) if the product generated less than $400 million in Net Sales during such calendar year, 10% of Gross Profit (as defined in the CVR Agreement), (ii) if the product generated between $400 million and $500 million in Net Sales during such calendar year, 12.5% of Gross Profit, or (iii) if the product generated more than $500 million in Net Sales during such calendar year, 15% of Gross Profit. Additionally, at any time beginning on January 1, 2029 that IV Tramadol has generated at least $1.5 billion in aggregate Net Sales, then with respect to each calendar year in which IV Tramadol generates $100 million or more in Net Sales, each Holder shall be entitled to receive their pro rata share of an amount equal to 20% of the Gross Profit generated by IV Tramadol. These additional payments will terminate on the earlier of December 31, 2036 and the date (which may be extended by up to 6 months) that any person has received approval from the FDA for an Abbreviated New Drug Application or an FDA AP-rated 505(b)(2) NDA using IV Tramadol.”
What that language all means is that current shareholders of Avenue will get a future stream of cash payments if IV tramadol becomes a successful drugsuccess being defined as generating at least $325 million per annum in sales.
Is it likely they get to that sales number? Remember there are 245 million use cases of IV pain relievers in the US. IV tramadol is probably going to have a $15 or more cost per usage. In order to get to $325 million in sales, they simply need close to 10% market share. At 25% market share, this starts to rapidly approach a billion dollars in sales per annum.
Cipla, in my opinion, is banking on this being a billion-dollar drug. They have already spent $35 million acquiring a third of Avenue and have invested millions more in bringing IV tramadol in front of the FDA. They are contractually obligated to acquire the balance for $180 million after a clean approval. Suffice to say, Cipla believes this is going to be a blockbuster drug and they have invested significantly based on that assumption.
Assuming that Cipla is correct and IV tramadol does, indeed, become a billion-dollar drug, what is the value of these CVRs? To calculate this, I put together a sales model that trended toward the $1 billion-mark by year 8. I assumed that the gross margins on the drug were 80%, which is fairly standard for a patent-protected product.
This means that gross profits on IV tramadol, in my model, approach $800 million by 2028. Per annum! Since the CVR owners get 20% of that number, there are checks being written to the current shareholders of close to $160 million per year come 2028 and lasting until 2036. These checks start earlier but that’s the full run-rate I modeled.
The net present value (NPV) of these future cash streams is close to a billion dollars. Since Fortress owns 32% of the (non-Cipla) outstanding shares of Avenue, the NPV of this future revenue stream to Fortress comes to over $300 million dollars. Factor in the buyout price, and the current NPV of Fortress’ Avenue shares is around $350 million.
Obviously, these numbers can be played with. The sales may never approach a billion dollars. Or, they could conceivably get 50% market share and sales would be double my model. I also used a 5% discount rate, which is low, but so are interest rates. Bumping that number up can easily lower the NPV.
Here’s the bottom line on all this. Assuming IV tramadol gets approved and acquired by Cipla, Fortress is going to get $45 million in cash this year and a potential future revenue stream that has a net present value in the hundreds of millions of dollars. Meanwhile, the current market cap of FBIO, with the stock at $2.80 per share, is around $200 million dollars, based on 71 million shares outstanding. Thus, the net present value of Fortress’ portion of Avenue, at $350 million (assuming of course a successful approval and acquisition), is worth around $5 per share, or around 70% greater than the current share price of Fortress!
Having spent time with management of Fortress, learning more about their business model, and getting to know the track record of their CEO, I find their strategy to be compelling. FBIO is building a portfolio of companies and healthcare products that they source inexpensively and, through their value add, create compelling upside to the products. The story behind Avenue is a great example of how Fortress operates.
In IV tramadol they acquired a proven, well-known product that had zero patent protection, and have built a strategy around getting FDA approval, patent protection and taking it to market. They bought it on the cheap and created value, took it public through an initial public offering (IPO), then sold it to a deep pocketed partner. Avenue Therapeutics is example A of how CEO Lindsay Rosenwald intends to build Fortress into a multibillion-dollar company.
Going forward, we will look at the other companies in Fortress’ stable. The value of these companiesthe sum of the parts so to speakgreatly exceeds the current market cap of FBIO. We hope to make this evident over time. For now, suffice to say that, based on Avenue alone, Fortress is an undervalued and misunderstood entity.
Daniel Carlson is the founder and managing member of Tailwinds Research Group and its parent company DFC Advisory Services, which is a licensed registered investment advisor (CRD # 297209). Tailwinds is a microcap focused research company that provides research on and consults to over 20 emerging growth companies in the technology and life sciences arenas. DFC Advisory Services is an RIA that manages money dedicated to investing in the companies covered by Tailwinds. For more information on these two companies and their track record, please see www.tailwindsresearch.com. Prior to founding these two entities, Dan spent many years working with small public companies, having been CFO of two public companies and helping finance many others. A 1989 graduate from Tufts University with a degree in Economics, Dans formative years in business were spent as an equity trader, first on the Pacific Coast Stock Exchange then on the buyside at several multi-billion dollar firms.
This article was submitted by Tailwinds Research. For more information on Tailwinds Research or on Fortress Biotech, please visit www.tailwindsresearch.com.
Tailwinds owns stock in Fortress Bio. For a complete list of disclaimers and disclosures, please click here.
Disclosure: 1) Daniel Carlson: I, or members of my immediate household or family, own shares of the following companies mentioned in this article: Fortress Bio. I personally am, or members of my immediate household or family are, paid by the following companies mentioned in this article: None. My company has a financial relationship with the following companies referred to in this article: Fortress Bio. Additional disclosures and disclaimers are above. I determined which companies would be included in this article based on my research and understanding of the sector. 2) The following companies mentioned in this article are billboard sponsors of Streetwise Reports: None. Click here for important disclosures about sponsor fees. The information provided above is for informational purposes only and is not a recommendation to buy or sell any security. 3) Statements and opinions expressed are the opinions of the author and not of Streetwise Reports or its officers. The author is wholly responsible for the validity of the statements. The author was not paid by Streetwise Reports for this article. Streetwise Reports was not paid by the author to publish or syndicate this article. Streetwise Reports requires contributing authors to disclose any shareholdings in, or economic relationships with, companies that they write about. Streetwise Reports relies upon the authors to accurately provide this information and Streetwise Reports has no means of verifying its accuracy. 4) This article does not constitute investment advice. Each reader is encouraged to consult with his or her individual financial professional and any action a reader takes as a result of information presented here is his or her own responsibility. By opening this page, each reader accepts and agrees to Streetwise Reports’ terms of use and full legal disclaimer. This article is not a solicitation for investment. Streetwise Reports does not render general or specific investment advice and the information on Streetwise Reports should not be considered a recommendation to buy or sell any security. Streetwise Reports does not endorse or recommend the business, products, services or securities of any company mentioned on Streetwise Reports. 5) From time to time, Streetwise Reports LLC and its directors, officers, employees or members of their families, as well as persons interviewed for articles and interviews on the site, may have a long or short position in securities mentioned. Directors, officers, employees or members of their immediate families are prohibited from making purchases and/or sales of those securities in the open market or otherwise from the time of the interview or the decision to write an article until three business days after the publication of the interview or article. The foregoing prohibition does not apply to articles that in substance only restate previously published company releases. 6) This article does not constitute medical advice. Officers, employees and contributors to Streetwise Reports are not licensed medical professionals. Readers should always contact their healthcare professionals for medical advice.
Fund manager Adrian Day looks at four of the resource companies in his portfolio, three of which he calls good buys at current prices.
Altius Minerals Corp. (ALS:TSX.V, Toronto, 10.71) generated $78 million in royalty revenue last year, following a soft last quarter, with 37% of it from copper. Coal royalties, which dominated after the acquisition of a package of royalties from Sherritt in 2013, are now down to 14% of the total.
Altius has filed a takings suit against the Alberta government, which arbitrarily banned coal-fired power generation; the mine on which Altius has a royalty had a multi-decade contract to supply coal to a local plant. Both the plan and the mine were compensated by the provincial government, but Altius has not been. It took a C$70 million write-off on its investment. We do not expect to see compensation in that amount, but an award, and a substantial one, is certainly possible, though the case may take years to drag through the courts.
New renewable energy venture grows rapidly
Given the limited time frame on its coal royalties and the poor image associated with them, Altius has been using the revenue from coal royalties to launch a new clean energy unit. At present, this comprises two wind projects, though other clean energy project, and other partners, are likely to be included over time. Altius expects this business to become self-sustaining “very soon” as it is growing faster than expected.
Buying royalties a competitive business with lower returns
Acquiring royalties, including those on base metals and other resources, has become more competitive and expensive, as not only new companies enter the space, but also private equity and other players who do seem concerned with realistic rates of return. Altius is expecting going forward more royalty generation from deals on its extensive land package of early-stage resource properties, though these will take longer that purchased royalties before they generate revenue. Altius has proven itself over the years, however, at being able to generate revenue from these deals long before royalty income begins, such as by selling equity interests in new companies formed to advance particular projects.
Hidden value in balance sheet
New debt stands at $82 million, down slightly from the previous quarter. Although the cash balanceat C$22 millionis relatively low, it ignores the value of a junior portfolio of just over $54 million, as well as the value of its holding in Labrador Iron Ore, at $93 million.
The value of the junior portfolio is more-or-less where it stood a year ago, despite Altius having pulled out $19 million. It has also streamlined the portfolio, from 27 to 18 companies, limiting holdings to companies with which Altius has some strategic royalty interest. In addition, Altius has access to capital through its line-of-credit, its relationship with Fairfax Financial, and other partners. It has been aggressively buying back stock.
We have high confidence in Altius’s management, disciplined, patient and imaginative. Together with its solid balance sheet; strong, diverse, cash flow; and vast land package; this makes Altius a long-term holding for exposure to non-gold resources. At the current price, it is a strong buy.
Vista monetizes assets while it guards value at Mt Todd
Vista Gold Corp. (VGZ:NYSE.MKT; VGZ:TSX, NY, US$0.68) continues to pursue optimization at its Mt Todd project in Northern Territories, Australia. At the same time, it continues to seek non-dilutive ways of boosting its cash balance to pay costs as it waits for the opportune time to do a deal on the property. Vista is seeking a partner who will finance and develop the project, while Vista’s interest will be funded by the proceeds of the sale. If this works, it would be a very nice conclusion, though the company is also open to a complete sale at the right price.
Now it is monetizing a royalty it holds on the Awak Mas property in Indonesia. Vista originally had a working interest in the property, which it later converted to a royalty. Now it will receive shares in the Australian company that owns the property plus $100,000, and the owner continues to have the right to convert 50% of the royalty for $2.4 million by April, and now the other half for $2.5 million a year later. This is a good deal for Vista, since the money will come sooner than would any royalty revenue. These payments along with the further $1.5 million option payment in October 2021 on the de los Reyes property in Mexico cover another year’s expenses. With the reduced spend at Mt Todd, overall expenses are upwards for $6 million a year now.
Can it avoid an equity raise?
Vista still owns shares in Midas Gold, currently worth around US$3.5 million; these shares are eligible to be sold in the market at any time. And it owns a used mill which it is offering for sale; that could raise $7 million or possibly more. As of last quarter, Vista had $7.2 million in working capital, with cash just over $4 million; that will be lower at end year. It is possible that the cash, the two Awak Mas payments, followed by the de los Reyes option (perhaps with Midas share sales) could take the company through to the end of next year. It is likely, however, that without a sale of the mill or meaningful movement on a Mt Todd transaction, the company will look to raise some equity funds in the coming year.
Given the attractiveness of Mt Toddits size and locationand the huge discount at which Vista is trading, patient investors should continue to accumulate Vista at the current level. This is a particularly good time, since, despite the recent advances in both the gold price and at the company, the stock pricewhich has had a range of 70 cents to $1.35 over the past yearhas hardly moved.
Osisko is loudly proclaiming its mission
Osisko Gold Royalties Ltd. (OR:TSX; OR:NYSE, NY, US$9.98), following confusion and opposition after its September acquisition of all of the Barkerville shares it did not already ownwhich saw the stock drop 24% in one weekplus several high-profile exits from the company, has been making clear that it is not becoming a mining company, and that the core business remains royalties. The new messaging has been a little slow, and the stock has only very slowly begun to recover.
The company has said that its contribution to Barkerville is mostly done, and that it does not intend any additional exploration expenditures. It will look for financing sources and seek to monetize its investment. The company concedes that there is a possibility it would build the minethe company certainly has the expertise since it built Malartic, one of Canada’s largest recent minesbut would do so with financing from others, and seek to monetize it.
Was it the deal or the way it was presented?
In short, Osisko feels that the biggest mistake it made was not in buying Barkerville, which it said represents tremendous value, but in not clearly stating that it was not turning into a mining company. Barkerville is an extension off Osisko’s accelerator model, which has been a financial success. Given the discount at which Osisko trades relative to other mid-sized and large royalty companiesonly some of which is justified, given the higher-risk “hybrid” modelOsisko is a good buy at these levels.
Murphy’s at work at Fortuna Silver
Fortuna Silver Mines Inc. (FSM:NYSE; FVI:TSX; FVI:BVL; F4S:FSE, NY, US$3.92) had more bad news when a Mexican government department served notice it would cancel one of the major concessions at Fortuna’s San Jose Mine if it did not pay $30 million by March due to disputed royalties. The concession represents about 27% of San Jose, which itself represents about one-third on Fortuna’s Net Asset Value, but currently most of its cash flow. San Jose still has a five-year life ahead of it, though the potential for further resources is still there. However, the ore mined has been lower grade of late.
The royalty was allegedly given to the government by the property’s previous owner. Fortuna challenged this in court, but no definitive ruling has yet been made. Fortuna has asked the court for a stay on the latest directive threatening to cancel the concession. Given that the dispute was not widely known in the market, the response has been somewhat muted.
At Fortuna’s other existing mine, Caylloma, in Peru, lead and zinc have become far more dominant, while their prices are down even as treatment charges are up; there has been less silver mined even as the price of silver has appreciated. This combination means that cash flow of $10 million 2019 could drop to $2 million or so at current prices.
Nearly there at Lindero
The development at Lindero, including positive grade reconciliation, perhaps offset the bad news elsewhere. Reports of a dispute with its main contractor at the last minute are also worrying, though that should not cause further delays in the countdown to first gold pour by March. It is important to note that under Argentina’s capital controls, money can be taken out of the country to repay debt, so Fortuna has about 18 months of revenue before capital controls would be an issue.
Fortuna stock has been volatile over the past year, after it was hurt by the Argentina vote favoring the opposition, trending back up more recently on the countdown to first gold pour at Lindero. We would hold here.
Adrian Day, London-born and a graduate of the London School of Economics, heads the money management firm Adrian Day Asset Management, where he manages discretionary accounts in both global and resource areas. Day is also sub-adviser to the EuroPacific Gold Fund (EPGFX). His latest book is “Investing in Resources: How to Profit from the Outsized Potential and Avoid the Risks.”
Disclosure: 1) Adrian Day: I, or members of my immediate household or family, own shares of the following companies mentioned in this article: Evrim Resources, Altius Minerals and Lara Exploration. I personally am, or members of my immediate household or family are, paid by the following companies mentioned in this article: None. My company has a financial relationship with the following companies mentioned in this article: None. Funds controlled by Adrian Day Asset Management hold shares of the following companies mentioned in this article: Osisko Gold Royalties, Kingsmen Creatives, Lara Exploration, Evrim Resources, Altius Minerals, Vista Gold and Fortuna Silver. I determined which companies would be included in this article based on my research and understanding of the sector. 2) The following companies mentioned in this article are billboard sponsors of Streetwise Reports: None. Click here for important disclosures about sponsor fees. The information provided above is for informational purposes only and is not a recommendation to buy or sell any security. 3) Statements and opinions expressed are the opinions of the author and not of Streetwise Reports or its officers. The author is wholly responsible for the validity of the statements. The author was not paid by Streetwise Reports for this article. Streetwise Reports was not paid by the author to publish or syndicate this article. Streetwise Reports requires contributing authors to disclose any shareholdings in, or economic relationships with, companies that they write about. Streetwise Reports relies upon the authors to accurately provide this information and Streetwise Reports has no means of verifying its accuracy. 4) This article does not constitute investment advice. Each reader is encouraged to consult with his or her individual financial professional and any action a reader takes as a result of information presented here is his or her own responsibility. By opening this page, each reader accepts and agrees to Streetwise Reports’ terms of use and full legal disclaimer. This article is not a solicitation for investment. Streetwise Reports does not render general or specific investment advice and the information on Streetwise Reports should not be considered a recommendation to buy or sell any security. Streetwise Reports does not endorse or recommend the business, products, services or securities of any company mentioned on Streetwise Reports. 5) From time to time, Streetwise Reports and its directors, officers, employees or members of their families, as well as persons interviewed for articles and interviews on the site, may have a long or short position in securities mentioned. Directors, officers, employees or members of their immediate families are prohibited from making purchases and/or sales of those securities in the open market or otherwise from the time of the interview or the decision to write an article until three business days after the publication of the interview or article. The foregoing prohibition does not apply to articles that in substance only restate previously published company releases. As of the date of this article, officers and/or employees of Streetwise Reports LLC (including members of their household) own securities of Osisko Gold, Evrim Resources, Altius Minerals, Vista Gold and Lara Exploration, companies mentioned in this article.
Bill Powers of Mining Stock Education speaks with Greg Crowe, president and CEO of Silver One Resources, about his company’s new Phoenix silver project in Arizona as well as the company’s plans for 2020.
In this interview, Silver One Resources Inc.’s (SVE:TSX.V; BRK1:FSE; SLVRF:OTC) President and CEO Greg Crowe discusses the company’s new Phoenix Silver project in Arizona with its spectacular grab sample assays as well as the company’s plans for 2020.
Bill Powers: Silver One Resources just released a press release about a new project in Arizona with some stellar results that make you look twice at those pictures in the press release and here to talk about it with me Silver One’s President and CEO Greg Crowe. Greg, please break down for us this press release that you put out today.
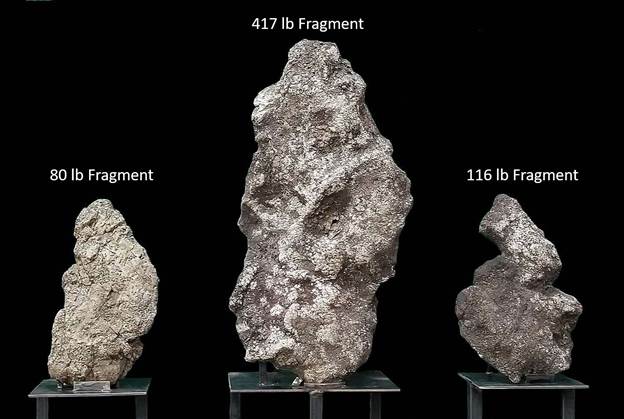
Greg Crowe: Thanks, Bill. We’ve been looking around at other silver opportunities and we happened to come across one in Arizona, which is right next door, of course, to Nevada. So it’s not that far away, but what we like about it is there are some spectacular vein fragments, and I say they’re vein fragments because they’re very angular and they have this inter-growth of crystals that suggests that they haven’t been transported very far. Most of the property is covered by overburden, but these vein fragments, one of them that was assayed returned a spectacular 459,000 grams per metric ton (14,688 oz/ton). So that is a phenomenal return. That was from about just under 20-pound sample.
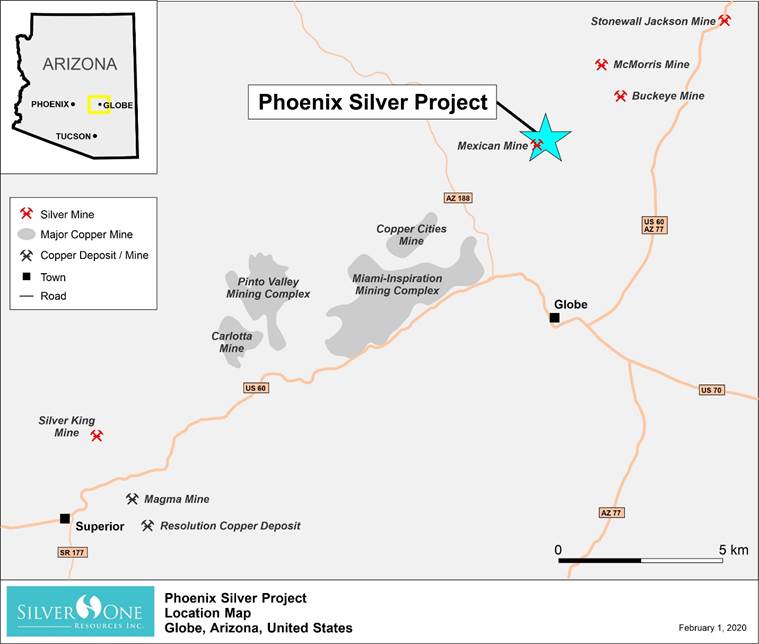
It was just lying under the overburden on the surface. Another one came back, it was 417 pounds. Probably one of the world’s largest solid pieces of silver. Now what intrigues us is this property is set just on the outer margin of an extremely prolific producing copper camp with giants, such as BHP, Rio Tinto, Freeport-McMoran, Capstone, all mining in that particular area. It’s just east of Phoenix near a small town called Globe, which is a big mining center. Also the brand new Resolution copper deposit, which is a joint Rio Tinto BHP project. It occurs in this camp and that thing boasts about 1.78 billion tons of mineralization at 1.53% copper. It’s going to take another 10 years to bring it into production, but it’s a huge camp. These silver deposits that some of them historically were mined in the late 1800s lie just on the outer margins of this big copper camp.
So what did we find here? We’ve got this project. We know there are vein systems striking east-west, and the projection of those vein systems occurs just up-slope from where we’re finding these huge big silver fragments, which we interpret to be pieces of the vein that have spalled off and rolled downhill. So our job is to go on to this project, which we have the right to acquire 100% of. If you read the news release, you’ll see the terms there. Big payments are pushed back to the third and fourth year. So it gives us time to explore it. And if we’re successful, then finding the source of some of these big vein fragments, then this could be a very, very rich vein system that we would move rapidly to develop it and possibly exploit.
Bill: If a skeptic was listening to us speak today and reading the press release, could they say to themselves, “Yeah, you have this big chunk of silver here, but that doesn’t mean that you’re going to find anything economic.” What would be your response to that person?
Greg: There are never any guarantees in life in anything apart from, of course, death and taxes, but quite frankly it’s like any other exploration level project. You never know until you drill things off. Our goal is to explore it. We’ve structured our deal where for the first couple of years the payments are not that onerous. We get to go in and we get to explore. This is a prime opportunity. It is extremely rare, if not totally unheard of, to find pieces of silver lying on the ground, particularly in developed countries like Canada and the United States where a lot of exploration has already taken place. This is an ignored silver camp and yet these fragments are still there waiting to be found. They obviously came from a source and if that source is nearby and on the property, we will do our best to find mineralization in-situ that we’ll be able to develop.
Bill: One of the pictures in the press release shows a 417-pound fragment. I understand this native silver fragment contains up to 70% native silver? That’s just amazing.
Greg: The only thing you can say for that is, and I have to qualify this, is up to 70% native silver. That was not determined by an assay. That was determined by what we refer to as a specific gravity measurement and the reason for that is this is a specimen quality fragment. In order to keep it in its pristine state in its entirety, and this is still held by the owners. This is not held by Silver One. It did come from the property. What we need to do is make sure that we find the source of that type of mineralization because it wouldn’t take many of those to build up ounces of silver.
Bill: How was it found? What’s the story here?
Greg: There’s some prospectors who kind of have held the property for a while and they were out on the property. They found a couple of small little pieces and they thought, “Oh, there might be more here.” So they went back and they brought some metal detectors and they started looking around and they uncovered some of these nuggets. So they went and they did a deal with some people that I know and then we ended up doing a deal with them to acquire a 100% interest in the project.
Bill: You just closed a nice financing. Can you break that down for us and then talk about how you’re going to use those funds to explore this project as well as your other projects?
Greg: This was a totally oversubscribed financing. It started out fairly small, but it kind of grew as investors called in and they wanted a piece. So we did decide to increase the size of this financing. In essence, what started out is around C$1 to 1.5 million, actually closed on January 20th at C$5.2 million. That financing was done at 25 cents with an attached half warrant at 40 cents. We also secured the interest of our largest shareholder, Eric Sprott, who came in for about C$1.5 million of that C$5.2 million. So we have a good treasury right now. What we plan on doing is move forward.
We’re continuing to drill the Candelaria project (127 Moz Ag historical resource). So as we get results in, we’ll be issuing that news over the coming weeks and months possibly. In terms of the other very high grade prospect that we have in eastern Nevada (Cherokee project), we’ll be doing some work there this year. Then, of course, in this new acquisition we want to get in and do some evaluation. Probably the first steps we’re going to take there are to go and do some surface work trying to really prospect the whole project because it’s never really been gone over with a fine tooth comb. On top of that we’d probably do some geophysics and some detailed geochemical work and see whether we can find the trace of those veins and if we are fortunate, we’ll be able to find some in situ mineralization that will be extremely exciting.
Bill: So the drills could be turning after you do the geophysical and the ground survey regarding the Arizona Phoenix Silver project?
Greg: Possibly. That might be later this year. It might even be next year. We’ll just see how fast things develop and whether lady luck allows us to find a zone worth drilling.
Bill: So what would be your burn rate for investors wanting to know how far this C$5 million will take you?
Greg: Our burn rate, G&A is probably about US$1M a year. All right. Property payments, etc., etc. The actual exploration that we’re doing, we’re probably spending another several hundred thousand on completing the drill program at Candelaria. We have not set a budget for the exploration on the eastern Nevada Cherokee project just yet. We’re going to review that. We’re still waiting on all of the final last things to come in from the sampling that we did up until Q4 of last year. Then on top of that, I look at probably spending upwards of about $400,000 or $500,000 on the new prospect in Arizona. Then, of course, if we do come up with some interesting results and we want to drill, then we’ll increase that. So I think we got another, if we stretch our dollars, etc., we’ve got another a couple of years’ worth of treasury left in the account.
Bill: Over the next few months are you going to have most of your press releases coming out of Candelaria?
Greg: Well, certainly coming out of Candelaria, but if we get some good results on this Phoenix Silver project, I want to move as quickly as we can in terms of starting to do this. So we might see in a couple of months some news coming out of this project as well. Eastern Nevada Cherokee project, we will get some results coming out of that based on last year’s sampling. The weather’s a bit inclement right now, so we’re not going to get back in there for another two to three months before we start some work down on that project again. So that’ll be pushed back into Q2, Q3.
Bill Powers is the host of the Mining Stock Education podcast that interviews many of the top names in the natural resource sector and profiles quality mining investment opportunities. Powers is an avid resource investor with an entrepreneurial background in sales, management and small business development. His latest interviews can be found at MiningStockEducation.com.
Disclosure: 1) Bill Powers: I, or members of my immediate household or family, own shares of the following companies mentioned in this article: Silver One Resources. I personally am, or members of my immediate household or family are, paid by the following companies mentioned in this article: None. My company has a financial relationship with the following companies mentioned in this article: Silver One Resources is a Mining Stock Education advertiser. 2) The following companies mentioned in this article are billboard sponsors of Streetwise Reports: None. Click here for important disclosures about sponsor fees. 3) Statements and opinions expressed are the opinions of the author and not of Streetwise Reports or its officers. The author is wholly responsible for the validity of the statements. The author was not paid by Streetwise Reports for this article. Streetwise Reports was not paid by the author to publish or syndicate this article. The information provided above is for informational purposes only and is not a recommendation to buy or sell any security. Streetwise Reports requires contributing authors to disclose any shareholdings in, or economic relationships with, companies that they write about. Streetwise Reports relies upon the authors to accurately provide this information and Streetwise Reports has no means of verifying its accuracy. 4) This article does not constitute investment advice. Each reader is encouraged to consult with his or her individual financial professional and any action a reader takes as a result of information presented here is his or her own responsibility. By opening this page, each reader accepts and agrees to Streetwise Reports’ terms of use and full legal disclaimer. This article is not a solicitation for investment. Streetwise Reports does not render general or specific investment advice and the information on Streetwise Reports should not be considered a recommendation to buy or sell any security. Streetwise Reports does not endorse or recommend the business, products, services or securities of any company mentioned on Streetwise Reports. 5) From time to time, Streetwise Reports LLC and its directors, officers, employees or members of their families, as well as persons interviewed for articles and interviews on the site, may have a long or short position in securities mentioned. Directors, officers, employees or members of their immediate families are prohibited from making purchases and/or sales of those securities in the open market or otherwise from the time of the interview or the decision to write an article until three business days after the publication of the interview or article. The foregoing prohibition does not apply to articles that in substance only restate previously published company releases.
The content produced by Bill Powers and Mining Stock Education LLC is for informational purposes only and is not to be considered personal, legal or investment advice or a recommendation to buy or sell securities or any other product. It is based on opinions, public filings, current events, press releases and interviews but is not infallible. It may contain errors and we offer no inferred or explicit warranty as to the accuracy of the information presented. If personal advice is needed, consult a qualified legal, tax or investment professional. Do not base any investment decision on the information contained on MiningStockEducation.com, our podcast or our videos. We usually hold equity positions in and are compensated by the companies we feature and are therefore biased and hold an obvious conflict of interest. MiningStockEducation.com may provide website addresses or links to websites and we disclaim any responsibility for the content of any such other websites. The information you find on MiningStockEducation.com is to be used at your own risk. By reading MiningStockEducation.com, you agree to hold MiningStockEducation.com, its owner, associates, sponsors, affiliates, and partners harmless and to completely release them from any and all liabilities due to any and all losses, damages, or injuries (financial or otherwise) that may be incurred.