Presidential candidate Michael Bloomberg’s proactive cryptocurrency plans place him on the right side of financial history, affirms the CEO of one of the world’s largest independent financial services and advisory organizations.
The chief executive and founder of deVere Group is speaking out after the New York-based billionaire presidential hopeful proposed creating a regulatory framework for cryptocurrencies in a new financial regulation plan.
The plan notes: “Cryptocurrencies have become an asset class worth hundreds of billions of dollars, yet regulatory oversight remains fragmented and undeveloped.”
Mr Green comments: “Michael Bloomberg is, to date, the only candidate to become president of the world’s largest economy who has devised a coherent plan for cryptocurrencies.
“The staggering pace of the digitalization of economies and our professional and personal lives underlines that there will be – must be – growing demand for digital, global, borderless money.
“Indeed, digital currencies are now almost universally regarded as the future of money.
“This is why most central banks around the world – including the Federal Reserve – major financial institutions, tech giants, and multinationals are all getting involved.
“As such, Bloomberg’s proactive and progressive approach, which could be the first step to providing regulations to protect consumers and prevent illicit activity in the new age, must be championed.”
Nigel Green has long been a vocal advocate for cryptocurrency regulation.
He notes: “Digital currencies are already becoming mainstream and that means that they should adhere to the same standards as the rest of the financial system.
“Regulation is necessary as it will provide further protection for the growing number of people using cryptocurrencies, the less likely it will be that criminals will use these digital payment methods, the less potential risk there will be for the disruption of global financial stability, and the more potential opportunities there will be for higher economic growth and activity in those countries which introduce it.”
Last year, the deVere CEO criticised President Donald Trump who took to Twitter to say: “I am not a fan of Bitcoin and other cryptocurrencies, which are not money, and whose value is highly volatile and based on thin air.”
In response, Mr Green blasted: “Does the President seriously think that traditional, fiat currencies are the way forward?”
Nigel Green concludes: “Cryptocurrencies are redefining and reshaping the financial system. The Leader of the Free World needs to be ahead of the curve and on the right side of history on such a fundamental issue.”
About:
deVere Group is one of the world’s largest independent advisors of specialist global financial solutions to international, local mass affluent, and high-net-worth clients. It has a network of more than 70 offices across the world, over 80,000 clients and $12bn under advisement
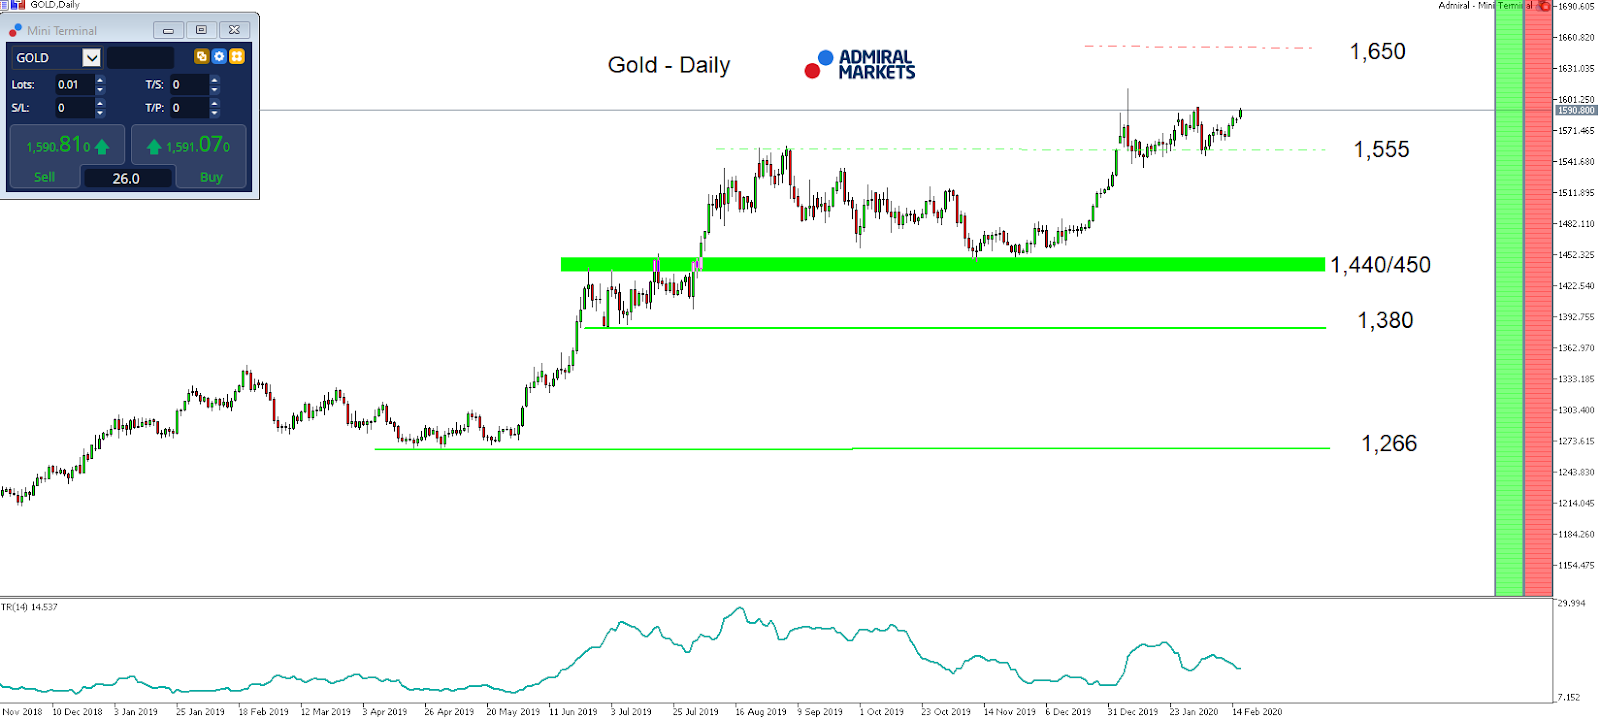
Wednesday, today, stands to be a very interesting day for Gold traders. Since several Fed members are planned to give speeches, and the FOMC minutes from the Fed’s January 30th rate decision is to be published.
In general, the outlook in Gold turned very positive over the first two weeks of February, since the precious metal’s reaction to the solid US economic data, as well as the solid reaction to Fed chairman Powell’s neutral (and, in our opinion, Gold-bearish) comments at the semi-annual testimony in front of the Congress last week.
His comments stated that the current rate policy stance is appropriate, but market participants still expect the Fed to cut rates at least once, by 25 basis points, in 2020 (according to the Fed Watch Tool). Any dovish hints, especially from the FOMC minutes this evening, are a potential bullish driver, bringing the region around 1,600 USD into our focus again.
The main driver for such a move could certainly put pressure on 10-year US Treasury yields and an attack or even possibly a break below the technically important level of 1.50%.
If we get to see a break lower here, a dynamic move lower in US yields should follow, favouring gains in Gold then.
Technically, Gold stays clearly bullish as long as the precious metal trades above its daily trend-support around 1,440/450 USD, keeping the potential next target on the upside around 1,650/700 USD active.
If we get to see a short-term drop below 1,550 USD, the picture would only darken short-term and favour Intraday-Short engagements, activating the region around 1,510/515 USD:
Source: Admiral Markets MT5 with MT5-SE Add-on Gold Daily chart (between November 16, 2018, to February 18, 2020). Accessed: February 18, 2020, at 10:00pm GMT – Please note: Past performance is not a reliable indicator of future results, or future performance.
In 2015, the value of Gold fell by 10.4%, in 2016, it increased by 8.1%, in 2017, it increased by 13.1%, in 2018, it fell by 1.6%, in 2019, it increased by 18.9%, meaning that after five years, it was up by 28%.
Discover the world’s #1 multi-asset platform
Admiral Markets offers professional traders the ability to trade with a custom, upgraded version of MetaTrader 5, allowing you to experience trading at a significantly higher, more rewarding level. Experience benefits such as the addition of the Market Heat Map, so you can compare various currency pairs to see which ones might be lucrative investments, access real-time trading data, and so much more. Click the banner below to start your FREE download of MT5 Supreme Edition!
Disclaimer: The given data provides additional information regarding all analysis, estimates, prognosis, forecasts or other similar assessments or information (hereinafter “Analysis”) published on the website of Admiral Markets. Before making any investment decisions please pay close attention to the following:
This is a marketing communication. The analysis is published for informative purposes only and are in no way to be construed as investment advice or recommendation. It has not been prepared in accordance with legal requirements designed to promote the independence of investment research, and that it is not subject to any prohibition on dealing ahead of the dissemination of investment research.
Any investment decision is made by each client alone whereas Admiral Markets shall not be responsible for any loss or damage arising from any such decision, whether or not based on the Analysis.
Each of the Analysis is prepared by an independent analyst (Jens Klatt, Professional Trader and Analyst, hereinafter “Author”) based on the Author’s personal estimations.
To ensure that the interests of the clients would be protected and objectivity of the Analysis would not be damaged Admiral Markets has established relevant internal procedures for prevention and management of conflicts of interest.
Whilst every reasonable effort is taken to ensure that all sources of the Analysis are reliable and that all information is presented, as much as possible, in an understandable, timely, precise and complete manner, Admiral Markets does not guarantee the accuracy or completeness of any information contained within the Analysis. The presented figures refer that refer to any past performance is not a reliable indicator of future results.
The contents of the Analysis should not be construed as an express or implied promise, guarantee or implication by Admiral Markets that the client shall profit from the strategies therein or that losses in connection therewith may or shall be limited.
Any kind of previous or modeled performance of financial instruments indicated within the Publication should not be construed as an express or implied promise, guarantee or implication by Admiral Markets for any future performance. The value of the financial instrument may both increase and decrease and the preservation of the asset value is not guaranteed.
The projections included in the Analysis may be subject to additional fees, taxes or other charges, depending on the subject of the Publication. The price list applicable to the services provided by Admiral Markets is publicly available from the website of Admiral Markets.
Leveraged products (including contracts for difference) are speculative in nature and may result in losses or profit. Before you start trading, you should make sure that you understand all the risks.
Preparing for the publication of data on inflation
A negative factor for the Swedish krona is the increase in unemployment in Sweden to 7.5% in January 2020 from 6% in December last year. This indicator reached the high since March 2019. This reduces the likelihood of a rate hike by the Swedish Central Bank (Riksbank) at the next meeting on April 28. Now the rate is equal to zero. Meanwhile, in December, inflation in Sweden reached 1.8% year over year and approached the target level of 2%. On Wednesday, February 19, inflation data for January will be released both in Sweden and in Britain, which may affect the exchange rate of the GBPSEK. In December, inflation in Britain was 1.3% at the rate of the Bank of England + 0.75%. The British pound shows an uptrend after the recent appointment of Britain’s new finance minister Rishi Sunak. Investors believe that his budget program will support economic growth.
Most Asian stock indices are advancing, refusing to follow Wall Street’s cues after the S&P 500 and the Dow Jones index declined after returning from an extended weekend. Most Asian currencies however are weaker against the US Dollar, laying bare a truer reflection of investors’ underlying concerns over the coronavirus outbreak.
Covid-19 is set to frame the market action and policymakers’ reactions around the world over the near-term. The global economic outlook remains mired in uncertainty at this point in time, with coronavirus-related warnings emanating out of corporate America, the Eurozone economy, and Asian governments. In the interim, Asian currencies are expected to hold a bias for more softness so as to help ease some of the pressures off the respective economies.
Scarce challengers to King Dollar’s throne
The Dollar index has continued on its unrelenting advance this month, as it now carves out a larger gap above the 99 psychological level. With the Empire Manufacturing Index already hitting a nine-month high, the Dollar could climb further if Thursday’s Philadelphia Fed Business Outlook shows a better-than-expected reading for February.
The upcoming FOMC minutes release isn’t likely to hold significant sway over the Dollar, barring any surprise reveals from the Fed’s January policy meeting that could cause markets to reprice their expectations for the next US interest rate adjustment. With the Euro, the biggest component in the Dollar index, offering little resistance, coupled with the risk-aversion stemming from the coronavirus outbreak, the US Dollar has scant reason to come off these elevated levels.
Gold to remain well-bid amid coronavirus-related concerns
Gold has finally breached the $1600 psychological level for the first time since the US airstrike in Iraq, as investors increase their exposure to safe haven assets amid swirling concerns over the Covid-19 outbreak. The technical picture shows more headroom for Bullion before it breaks into overbought territory, which could see Bullion bulls testing the $1610 handle as long as markets persist with the risk-off mode.
Oil’s outlook clouded by coronavirus concerns
Brent futures are set to cap six consecutive days of gains, edging closer to the $60/bbl handle, as the latest US sanctions on a Rosneft unit offer Oil prices a gentle lift. Oil’s supply-demand fundamentals remain mired in uncertainty: OPEC+ has yet to officially decide on whether to deepen supply cuts, while investors are still trying to ascertain the toll on global demand from the coronavirus outbreak.
Disclaimer: The content in this article comprises personal opinions and should not be construed as containing personal and/or other investment advice and/or an offer of and/or solicitation for any transactions in financial instruments and/or a guarantee and/or prediction of future performance. ForexTime (FXTM), its affiliates, agents, directors, officers or employees do not guarantee the accuracy, validity, timeliness or completeness, of any information or data made available and assume no liability as to any loss arising from any investment based on the same.
Over the last half year or so, a number of analysts, well-heeled individuals, and mega-hedge fund managers have been taking a shine to silver. So far the “restless metal” hasn’t been letting on that it’s noticed.
It’s understandable why someone who either has not yet begun to commit funds to building a physical silver position – or who has not completed his or her ownership program – might think it best to wait and see if the price starts rising, thus validating the silver bulls’ call. But this kind of strategy could end up being a big financial mistake on several counts.
And worse yet, Mr. Market could decide to whisk away today’s prices – and the relative availability of investment grade silver – to the point that you’ll never even take a position at all.
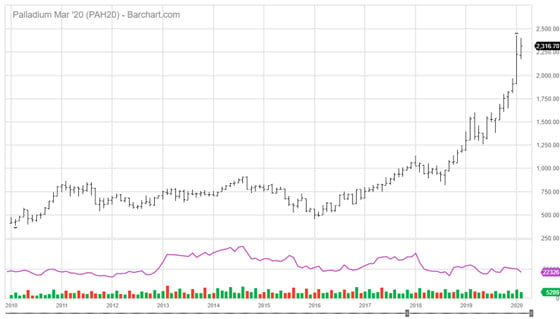
To get a sense of how you might feel as you watch, and watch, and watch while silver makes its long overdue, third, and almost certainly largest levitation toward the ultimate high since the start of its rise in 2001, please examine the palladium chart below.
10 Year Monthly Palladium (Courtesy barcharts.com)
After spending 5 years in a $300 price range, palladium decided in December 2016 to put in a long-term bottom around the time that gold and silver were doing something similar.
Then, again like gold and silver at the time, it rallied, moving to a several years’ high around $850… but kept on going. Gold and silver faded away for the next 18 months, putting in a double bottom in late 2018.
By the way, during this entire time, David Morgan, provided guidance for his subscribers – be they holders of The Morgan Report Premium, Mastermind, or Insiders’ Memberships – in how to profitably trade these multiple hundred-dollar swings via futures, options, stocks, or physical palladium rounds and bullion itself.
Given David Morgan’s expertise in these areas, look to him being able to effectively help current and new subscribers alike do the same thing with the coming explosive upside run in silver and gold.
In January 2018, palladium seemed to build out a major top around $1,150 – almost exactly where it had done so twenty years before! Just about everyone (me included) watched with trepidation as that level once again turned back prices and the metal declined by over $300.
What happened next will be something chartists ponder for a long time to come. Within a matter of months, palladium proceeded to easily punch through that old $1,150 “top”… and to this day, almost 18 months later – continues to rise, seldom pausing, to, at this writing over $2,550… more than twice as high as it had ever traded before!
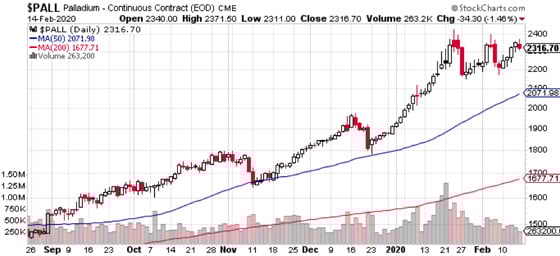
Daily $Palladium (Courtesy Stockcharts.com)
Now look at the nearby daily palladium chart. Do you think it would have been easy to “take a profit” – just about anywhere along the way?
On the other side of the coin, how many people who sold out around $1,000 ever got back on to experience any of this relentless additional $1,450 “profit launch”? More than likely, very, very few.
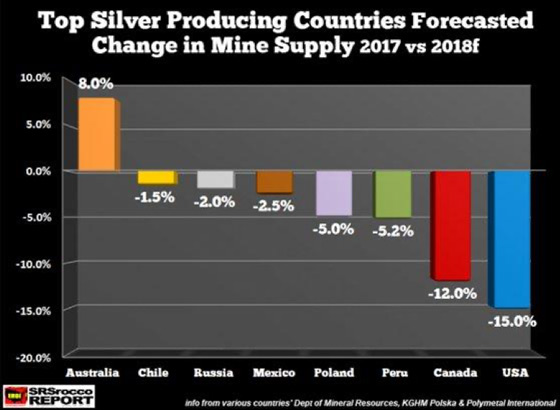
Silver’s Supply-Demand Metrics look to be building the same fundamental – and technical picture as palladium.
For several years, analysts warned of a coming shortage and price spike for palladium.
With silver coming off its fourth consecutive year of lower production in most of the big mining camps and robust Chindian, Eurozone, and now North American demand, silver’s building mirror image behavior to that of palladium looks more and more likely.
The top 10 silver producing countries are Peru, Bolivia, Australia, Argentina, Mexico, Chile, Poland, China, Russia and Guatemala. And get this… in nine of these countries, silver production has been falling for the past 4 consecutive years!
Rounding out the picture are these salient demand factors.
Supply from scrap sources is at a 20-year low.
Silver fabrication (manufacturing) demand is just below record levels.
Solar panels’ silver demand has risen for 7 straight years (2013-2019).
Primary silver producer grams/ton yield has fallen by 50% in the last decade.
And the demand clincher? About 75% of the world’s annual new silver supply comes from base metals’ production – copper, lead, and zinc. When, not if, investment demand spikes in competition with industrial needs, there’s going to be a problem…
Dr. Peter Megaw, perhaps the person who has discovered more high-grade silver deposits than anyone else on the planet, puts it this way:
When the price of silver moves, you can’t ratchet up the production from the world’s largest gold, copper and lead-zinc mines to pick up more silver. The only place you have to take up the slack on the supply side is [the small number of] primary silver mines.
And don’t forget the rising “hidden” costs you’ll pay, the longer you wait. Higher prices, and demand outstripping supply, both increase the premium (charge above spot).
In the case of American Silver Eagles, seigniorage – what it costs the U.S. Mint to produce a coin – has already risen by 50% in the last decade, so you can be sure this seldom-considered price factor will continue rising too.
Jeff Clark, one of the best-informed and most articulate analysts in the space, calls the current silver price “A bottle rocket awaiting liftoff.”
He says: “Supply and demand in the silver market are going in different directions. I cannot find a period in modern history where (they) were more out of balance than now. With the setup currently in place, the wick that leads to silver’s rise sits precariously by a roaring fire.”
So, don’t let yourself fall into the trap of waiting until the writing is on the wall – and on the charts – to purchase the silver you want.
It would be wise to ask yourself right now, whether you’d like to participate as an owner in silver’s oncoming multi-year run up into record territory, or instead (try to) be content sitting back and watching the charts print out a bigger and bigger profit stream, just like palladium has been doing for almost three years!
The Money Metals News Service provides market news and crisp commentary for investors following the precious metals markets.
In the first section of this article, we highlighted three key components/charts illustrating why the “rally to the peak” is very likely a result of a continued Capital Shift away from risk and into the US stock market as an attempt to avoid foreign market growth concerns. This method of pouring capital into the US stock market is a process that is driving incredible asset rallies in the US technology sector. Already the US technology sector (FANG and our Custom Technology Index charts) are up almost 15% in 2020. How long will it last and when will it end?
Recently, China has revised the Coronavirus data with a sharp increase in infection cases – now over 40,000. We believe the true number of infections in China are currently well above 250,000 from video content and other data we’ve researched. We believe economic data originating from China for January and February 2020 will show a dramatic 60% to 80%+ decrease in activity for many of the major cities. Satellite technology suggests manufacturing and consumer activity in most major Chinese cities is only a fraction of what would be considered normal – 10% to 20% or normal levels.
This means the manufacturing capacities in China have collapsed and that supply to the rest of the world will collapse as well. This means major electronics manufacturers and suppliers will suddenly quickly experience shortages and outages very shortly. This is why we believe the technology sector may come under severe pressure over the next 6+ months and why we believe the “high-flying” technology sector may be one of the biggest sector rotations of 2020.
Just how much of a “collapse” are we talking about? How can anyone attempt to quantify the true scope of this potential “black swan” event and how it may result in sector rotation?
Let’s start with some of the basics. First, the global economy has been focused on Chinese manufacturing and production of goods for more than the past 20+ years. Over the past 10 to 15+ years, the Chinese economy has become the central hub of manufacturing and supply for some of the largest economies on the planet. At this point in time, nearly every nation on the planet relies on China in some form for some essential goods that support their local economies.
This image showing the size and scope of global economies may highlight just how interconnected we really are. The Chinese economy is 15.4% of the total global economy when taken as a whole compared to other global economies. Yet, China supplies a very large number of these other nations with cheap goods, essential components for industry and manufacturing as well as a very large number of everyday essential items for consumers. So, when we attempt to consider a “shut-down” of the Chinese economy as they attempt to deal with this virus, try to think about how long it would take for the supply chain to dry up and then what?
Try to take a moment and think about the total scope of what we’re dealing with in regards to this Corona Virus outbreak. Take a minute to review this graphic from InvestmentWatchBlog.com showing some of the “Best” US firms and how many rely on China for manufacturing/supply of critical components or generate a large portion of their revenues from China.
It has been over 45 days since the end of 2019. China knew about this virus fairly early in December 2019. So, in reality, it has been over 75 days since this outbreak first started. The data accumulated by Johns Hopkins CSSE started on January 20, 2020. Since that time, China has experienced a more than 4000% increase in new Corona Virus cases – that is only about 21 days. The number of infected has risen to well over 64,000 and we believe that number (reported by the Chinese government) may be only a fraction (1/8th to 1/6th) of the real infected rate.
Not all technology companies rely on China to supply products and software. Many technology companies have strong core business enterprises that are independent of Chinese manufacturing. Yet we continue to believe the disruption in manufacturing and supply from China will disrupt forward earnings data enough to potentially send the technology sector much lower than current levels. Additionally, if capital rushes out of technology in search of a more suitable opportunity – where will that capital find a new home?
What happens if this “shut down” of the Chinese economy lasts for more than 6+ months and what happens to the world economy as a result of this virus outbreak? In Part III of this research article, we’ll try to share our insight a bit further and attempt to show you where real opportunity exists as this rotation plays out.
Join my Swing Trading ETF Wealth Building Newsletter if you like what you read here and ride my coattails as I navigate these financial markets and build wealth while others lose nearly everything they own.
NOTICE: Our free research does not constitute a trade recommendation or solicitation for our readers to take any action regarding this research. It is provided for educational purposes only. Our research team produces these research articles to share information with our followers/readers in an effort to try to keep you well informed. Visit our web site (www.thetechnicaltraders.com) to learn how to take advantage of our members-only research and trading signals.
Qatar postponed the construction of new LNG terminals
Earlier, Qatar Petroleum, a state-owned company of Qatar, planned to start expanding liquefied natural gas terminals by 60% in 2020, and by 2027 to 126 million tons per year. The cost of the project was estimated at approximately $60 billion. Its implementation has been postponed because of the decline in world gas prices amid the coronavirus infection in China. Amid this, LNG exports from the US are rising. In 2018, it increased by 53%, and in 2019 – by 68%. In 2020, an increase of another 33% is projected. A cold snap is expected in the US at the end of February, which may increase short-term demand for gas for heating.
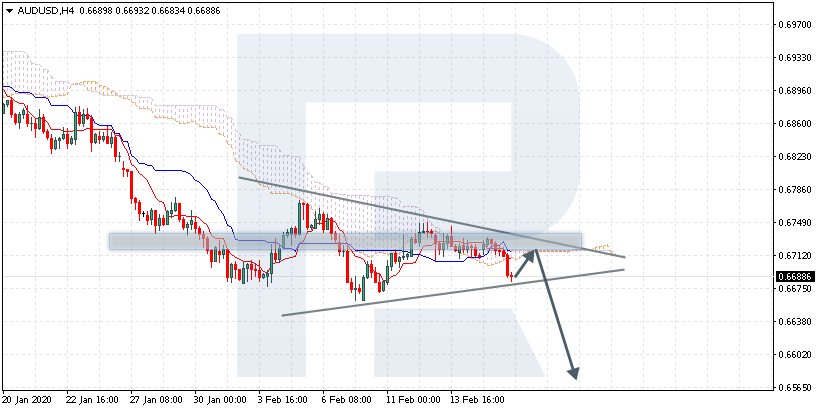
AUDUSD is trading at 0.6688; the instrument is moving below Ichimoku Cloud, thus indicating a descending tendency. The markets could indicate that the price may test the cloud’s downside border at 0.6710 and then resume moving downwards to reach 0.6565. Another signal to confirm further descending movement is the price’s rebounding from the resistance level. However, the scenario that implies further decline may be canceled if the price breaks the cloud’s upside border and fixes above 0.6755. In this case, the pair may continue growing towards 0.6835. After breaking the support area and fixing below 0.6645, the price may resume moving upwards and break the downside border of a Triangle pattern.
NZDUSD, “New Zealand Dollar vs US Dollar”
NZDUSD is trading at 0.6415; the instrument is moving below Ichimoku Cloud, thus indicating a descending tendency. The markets could indicate that the price may test the cloud’s downside border at 0.6420 and then resume moving downwards to reach 0.6275. Another signal to confirm further descending movement is the price’s rebounding from the descending channel’s upside border. However, the scenario that implies further decline may be canceled if the price breaks the cloud’s upside border and fixes above 0.6485. In this case, the pair may continue growing towards 0.6565.
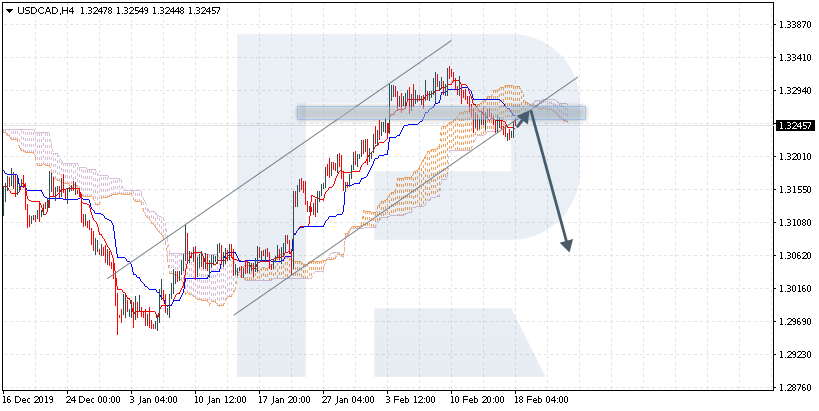
USDCAD, “US Dollar vs Canadian Dollar”
USDCAD is trading at 1.3245; the instrument is moving below Ichimoku Cloud, thus indicating a descending tendency. The markets could indicate that the price may test the cloud’s downside border at 1.3255 and then resume moving downwards to reach 1.3065. Another signal to confirm further descending movement is the price’s rebounding from the rising channel’s downside border. However, the scenario that implies further decline may be canceled if the price breaks the cloud’s upside border and fixes above 1.3325.
Attention! Forecasts presented in this section only reflect the author’s private opinion and should not be considered as guidance for trading. RoboForex LP bears no responsibility for trading results based on trading recommendations described in these analytical reviews.
As we can see in the H4 chart, the descending tendency continues. By now, EURUSD has completed several reversal candlestick patterns, such as Inverted Hammer, close to the support level. Right now, the pair may start reversing. We may assume that later the price may test the resistance level at 1.0920 and then resume its decline to reach 1.0790. However, one shouldn’t exclude the possibility that the price may continue falling without reversing and forming any rising structures.
USDJPY, “US Dollar vs. Japanese Yen”
As we can see in the H4 chart, USDJPY is still moving inside the rising channel. After forming a Hanging Man pattern, the pair has reversed and is currently trading sideways. The current situation implies that the pair may finish the correction and resume growing to reach the resistance level at 110.20. At the same time, the pair may choose another scenario, according to which it is expected to return to 109.20 without testing the resistance level.
EURGBP, “Euro vs. Great Britain Pound”
As we can see in the H4 chart, EURGBP continues trading close to the support level, where it has formed several reversal patterns, such as Harami. Right now, we may assume that after reversing the price may grow towards 0.8393. However, one shouldn’t exclude an opposite scenario, which implies that the instrument may break the support level and updates its closest lows. In this case, that the pair may continue the descending tendency without any corrections to reach the closest target at 0.8282.
Attention! Forecasts presented in this section only reflect the author’s private opinion and should not be considered as guidance for trading. RoboForex LP bears no responsibility for trading results based on trading recommendations described in these analytical reviews.
The EUR/USD currency pair continues to consolidate after a prolonged decline. There is no defined trend. Investors expect additional drivers. The local support and resistance levels are 1.08250 and 1.08650, respectively. Technical correction is not ruled out in the nearest future. Today participants of financial markets will evaluate a number of important indicators of business activity in Germany and Eurozone. We recommend opening positions from key levels.
The Economic News Feed for 18.02.2020:
– ZEW indices of economic sentiment (EU, GER) – 12:00 (GMT+2:00);
Indicators do not give accurate signals: the price is testing 50 MA.
The MACD histogram is in the negative zone, which indicates a bearish sentiment.
The Stochastic Oscillator is in the neutral zone, the %K line crosses the %D line. There are no signals at the moment.
Trading recommendations
Support levels: 1.08250, 1.08000
Resistance levels: 1.08650, 1.09000, 1.09400
If the price fixes below 1.08250, expect further decline toward 1.0800-1.07700.
Alternatively, the quotes could grow toward 1.09000-1.09200.
The GBP/USD currency pair
Technical indicators of the currency pair:
Prev Open: 1.30322
Open: 1.30033
% chg. over the last day: -0.35
Day’s range: 1.29857 – 1.30070
52 wk range: 1.1959 – 1.3516
GBP/USD quotes have gone down. The trading instrument has updated the local lows. Sterling is now being consolidated. The key range is 1.29800-1.30150. Today participants of financial markets will evaluate the report on the UK labor market. We recommend you to pay attention to the difference between actual and forecast values of indicators. Positions should be opened from key levels.
At 11:30 (GMT+2:00) UK will publish the labor statistics.
The price has fixed below 100 MA, which signals the strength of the sellers.
The MACD histogram is in the negative zone and below the signal line, which gives a strong signal to sell GBP/USD.
The Stochastic Oscillator is in the neutral zone, the %K line is below the %D line, which also indicates a bearish mood.
Trading recommendations
Support levels: 1.29800, 1.29450, 1.29200
Resistance levels: 1.30150, 1.30650, 1.31000
If the price fixes below 1.29800, GBP/USD quotes are expected to fall further. Potential for movement to 1.29500-1.29200.
Alternatively the quotes could grow toward 1.30500-1.30700.
The USD/CAD currency pair
Technical indicators of the currency pair:
Prev Open: 1.32500
Open: 1.32330
% chg. over the last day: -0.06
Day’s range: 1.32296 – 1.32554
52 wk range: 1.2949 – 1.3566
The technical pattern on the USD/CAD currency pair is still ambiguous. The CAD is being traded in a long flat. Currently, the following local support and resistance levels can be distinguished: 1.32400 and 1.32650. The trading instrument has a downside potential. We recommend you to pay attention to the dynamics of oil quotes. Positions should be opened from key levels.
Today the news background on the Canadian economy is quite calm.
Indicators do not give accurate signals: the price has crossed 50 MA and 100 MA.
MACD has crossed to the positive zone, which indicates the development of bullish moods.
The Stochastic Oscillator is located in the neutral zone, the %K line has crossed the %D line. There are no signals at the moment.
Trading recommendations
Support levels: 1.32400, 1.32250, 1.32000
Resistance levels: 1.32650, 1.32850, 1.33000
If the price fixes below 1.32400, expect the quotes to fall toward 1.32000.
Alternatively, the quotes could grow toward 1.32800-1.33000.
The USD/JPY currency pair
Technical indicators of the currency pair:
Prev Open: 109.846
Open: 109.876
% chg. over the last day: +0.02
Day’s range: 109.657 – 109.877
52 wk range: 104.45 – 113.53
USD/JPY currency pair is still moving sideways. The technical picture is ambiguous. At the moment local support and resistance levels are at 109.650 and 109.850, respectively. Investors are waiting for additional drivers. We recommend you to keep track of current information regarding the coronavirus spread in China. Positions should be opened from key levels.
Publication of important economic releases from Japan is not planned.
Indicators do not give an accurate signal: 50 MA crossed 100 MA.
The MACD histogram has crossed the negative zone, indicating a bearish sentiment.
The Stochastic Oscillator is located in the neutral zone, the %K line is above the %D line, which gives a signal to buy USD/JPY.
Trading recommendations
Support levels: 109.650, 109.550, 109.300
Resistance levels: 109.850, 110.000, 110.100
If the price fixes below 109.650, expect the quotes to rise toward 109.400-109.200.
Alternatively, the quotes will grow toward 110.100-110.300.