China’s central bank lowered its new policy rate by 10 basis points to 4.05 percent, as expected and signaled through recent policy moves, its fourth cut in the 1-year Loan Prime Rate (LPR) since August 2019.
The 5-year LPR, used as a benchmark to price mortgages, was cut 5 basis points to 4.75 percent, according to a brief statement on its website.
Since August last year, when People’s Bank of China (PBOC) designated LPR as its new benchmark lending rate, it has been cut by an effective 30 basis points.
Although PBOC cut its key rate today, it did not conduct any reverse repo operations for the second day in a row, adding “liquidity is reasonable and adequate in the current banking system.”
On Feb. 19 PBOC said short-term liquidity that had been injected into the market after the Spring Festival – this year on Jan. 25 – had been soaked up with the maturing of reverse repos.
China’s central bank, along with the government, have been tackling the outbreak of the coronavirus, or COVID-19 as it is officially called, since Feb. 4 when PBOC first began injecting liquidity into the banking system and cutting rates on its short-term reverse repurchase facilities to support economic activity that has been hit hard by quarantines and shutdowns of major parts of the economy.
Initially PBOC injected 1.2 trillion through 7-day and 14-day reverse repo operations at a rate that was 10 basis point below the previous rate from November 2019.
Then PBOC launched a 300 billion yuan lending program to provide low-cost loans to companies involved in fighting and affected by the virus, with the government subsidizing half of companies’ interest payments to ensure actual financing costs of less than 1.6 percent.
On Monday PBOC lowered its 1-year medium-term-lending (MLF) lending facility by the same 10 basis points to 3.15 percent, foreshadowing today’s cut in LPR.
In August 2019, when PBOC designated LPR it as its new benchmark lending rate, it also rejigged its system for deriving LPR and set is as a spread to MLF.
Days after announcing its new method for calculating LPR last year, PBOC set it at 4.25 percent, 6 basis points below the old LPR and 10 points below the previous benchmark lending rate.
LPR was cut a further 5 basis points in September 2019 and then another 5 points in November, a few weeks after the MLF rate also was cut 5 points.
PBOC announces LPR on the 20th of each month and it was then maintained in both December and January when the MLF rate was also maintained.
PBOC has effectively lowered its policy rate by 30 basis points since August 2019.
US stock market closed at record highs again on Wednesday on upbeat reports. Minutes from the Federal Reserve’s January meeting showed that Fed officials believed the US economy appeared stronger in late January than expected. The S&P 500 advanced 0.5% to fresh record 3386.15. The Dow Jones industrial average gained 0.4% to 29348.03. Nasdaq rose 0.9% to new record 9817.18. The dollar strengthening was intact as US producer prices jumped 0.5% in January, its biggest increase in 15 months. The live dollar index data show the ICE US Dollar index, a measure of the dollar’s strength against a basket of six rival currencies, rose 0.2% to 99.59 and is higher currently. Futures on stock indexes point to higher openings today.
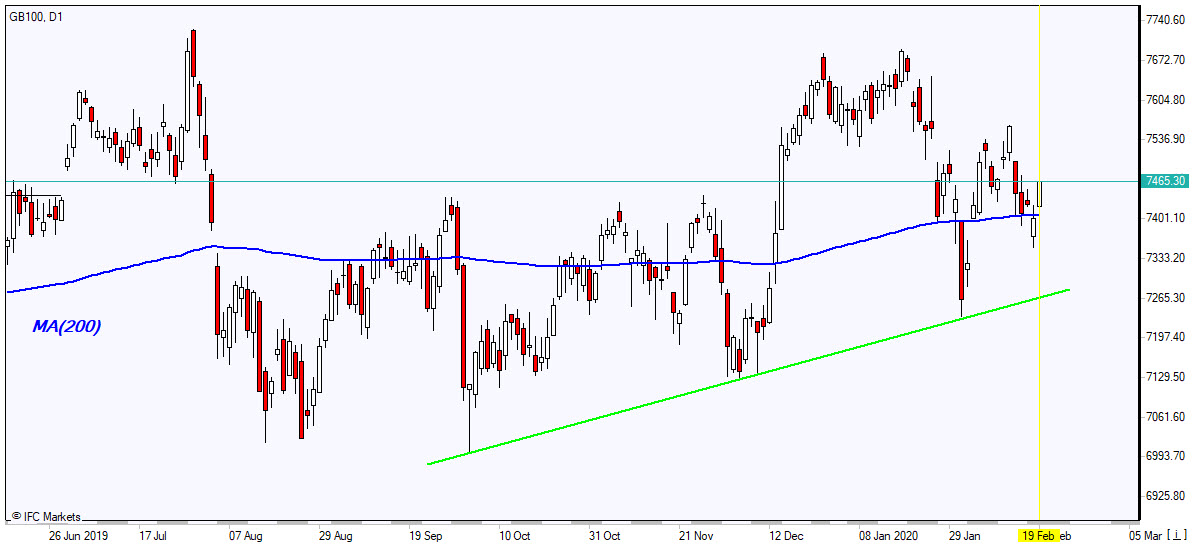
FTSE 100 led European indexes recovery
European stocks ended higher on Wednesday. EUR/USD reversed higher yesterday while GBP/USD accelerated its decline with both pairs lower currently. The Stoxx Europe 600 ended up 0.8% led by technology shares as EU opened a 12-week period of discussion aimed at better understanding how to protect EU citizens from what it describes as the negative impacts of AI. Germany’s DAX 30 rose 0.8% to 13789. France’s CAC 40 advanced 0.9% while UK’s FTSE 100 gained 1.1% to 7457.02 as UK inflation unexpectedly hit a six-month high of 1.8% in January
Shanghai Composite leads Asian indexes recovery
Asian stock indices are mostly higher today as new cases of coronavirus infection in China reported over the last 24 hours declined for a second day. Nikkei added 0.3% to 23479.15 as yen continued sliding against the dollar. Markets in China are mixed as the central bank of China cut its benchmark one-year loan prime rate by 10 basis points: Shanghai Composite Index is 1.8% higher while Hong Kong’s Hang Seng Index is down 0.3%. Australia’s All Ordinaries Index extended gains 0.3% as Australian dollar accelerated its decline against the greenback.
Brent futures prices are higher today despite the American Petroleum Institute industry group report yesterday US crude stocks rose by 4.16 million barrels las week. Prices rose as US imposed sanctions on trading brokerage of Russian oil giant Rosneft: April Brent added 2.4% to $59.12 on Wednesday.
Gold rises despite Dollar strengthening
Gold prices are extending gains while dollar inches up. The price of an ounce of gold for April delivery gained 0.5% to $1,611.80 Wednesday.
Note: This overview has an informative and tutorial character and is published for free. All the data, included in the overview, are received from public sources, recognized as more or less reliable. Moreover, there is no guarantee that the indicated information is full and precise. Overviews are not updated. The whole information in each overview, including opinion, indicators, charts and anything else, is provided only for familiarization purposes and is not financial advice or а recommendation. The whole text and its any part, as well as the charts cannot be considered as an offer to make a deal with any asset. IFC Markets and its employees under any circumstances are not liable for any action taken by someone else during or after reading the overview.
Matt Geiger of MJG Capital examines the investment thesis for royalty companies during the current precious metals market upswing.
Perhaps the most significant development in the mining industry over the past twenty years has been the rise of the royalty business model. For those unfamiliar, a royalty is the right to receive a percentage of production from a given mining operationmost often in the form of a net smelter royalty (NSR) where the royalty owner is entitled to a defined percentage of the gross revenue, less a proportionate share of transportation, refining and smelting costs. Royalty companies, as one can imagine, make their living by acquiring a portfolio of attractive royalty assets and then either (a) leveraging their portfolio for access to bigger and better royalty deals or (b) returning the cash to shareholders through buybacks or dividends.
Investors love this business model for a multitude of reasons. The first is diversification, as the largest royalty companies have dozens of cash-flowing royalties (with dozens more nearing cash flow) held by different operators in different jurisdictions. The second is that the business is extremely high margin, with the world’s largest royalty companies generating as much as $3.5 million in net profit per employee. Third is the scalability of the business because, as royalty companies grow in size, their cost of capital drops and larger opportunities become available. Another benefit is that royalty companies don’t share nearly as much operational risk as their counterparties, as they bear no responsibility for funding mine development and sustaining capex. Finally, royalty companies get to participate in exploration upside entirely for free, which provides “a free perpetual option on discoveries” in the words of Franco-Nevada Corp. (FNV:TSX; FNV:NYSE) founder Pierre Lassonde.
This raises a few questions. The first surrounds what the reign of the royalty business model means for the mining industry generally. On one hand, royalty companies have done a service by providing a source of capital to an industry starved for funds. It is no secret that the past decade for the mining industry has been a rough one, and traditional avenues to raise capital have largely dried up. Over this period, royalty companies have stepped in and provided billions of dollars of funding to both producers and developers alike. Money is the lifeblood of this extremely capital-intensive business.
But this comes with a cost. The royalty companies have no doubt been sucking away investment dollars that otherwise would have been deployed into traditional mining companies. This competition will only become more intense as the royalty complex continues to grow in mass.
Additionally, there have been plenty of cases of royalty companies getting “too good of a deal,” and hence encumbering assets to the point where they are not worth developing. In these cases the burden, of course, falls far more unevenly on the operator (who may only have 12 assets) than on the well-diversified royalty company.
Another key question is how long this outperformance among the royalty names will continue. That will ultimately depend on the length of the precious metals bull market that is currently underway. Based on the duration of past bull cycles, I’m of the view that we have a few more years to go. Were this to be the case, the royalty names may continue to outperform for another year or two before the operators get their revenge in the later stages of the bull market.
But even if the operators get their revenge late in the cycle, I still expect the royalty companies to become overvalued (perhaps massively so) in the years aheadto the extent that, as a group, they take a massive hit when the next bear market comes around. Franco Nevada exited the 20112015 bear market with a higher share price than with which it began. I doubt that will be the case the next time around. But the good news is that we won’t likely have to worry about that for a few more years.
It’s also worth considering whether the dynamics discussed above present any opportunities to the enterprising investor. There are a couple apparent to me. The first is that the best royalty opportunities going forward lie with base and energy metals. It’s astounding to me that there isn’t a single base/energy metal royalty company valued north of US$500 million, especially given that gold only accounts for 1520% of the total value of global mineral production. The playing field is wide open, and I think it’s only a matter of time before investors warm to royalty companies focused on metals other than gold and silver.
The second opportunity is more obscure and only relevant to those of us who invest in the prospect-generation business model. I think there is a window over the next few years for the more mature prospect generators to transition into royalty companies. There are a handful of groups out there with 12 cash-flowing royalties backed by a large portfolio of non-cash-flowing royalty interests at various stages of development. I’m not suggesting that these groups go out and overpay for additional cash-flowing royalties just so they can call themselves a proper royalty company. Nor am I suggesting that anyone should disingenuously brand themselves as a royalty company before they have the goods. But at the very least, I do think there may be opportunities for these companies to restructure any existing project-level interests into NSRs and also to structure future earn-in deals with a greater emphasis on the royalty component.
As a final note, it will be interesting to see whether the recent flurry of M&A activity among the precious metal developers and producers translates into any consolidation within the royalty space. I count eight major mining deals in the past 90 days, but the last takeover of one royalty company by another occurred mid-2019 when Sailfish Royalty Corp. (FISH:TSX.V; OTC:SROYF) acquired Terraco Gold. Might we see some more of this in 2020? A deal or two does seem likely, at least among the junior players.
Matt Geiger is Managing Partner at MJG Capital, a limited partnership specializing in natural resource investments. The partnership is long-only and holds a concentrated portfolio of resource equities. Investments include explorers, developers, and producers of energy metals, industrial metals, precious metals and ag minerals. Geiger is a graduate of the Wharton School at the University of Pennsylvania and previously founded a venture-backed technology company recently valued at $150 million.
Disclosure: 1) Matt Geiger: The MJG Capital Fund owns EMX shares, Metalla warrants, and has indirect exposure to Abitibi Royalties through Golden Valley Mines. I determined which companies would be included in this article based on my research and understanding of the sector. 2) The following companies mentioned in this article are billboard sponsors of Streetwise Reports: None. Click here for important disclosures about sponsor fees. 3) Statements and opinions expressed are the opinions of the author and not of Streetwise Reports or its officers. The author is wholly responsible for the validity of the statements. The author was not paid by Streetwise Reports for this article. Streetwise Reports was not paid by the author to publish or syndicate this article. The information provided above is for informational purposes only and is not a recommendation to buy or sell any security. Streetwise Reports requires contributing authors to disclose any shareholdings in, or economic relationships with, companies that they write about. Streetwise Reports relies upon the authors to accurately provide this information and Streetwise Reports has no means of verifying its accuracy. 4) This article does not constitute investment advice. Each reader is encouraged to consult with his or her individual financial professional and any action a reader takes as a result of information presented here is his or her own responsibility. By opening this page, each reader accepts and agrees to Streetwise Reports’ terms of use and full legal disclaimer. This article is not a solicitation for investment. Streetwise Reports does not render general or specific investment advice and the information on Streetwise Reports should not be considered a recommendation to buy or sell any security. Streetwise Reports does not endorse or recommend the business, products, services or securities of any company mentioned on Streetwise Reports. 5) From time to time, Streetwise Reports and its directors, officers, employees or members of their families, as well as persons interviewed for articles and interviews on the site, may have a long or short position in securities mentioned. Directors, officers, employees or members of their immediate families are prohibited from making purchases and/or sales of those securities in the open market or otherwise from the time of the interview or the decision to write an article until three business days after the publication of the interview or article. The foregoing prohibition does not apply to articles that in substance only restate previously published company releases. As of the date of this article, officers and/or employees of Streetwise Reports (including members of their household) own securities of Franco Nevada, EMX, Sailfish and Metalla, companies mentioned in this article.
Shares of Viela Bio Inc. rose 20% after an analyst at H.C. Wainwright & Co. initiated coverage of the stock.
This morning, shares of clinical-stage biotechnology firm Viela Bio Inc. (VIE:NASDAQ), which is focused on pioneering treatments for autoimmune and severe inflammatory diseases, traded more than 20% higher after a report that H.C. Wainwright & Co. initiated coverage of the company with a “Buy and price target of $60.”
According to the report, H.C. Wainwright analyst Raghuram Selvaraju, Ph.D., stated, “Viela Bio has demonstrated what we believe to be best-in-class clinical data in neuromyelitis optica spectrum disorder (NMOSD)…We expect inebilizumab to garner a commanding share of the market in NMOSD, given its best-in-class profile.”
Viela Bio is a clinical-stage biotechnology company headquartered in Gaithersburg, Md., that is focused on the development and commercialization of treatments for autoimmune and severe inflammatory diseases. The firm’s research is aimed at targeting the underlying molecular pathogenesis of the disease and is concentrated on well-established critical biological pathways shared across multiple indications. The company filed a Biologics License Application (BLA) for its lead asset inebilizumab, a first-line monotherapy treatment for patients with neuromyelitis optica spectrum disorder (NMOSD), which has been accepted for review by the U.S. Food and Drug Administration (FDA). Viela is also advancing clinical studies in diseases including Sjögren’s syndrome, myasthenia gravis and IgG4-related disease.
Viela Bio began the day with a market capitalization of around $1.9 billion with approximately 50.96 million shares outstanding. Following the Presidents Day holiday, VIE shares opened today at $38.53 (+$1.02, +2.72%) over Friday’s closing price of $37.31. The stock has traded today between $38.53 and $45.50 per share and is currently trading at $43.98 (+$6.47, +17.25%).
Disclosure: 1) Stephen Hytha compiled this article for Streetwise Reports LLC and provides services to Streetwise Reports as an independent contractor. He or members of his household own securities of the following companies mentioned in the article: None. He or members of his household are paid by the following companies mentioned in this article: None. 2) The following companies mentioned in this article are billboard sponsors of Streetwise Reports: None. Click here for important disclosures about sponsor fees. 3) Comments and opinions expressed are those of the specific experts and not of Streetwise Reports or its officers. The information provided above is for informational purposes only and is not a recommendation to buy or sell any security. 4) The article does not constitute investment advice. Each reader is encouraged to consult with his or her individual financial professional and any action a reader takes as a result of information presented here is his or her own responsibility. By opening this page, each reader accepts and agrees to Streetwise Reports’ terms of use and full legal disclaimer. This article is not a solicitation for investment. Streetwise Reports does not render general or specific investment advice and the information on Streetwise Reports should not be considered a recommendation to buy or sell any security. Streetwise Reports does not endorse or recommend the business, products, services or securities of any company mentioned on Streetwise Reports. 5) From time to time, Streetwise Reports LLC and its directors, officers, employees or members of their families, as well as persons interviewed for articles and interviews on the site, may have a long or short position in securities mentioned. Directors, officers, employees or members of their immediate families are prohibited from making purchases and/or sales of those securities in the open market or otherwise from the time of the interview or the decision to write an article until three business days after the publication of the interview or article. The foregoing prohibition does not apply to articles that in substance only restate previously published company releases. 6) This article does not constitute medical advice. Officers, employees and contributors to Streetwise Reports are not licensed medical professionals. Readers should always contact their healthcare professionals for medical advice.
TOMI Environmental Solutions Inc.’s (TOMZ:OTCQB) products kill pathogenssafely and effectively. Not just the coronavirus: Ebola, MERS, C. diff spores, sepsis, norovirus, anthrax, Staphylococcus, MRSA, Legionnaire’s and Zika. The kill list also includes food borne illness such as E. coli and salmonella.
Simple. Safe. Effective. Fast
Tomi’s lead product, SteraMist, is a propriety two-step process that aerosolizes and activates a 7.8% hydrogen peroxide solution, along with a “secret sauce,” producing a fine aqueous mist. You probably have a bottle of hydrogen peroxide (H₂O₂) in your medicine cabinet; it’s the world’s safest natural sanitizer.
SteraMist’s hydrogen peroxide concentration produces a highly effective, germ-killing aerosol. SteraMist is unique in that the mistmore like a fog”atomizes” the liquid and quickly covers hard to reach surfaces, with the same velocity and characteristics of a gas. This works faster and with less saturation than ordinary sprays.
(Source: Tomi)
Speed and portability are primary advantages: SteraMist can clean a room in minutes. The SteraMist hospital “terminal clean” protocol is 55 minutes. Competitive products, we believe, are generally far more caustic or take up to eight hours. All are superior to bleach hand scrubbing.
SteraMist is proven to kill all known bacteria, spores and inactivate all known viruses on surface by a “six log” or 99.9999% reduction, the highest standard.
Ready to rollout: in China & worldwide
On February 4, 2020, after a lengthy three-year registration process, the next level began:
“TOMI Receives China CDC Registration Making SteraMist the Disinfection Industry Standard in China.”
Tomi’s news release noted:
“SteraMist is now the industry standard for disinfection throughout all of China. This registration allows China to take advantage of SteraMist disinfection and decontamination in a variety of verticals such as healthcare, pharmaceutical, commercial and residential, schools, and throughout the community.”
Long, proven history
The Binary Ionization Technology (BIT) Platform was developed in response to the Congressional 2001 anthrax attacks, via a DARPA grant, after U.S. government officials saw the desperate need for a superior cleaning solution.
In June 2015, the Environmental Protection Agency (EPA) granted TOMI the first ever solution and technology combination registration. Registrations in all 50 states were secured. Further claims were received for C. difficile spores and H1N1 (swine flu), in addition to registration with the U.S. Food and Drug Administration (FDA) as a disinfectant medical device and further addition of microbes to its efficacy with the EPA.
SteraMist’s successful “proof of concept” in multiple commercial applications over many years confirm the technology is now primed for mass rollout.
Tomi has taken careful steps to project its global IP, especially in China, and in 2017 received enhanced design patents.
This author has followed Tomi for five years; San Diego-based technology incubators Titan (SteraMist inventor) and Maxwell Technologies (recently acquired by Tesla) since the mid-1990s. We have witnessed SteraMist applied and we believe the technology is “the real deal.”
Global awareness increasing
We know the current coronavirus is just a bad flu. Most critically, we believe this outbreak now changes (finally) behavior standards in Asia, and globally.
Blanket travel bans; locking down entire cities, not exactly efficient.
Pathogens can mutate rapidly, even if a vaccine is developed. Limited value.
Pills do not kill pathogen spread via surface contact, like doorknobs.
What’s next? Tomi’s solution kills everything, not just coronavirus: Ebola, C. diff, various “superbugs,” E. colieven bedbugs and ordinary mold and mildew.
One protocol to kill them all. SteraMist solves multiple, mutating problems, now and in the future.
As of this date, Tomi remains off the radar; almost no press coverage, hardly a whisperyet given landmark China CDC approval, this represents an opportunity. ..with enormous applications:
Vertical opportunities include: every hospital, school, airplane, restaurant (both front and kitchen) hotels, commercial and residential properties, gyms, food harvesting and transportation, etc.
Our thesis: life has changed in Asia. Forever. We know Tomi and SteraMist had an Asian conglomerate’s interest after the MERS outbreak, but the interest faded (it always does) with the virus. Nobody wants to invest in safety. Until
We believe an attitude change would benefit TOMZ shares, which could appreciate significantly.
Simple solutions often the best
SteraMist contains a high concentration of Reactive Oxidative Species (ROS). ROS cause damage to pathogenic organisms via mechanisms such as oxidation of unsaturated fatty acids and amino acids leading to cellular disruption and/or dysfunction.
(source: Tomi)
The unique physiochemistry of the Activated Ionized Hydrogen Peroxide (AIHP) allows these ROS to exist in high concentrations without rapidly recombining and losing their reactivity.
The ionizing effect also leaves the room smelling fresh (Photo: Tomi)
San Diego-based technology incubator Titan Corp received the DARPA contract. Although Titan landed its first related patent in 2005, the technology was not a fit with a primary defense communications business, which included 4400 translators in Iraq. In 2005, L3 communications purchased Titan for $2.65 billion. However, since L3 is primarily a defense electronics contractor, SteraMist was “orphaned,” TOMI founder Dr. Halden Shane bought the patents in 2013.
Giant, global opportunity
Healthcare associated infections affect over 2 million patients annually, in the U.S. alone, adding an estimated $30 billion in costs. We have no idea what the total costs will be in China, but it will not be cheap.
Time is money in healthcare, as in every business, so disinfecting a room, or entire ward, by hand, with bleach or caustic agents, or competitor’s solutions (as we believe) with up to a six or eight-hour treatment time is not cost effective.
OK, find and kill the virus?
The approximate post terminal clean for SteraMist hospital treatment is 55 minutes; a short time to assure that environmental surface contamination will not pass to the next patient or hospital staff. We believe SteraMist should be incorporated as part of the routine cleaning process.
Although Tomi does not currently make any such claims, we further believe the potential exists (given its gas-like, low corrosive vapor) for SteraMist adaption in densely packed locations vulnerable to airborne transmission, including factories and offices.
Travel
We hope this is a no brainer. Tomi can safely and rapidly disinfect an aircraft, hotel room, etc., with faster coverage, safer, less labor, less liquid and less corrosion. Complete coverage is not an easy application. A small miss can transmit.
Competition
Compared to competitors, based on our understanding, SteraMist technology has a quicker and higher kill level, in a shorter time, leaves no residue, is eco-friendly, is not effected by humidity, is not caustic, does not blister painted surfaces, contains no silver ions, requires no humidify alteration prior to use, has a shorter treatment time, is quicker to exhaust due to the production of the reactive oxygen species verses nebulization of higher concentrates of hydrogen peroxide, contains no bleach, rooms require little or no prep prior to treatment, and converts to oxygen and water.
In addition, SteraMist replaces traditional formaldehyde, ultra-violet devices, quat ammonia products, hydrogen peroxide vapor (HPV), peracetic acids and silver ions/anions products, glutaraldehyde, chlorine dioxide and titanium dioxide as decontamination solutions.
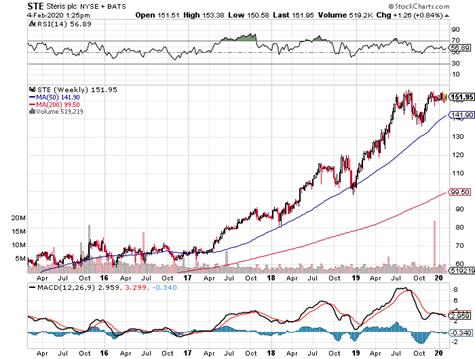
UK-based Steris (NYSE: STE) develops and markets multiple products in the sterilization business, including Vaprox, a vaporized hydrogen peroxide (VHP) decontamination device, used mostly in clean rooms and pharmaceutical processing. Steris now trades near a $13 billion market cap; Tomi a miniscule fraction. Steris was built through a series of acquisitions.
After repeated company visits, several years ago, we patiently waited for the right moment. It has arrived. Our vision for Tomi is more a buyout or licensing play. The company has survived while being chronically undercapitalized for years. Although managed in a classy, professional manner, Tomi has not the talent depth and operational experience for a global roll-out, in our opinion. The founder/CEO is turning 75. Tomi has developed slowly, seemingly a snail’s pace, the past six years, and acts more akin to a private club than an aggressive tech start-up.
However, we argue the tsunami tailwind affords Tomi an epic moment. A quick pivot, or a gorilla partner, and Tomi could soon deserve a valuation in the biotech realm.
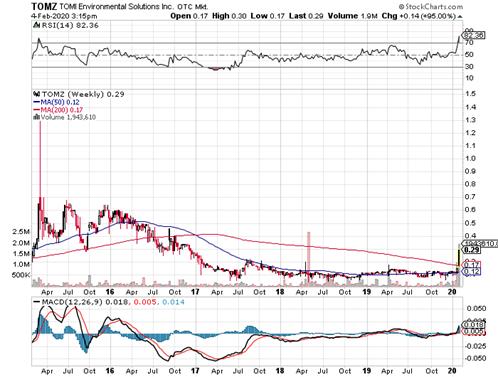
Tomi still looks cheap (chart source: Stockcharts)
We do not know the exact float, but insider ownership is high: 3rd party reports show 41%; there are also several large long-term investors. The current effective float could be only 10% or 20%, which means any whiff of success would probably require a dramatically higher share price to reach orderly market stability. There is a $5 million note due in April, which the company believes it can easily refinance.
Food safety
E. coli outbreaks at Chipotle, and others, chopping off billions in market value, are now a seemingly continual chain of food safety problems. This is a huge opportunity for Tomi. SteraMist’s advantages are its portability; it can be deployed near harvest, without side effects. The company is currently working toward a direct food and crop application using a 1% acceptable concentration of hydrogen peroxide.
Most interesting, the initial emphasis is on the profitable organic market. The objective is to prevent/and or minimize food decay without harsh chemicals. We like organic.
In the future, potential exists for a restaurant industry application of a brief spray at day’s end. While scrubbing is fine, this added layer of final protection reaches all surface areas: safe for food and humans.
Portable pandemic treatment
SteraMist best performs, and outshines, in the most difficult cases. Only good fortune kept Ebola from greater global carnage. SteraMist’s portability, ease-of-use and “6 log kill” make it an ideal solution component. This was successfully demonstrated in its 2015 deployment to Monrovia, Liberia, to decontaminate the Ebola treatment center.
Mosquito-borne illness
Mosquitoes are crafty buggers. Although Zika is now “forgotten,” the opportunity remains. SteraMist kills mosquitoes. While fumigation may be acceptable outdoors, indoors it creates serious problems. SteraMist is ideal for a rapid, safe indoor mosquito abatement, since repeated poison fumigating is unhealthy.
Conclusion
Prompt SteraMist adaption allows authorities to rapidly provide citizens with an immediate, highly visible, long-term solution, not just for coronavirus, but a vast array of pathogens. The SteraMist solution could become an integral component in health preservation globally.
Given the timeliness, this report is intended only as a brief overview. Tomi has a wealth of additional information on the company’s website at www.tomimist.com, in addition to posted 10K and Qs. Please review.
Investors may like what they see. Tomi Environmental Solutions is an unknown, timely opportunity.
Frederick Lacy, President of Fincom Investment Partners, began as a Chicago commodity broker in 1984. In 1987 he joined Bateman Eichler, Hill Richards in Los Angeles, focusing on small to mid-cap equities, ultimately “retiring” in 2000 as a Managing Director of Investment Banking. Mr. Lacy has been involved in numerous investments, from arranging start-up capital for what became Petrohawk, which sold for $15 Billion, to mobile payments in India. Several long-time clients were founding investors of Cheniere Energy. Mr Lacy’s decades in California technology includes arranging an early $13 million VC financing for “permanent ledger” software (now commonly known as “blockchain”) led by top-tier fund Upfront Ventures. Other investments include 3D holographic display technology, early mobile applications, power conversion, along with multiple consumer health-related products: Canadian Glacier bottled water, Kinetin skin cream, a proprietary oxidative-stress formula, and UV purification systems. In 1989 Mr. Lacy hosted “the Venture Capitalist” which aired on (now) CNBC, and has followed the natural foods industry for 35 years.
This report is for informational purposes only and is not a solicitation of any security purchase or sale. Opinions expressed herein by the author are not an investment recommendation and are not meant to be relied upon in investment decisions. The information upon which this material is based was obtained from sources believed to be reliable, but has not been independently verified. Therefore, Fincom Investment Partners cannot guarantee its accuracy. Do your own due diligence. Any opinions or estimates constitute our best judgment as of the date of publication, and are subject to change without notice. We recommend investors conduct thorough investment research of their own, including detailed review of the related Companies’ filings, and consult a qualified investment adviser. Fincom Investment Partners and its officers and directors own shares in Tomi Environmental Solutions and may buy or sell shares at any time without prior notice.
Streetwise Reports Disclosure: 1) Frederick Lacy and Fincom Investment Partners disclosures are above. 2) The following companies mentioned in this article are billboard sponsors of Streetwise Reports: None. Click here for important disclosures about sponsor fees. 3) Statements and opinions expressed are the opinions of the author and not of Streetwise Reports or its officers. The author is wholly responsible for the validity of the statements. The author was not paid by Streetwise Reports for this article. Streetwise Reports was not paid by the author to publish or syndicate this article. The information provided above is for informational purposes only and is not a recommendation to buy or sell any security. Streetwise Reports requires contributing authors to disclose any shareholdings in, or economic relationships with, companies that they write about. Streetwise Reports relies upon the authors to accurately provide this information and Streetwise Reports has no means of verifying its accuracy. 4) This article does not constitute investment advice. Each reader is encouraged to consult with his or her individual financial professional and any action a reader takes as a result of information presented here is his or her own responsibility. By opening this page, each reader accepts and agrees to Streetwise Reports’ terms of use and full legal disclaimer. This article is not a solicitation for investment. Streetwise Reports does not render general or specific investment advice and the information on Streetwise Reports should not be considered a recommendation to buy or sell any security. Streetwise Reports does not endorse or recommend the business, products, services or securities of any company mentioned on Streetwise Reports. 5) From time to time, Streetwise Reports and its directors, officers, employees or members of their families, as well as persons interviewed for articles and interviews on the site, may have a long or short position in securities mentioned. Directors, officers, employees or members of their immediate families are prohibited from making purchases and/or sales of those securities in the open market or otherwise from the time of the interview or the decision to write an article until three business days after the publication of the interview or article. The foregoing prohibition does not apply to articles that in substance only restate previously published company releases.
In this update we are going to review a small but important range of commodities and lead indicators that strongly suggest the seemingly endless bull market in U.S. equities is living on borrowed time and will end sooner rather than later. Given how long it has lasted and how extremely overvalued the market has become, the downturn will likely start with a crash phase.
Regardless of what the eventual impact of the coronavirus epidemic is, U.S. stock markets, in particular, seem to be in a state of denial about the actual real-world consequences of the Chinese shutdown and its impact on the global supply chain and corporate profitability everywhere, and some elements even seem to be gloating about China’s misfortune and predicament, completely oblivious to the fact that this is going to have a negative impact on almost everyone.
The following points were made by a reader, and while I don’t necessarily concur with all he has written, I am open to the possibility that all or much of this may be correct, and if it is, we are looking at serious problems emerging before much longer.
“I am getting reports from friends in SE Asia of the precipitous collapse of global freight as the full impact of China’s colossal shutdown impacts across its economy and now, unsurprisingly, the global economy. Port ship handling in Malaysia, Singapore and Japan is down 50% already, i.e., shipping freight.
“Supply chains across all sorts of industries are collapsing as all components made in China dry up for all sorts of products from cars to iPhones and computers. There has never been a global economic disruption on this scale in history as nCoV’s contagion rate is 4x as fast as SARs and 5 to 8x as virulent. The Chinese have been economical with the truth concerning deaths, infection rates and the numbers of those now under full quarantine. The real numbers have been variably estimated at being 5 to 10 times the official figures. All attempts at real reporting on the scale of this pandemic are being heavily censored, but what I have seen emerging on YouTube is very scary/harrowing.
“International air and sea travel is in virtual freefall as people are now reluctant to travel or simply can’t travel on so many air and sea routes due to these now being closed down by states protecting their populations from infection. Holidays to SE Asia are in a state of collapse in Australia and Europe.
“Stock market highs are entirely due to major market manipulative forces/players and not due to any underlying fundamental economic reasons, hence, the market is now totally defying gravity. The MSM [mainstream media] is even beginning to acknowledge this fact and most market experts see a major correction/recession as being imminent.
“The commodity of the last resortgold (and silver)looks set to go ballistic, and takeovers of underdeveloped gold mining assets is in “blast-off mode” in Australia. All top brokers in the Australian gold markets are foreseeing AU$3,000 per ounce gold by the end of 2020. It’s already at AU$2,343/ounce. Silver is the huge sleeper. . .but not for much longer!”
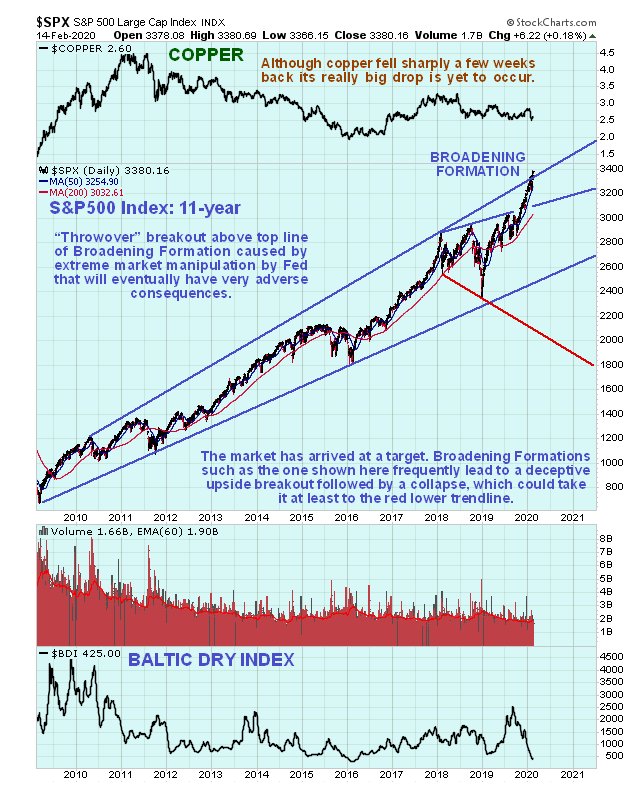
Our roundup of the charts starts with a review of the bull market in its entirety, using an 11-year chart for the S&P500 index. On this chart we see that this bull market has been going on for almost 11 years now, from the low in spring 2009. The latest upleg, which is really steep, takes the index up to a target at trendline resistance at the top of the expanding uptrend channel shown, which is clearly a good point for it to turn down, especially given how steeply it has risen in the recent past.
One of the big arguments currently being put forward by bulls is that “the market can’t drop because Trump is going to win the election in November by a landslide.” This may well be true, but since the market moves to discount larger economic developments nine months in advance of them, it means that it is already right now discounting a Trump victory.
Now let’s turn our attention to the lead commodities/indicators, which are already calling time on this bull market.
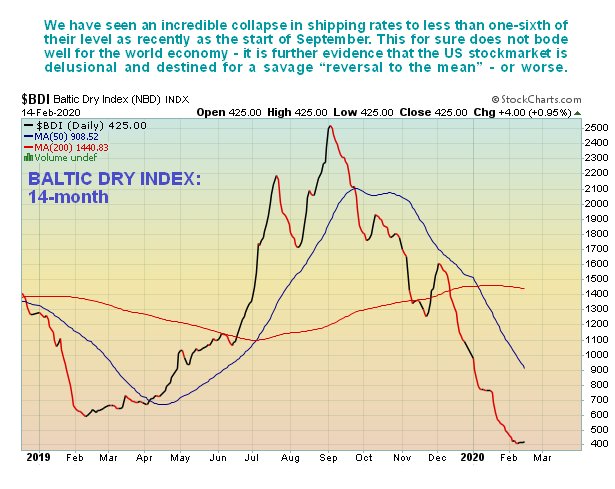
The first is the Baltic Dry Index (BDI), which is the cost of shipping. On the 14-month chart for the BDI we see that, just since the start of September it has plummeted from 2,500 to just above 400, meaning that the cost of shipping is just one-sixth of what it was about five months ago. That should tell you all you need to know about the state of world tradejust don’t expect Wall Street to go pasting this chart up on sidewalk billboards.
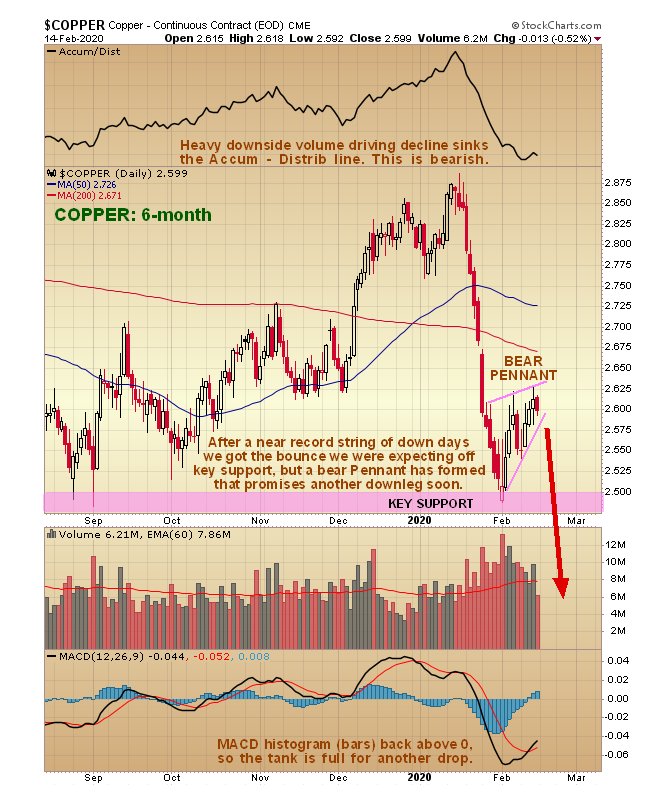
Next copper, which had an extraordinary string of 13 down days in a row on heavy volume a few weeks ago. This drop brought it down to an important support level in a deeply oversold state, and we looked for a weak rebound to alleviate this oversold condition, which has since occurred.
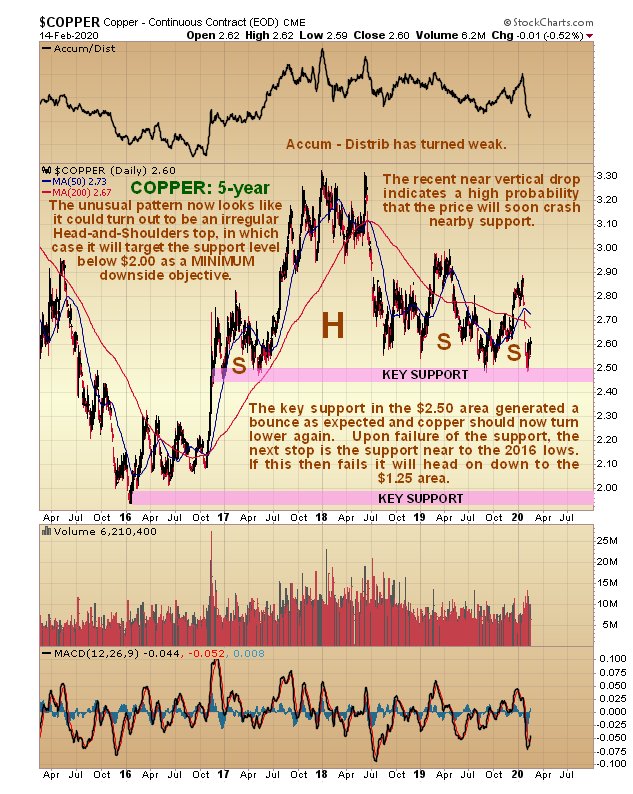
But as we can see on its latest 6-month chart, the tight pattern that has formed looks like a bear pennant, not an intermediate base, and if this interpretation is correct, then another severe downleg will begin soon, which will see copper crack the key support and drop, probably steeply, to the next important support level below $2, which can be seen on the 5-year chart below. If this happens it will be very bad news for the global economy. Copper is not called Dr. Copper for nothingweakness in copper is frequently an early warning sign of an impending recession (in this case, depression), which is why it so called.
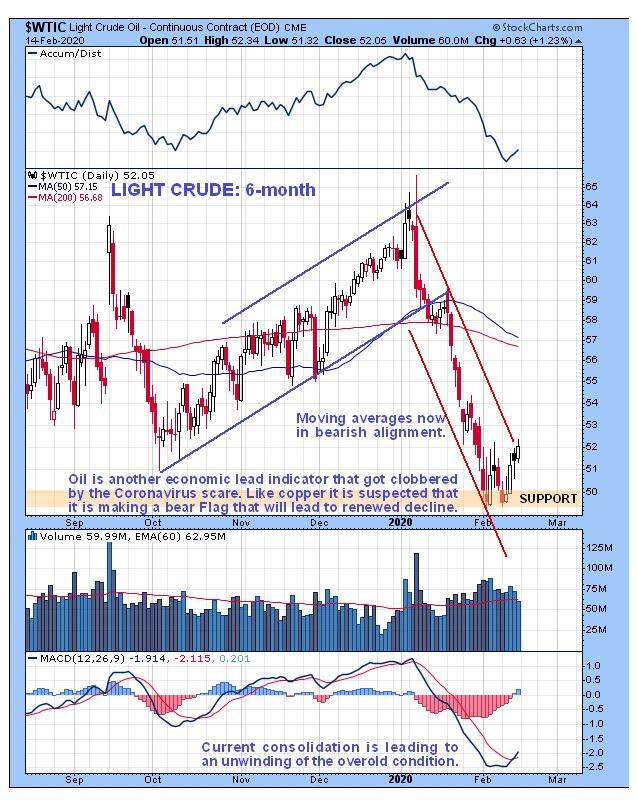
Another commodity signaling serious problems ahead is oil, which has dropped steeply within the same time frame as copper, as we can we on the 6-month chart for light crude below. It too is rallying feebly from an important support level to alleviate its oversold condition, but the pattern that has formed so far this month also looks like it will turn out to be a countertrend bear flag/pennant that will be followed by a drop to new lows.
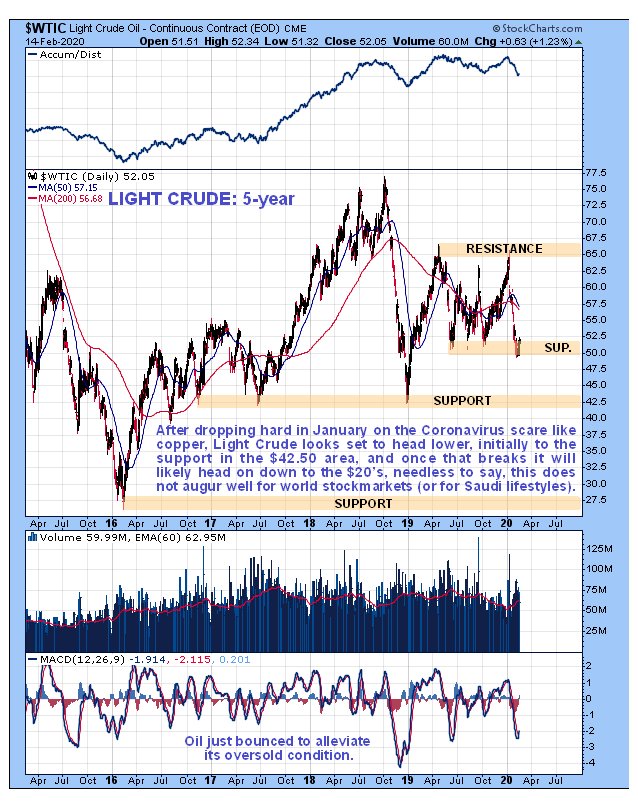
The 5-year chart enables us to see where light crude is likely to go if it breaks below the nearby support, just below $50. If this support is breached, oil will target the next important support level at around $42.50and if that fails, as we would expect it to in a crash scenario, then light crude is likely to find itself back in the high $20s or even lower. Needless to say, such a scenario is likely to be accompanied by a severe decline in the stock market.
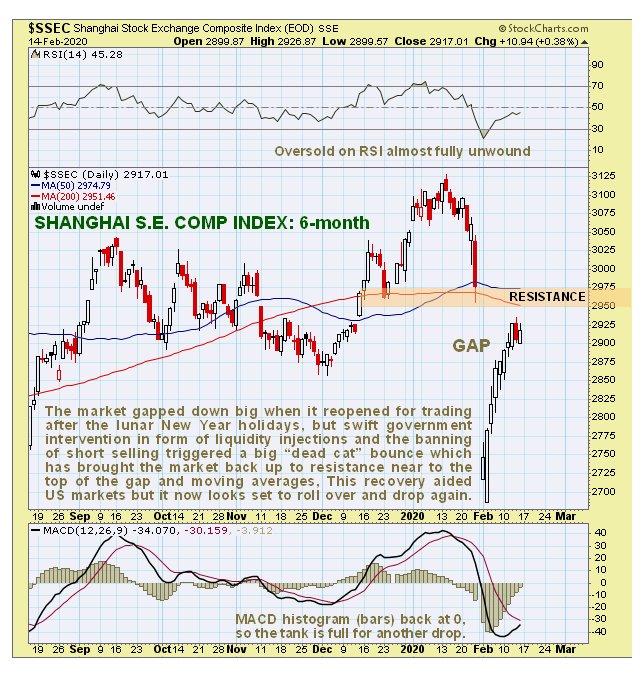
One reason that U.S. stock markets have managed to stay elevated despite the looming severe problems is the recovery in the Chinese stock market in recent weeks. On the 6-month chart for the Shanghai Composite Index we can see that, following it opening with a big gap down after the end of the Chinese Lunar New Year holidays, it has made what at first sight looks like an impressive recovery due to the government pledging to pump billions into the market and also banning short-selling.
However, on closer inspection this looks like nothing more than a “dead cat bounce,” which has only succeeded in bringing the market up to resistance, toward the top of the gap and close to its falling moving averages. If it now proceeds to roll over and drop again, this is likely to put pressure on lofty U.S. markets.
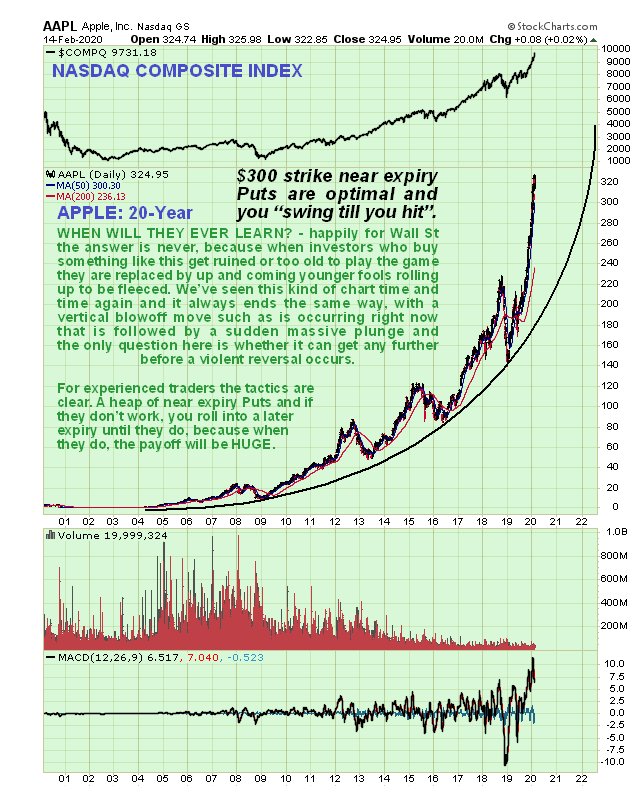
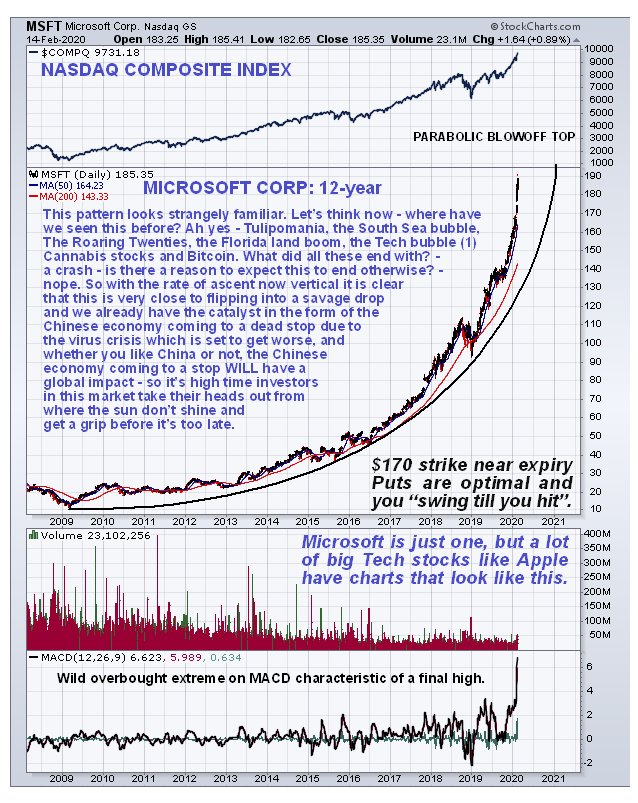
But if you want more compelling evidence that it’s 1 minute to 12 on the market clockor more like 5 seconds to 12then take at the following 2 long-term charts for Apple Inc. (AAPL:NASDAQ) and Microsoft Corp. (MSFT:NASDAQ), which shows them ending their long parabolic bull markets with spectacular vertical blow-off tops.
Could they go even higher before they crash and burn? Maybe, but the higher they go the greater the probability that they will suddenly flip to the downside, and the initial plunge is likely to be brutal. Many investors in these stocks up to now are not so stupid as one might think. They know the situation is unsustainable, but are looking to sell to an even bigger idiot before the music stops. Just make sure you are not around when it does, because the exits will be instantly jammed solid.
It is very hard to believe that these stocks are at these levels, especially given Apple’s presence in China. The fact that they are is viewed as an indication of a staggering complacency rooted in dire ignorance.
Looking at the charts above, especially those for the tech stocks Apple and Microsoft, it should be obvious that the vast majority of investors are now living in “cloud cuckoo land,” oblivious to the catastrophic fallout that a dead stop of the Chinese economy will lead to, especially as the global debt situation was precarious before all these latest problems.
We will shortly be looking at some Apple and Microsoft puts on the site, with an awareness that they could make one last stab higher before they cave in. Close inspection of their 6-month charts turns up that they may make one final vertical run to new highs and even more overbought extremes before they are exhausted and reverse into a crash.
Article originally posted on CliveMaund.com at 4.10 pm EST on 15th February 2020.
Clive Maund has been president of www.clivemaund.com, a successful resource sector website, since its inception in 2003. He has 30 years’ experience in technical analysis and has worked for banks, commodity brokers and stockbrokers in the City of London. He holds a Diploma in Technical Analysis from the UK Society of Technical Analysts.
Disclosure: 1) Clive Maund: I, or members of my immediate household or family, own shares of the following companies mentioned in this article: None. I personally am, or members of my immediate household or family are, paid by the following companies mentioned in this article: None. My company has a financial relationship with the following companies mentioned in this article: None. CliveMaund.com disclosures below. I determined which companies would be included in this article based on my research and understanding of the sector. 2) The following companies mentioned in this article are billboard sponsors of Streetwise Reports: None. Click here for important disclosures about sponsor fees. 3) Statements and opinions expressed are the opinions of the author and not of Streetwise Reports or its officers. The author is wholly responsible for the validity of the statements. The author was not paid by Streetwise Reports for this article. Streetwise Reports was not paid by the author to publish or syndicate this article. The information provided above is for informational purposes only and is not a recommendation to buy or sell any security. Streetwise Reports requires contributing authors to disclose any shareholdings in, or economic relationships with, companies that they write about. Streetwise Reports relies upon the authors to accurately provide this information and Streetwise Reports has no means of verifying its accuracy. 4) This article does not constitute investment advice. Each reader is encouraged to consult with his or her individual financial professional and any action a reader takes as a result of information presented here is his or her own responsibility. By opening this page, each reader accepts and agrees to Streetwise Reports’ terms of use and full legal disclaimer. This article is not a solicitation for investment. Streetwise Reports does not render general or specific investment advice and the information on Streetwise Reports should not be considered a recommendation to buy or sell any security. Streetwise Reports does not endorse or recommend the business, products, services or securities of any company mentioned on Streetwise Reports. 5) From time to time, Streetwise Reports LLC and its directors, officers, employees or members of their families, as well as persons interviewed for articles and interviews on the site, may have a long or short position in securities mentioned. Directors, officers, employees or members of their immediate families are prohibited from making purchases and/or sales of those securities in the open market or otherwise from the time of the interview or the decision to write an article until three business days after the publication of the interview or article. The foregoing prohibition does not apply to articles that in substance only restate previously published company releases.
Charts and graphics provided by the author.
CliveMaund.com Disclosure: The above represents the opinion and analysis of Mr Maund, based on data available to him, at the time of writing. Mr. Maund’s opinions are his own, and are not a recommendation or an offer to buy or sell securities. Mr. Maund is an independent analyst who receives no compensation of any kind from any groups, individuals or corporations mentioned in his reports. As trading and investing in any financial markets may involve serious risk of loss, Mr. Maund recommends that you consult with a qualified investment advisor, one licensed by appropriate regulatory agencies in your legal jurisdiction and do your own due diligence and research when making any kind of a transaction with financial ramifications. Although a qualified and experienced stock market analyst, Clive Maund is not a Registered Securities Advisor. Therefore Mr. Maund’s opinions on the market and stocks can only be construed as a solicitation to buy and sell securities when they are subject to the prior approval and endorsement of a Registered Securities Advisor operating in accordance with the appropriate regulations in your area of jurisdiction.
Namibia’s central bank cut its benchmark repo rate by another 25 basis points to 6.25 percent, its third rate cut in the current easing cycle, saying this is “to support domestic economic activity and to maintain the one-to-one link between the Namibia Dollar and the South African Rand.”
Bank of Namibia’s (BOM) rate cut follows that of the South African Reserve Bank’s surprise rate cut on Jan. 16 in response to a lower inflation forecast and an improved risk profile.
Namibia’s central bank has now cut its rate three times by a total of 75 basis points since it began easing in August 2017 and twice since August 2019
The Namibian dollar trades in a one-to-one rate to the volatile South African rand, which has fallen this year, reversing some of the rise seen from August 2019 to the end of the year.
“The stock of international reserves remained sufficient to support the currency peg,” BOM said, adding international reserves were N$31.0 billion as of Jan. 31, down from N$32.5 billion as of Oct. 31, 2019. enough to cover 4.4 months imports.
Namibia’s inflation rate has declined steadily since April last year to average 3.7 percent in 2019 from 4.3 percent in 2018. In January inflation fell further to 2.1 percent as inflation for housing rents turned negative, the central bank said, forecasting average inflation in 2020 of below 5.0 percent.
“Domestic economic activity contracted in 2019 relative to 2018,” BOM said, adding growth in private sector credit extension (PSCE) had risen marginally to 6.8 percent during 2019 from 6.3 percent in 2018, with growth to individuals slowing and rising slightly to retail, real estate, financial and other service sectors.
In the third quarter of 2019 Namibia’s gross domestic product shrank an annual 0.8 percent, the fourth quarter of contraction on an annual basis, but up from a contraction of 2.9 percent in the second quarter.
In December BOM said the contraction was mainly seen in the mining, and wholesale and retail trade sectors, with the weak performance of mining due to lower output of diamonds, uranium and zinc concentrate.
“The domestic economy is projected to improve in 2020,” BOM said today, noting transport and construction sectors had improved in 2019.
By TheTechnicalTraders– FANG stocks seem uniquely positioned for some extreme rotation over the next 6+ months. The continued capital shift that has taken place over the past 5+ years has driven investment and capital into the Technology sector – much like the DOT COM rally. The euphoric rally in the late 1990s seems quite similar to today.
The biggest difference this time is that global central banks have pushed an easy-money monetary policy since just after 2000. The policies and rallies that took place after 9/11 were a result of policies put in place by George W. Bush and Alan Greenspan. Our research team believes these policies set up a process where foreign markets gorged on cheap US Dollars to expand industry and manufacturing throughout the late 1990s and most of the early 2000s. This process sets up a scenario where the US pumped US Dollars into the global markets after the 9/11 terrorist attacks and foreign markets gobbled this capital up knowing they could expand infrastructure, industry, and manufacturing, then sell these products back to the US and other markets for profits. Multiple QE attempts by the US Fed continued to fuel this capital shift.
It wasn’t until after 2008-09 when the US Fed entered a period of extreme easy money policy. This easy money policy populated an extensive borrow-spend process throughout most of the foreign world. Remember, as much as the US was attempting to support the US markets, the foreign markets were actively gorging even more on this easy money from the US and didn’t believe anything would change in the near future. China/Asia and most of the rest of the world continued to suck up US Dollars while pouring more and more capital into industry, manufacturing and finance/banking.
This process of borrowing from the US while tapping into the expanding US markets created a wealth creation process throughout much of Asia/China that, in turn, poured newly created wealth back into the US stock and real estate markets over the past 7+ years. It is easy to understand how the trillions pushed into the markets by the US Fed created opportunity and wealth throughout the globe, then turned into investments into US assets and the US stock market. Foreign investors wanted a piece of the biggest and most diverse economy on the planet.
This foreign investment propelled a new rally in the Technology sector, which aligned with a massive build-out of technology throughout the world and within China. Remember, in the late 1990s, China was just starting to develop large manufacturing and industry. By the mid-2000s, China had already started building huge city-wide industry and manufacturing. But in the late-2000s, China went all-in on the industry and manufacturing build-out. This created a massive “beast” in China that depends on this industry to support finance and capital markets. This lead to the recent rise in the global and US markets as all of this capital rushed around the globe looking for the best returns and safest locations for investment.
FANG stocks have taken center stage and the recent rally reminds of us the DOT COM rally from the 1990s. Could the Coronavirus break this trend and collapse future expectations within the global markets? Is it possible that we are setting up another DOT COM-like bubble that is about to break?
The weekly chart of Apple (AAPL)
This first Weekly chart of Apple (AAPL) shows just how inflated price has rallied since August 2019. The share price of AAPL has risen from $220 to almost $320 in the last 6 months – an incredible +49%. We attribute almost all of this incredible rise to the Capital Shift that took place in the midst of the US/China trade war. Foreign capital needed to find a place to protect itself from currency devaluation and to generate ROI. What better place than the US Technology Sector.
The weekly chart of Facebook (FB)
Facebook has also seen a nice appreciation in value from the lows in late 2018. From the August 2019 date, though, Facebook has seen share prices rise about +25% – from the $180 level to the $225 level. Although many traders may not recognize the Double Top pattern set up near the $220 level, we believe this setup may be an early warning that Technology may be starting to “rollover” as capital may begin searching for a safer environment and begin exiting the Technology sector.
The weekly chart of Google (GOOG)
Google (Alphabet), GOOG, is another high-flier with share prices rising from $1200 to $1500 from August 2019 till now – a +28% price increase. We can clearly see that GOOG is well above the historic price channel set up by the rotation in late 2018. We believe resistance near $1525 will act as a price boundary and may prompt a downside price rotation associated with the rotation away from risk within the Technology sector. Any downside move, if it happens, could prompt a price decline targeting $1350 or lower.
Concluding Thoughts:
Remember, we are warning of a change in how capital operates within the markets. The Capital Shift that has continued to drive advancing share prices in Technology may be nearing an end. It does not mean the capital shift will end, it just means this capital may rotate into other sectors in an attempt to avoid risks and seek out returns. We believe this is a real possibility because we believe the Coronavirus in China is disrupting the markets (supply/manufacturing and consumer spending) by such a large factor that we believe capital will be forced to identify new targets for returns. In other words, we believe the Technology Sector may be at very high risk for a price reversion event if this “black swan” event continues to disrupt the global markets.
Let’s face it, a very large portion of our technology originates and is manufactured in China. In fact, a very large portion of almost everything we consume is manufactured in China. Heck, the cat food I buy every week is made in China. If this Coronavirus continues to force China to shut down large sections of their nation and manufacturing while it continues to spread, then the only real outcome for the rest of the world is that “China manufacturing capabilities will be only 10~20% of previous levels” (if that).
Once supply runs out for most items originating from China, then we are going to have to deal with a new reality of “what are the real future expectations going to really look like” and that is why we are preparing our followers and friends the Technology sector may be one of the biggest rotating sectors in the near future.
Join my Swing Trading ETF Wealth Building Newsletter if you like what you read here and ride my coattails as I navigate these financial markets and build wealth while others lose nearly everything they own.
NOTICE: Our free research does not constitute a trade recommendation or solicitation for our readers to take any action regarding this research. It is provided for educational purposes only. Our research team produces these research articles to share information with our followers/readers in an effort to try to keep you well informed. Visit our web site (www.thetechnicaltraders.com) to learn how to take advantage of our members-only research and trading signals.
Tomorrow is chock-full of key data from Australia that is especially relevant for fundamental analysis.
The RBA is putting a lot of emphasis on employment data to determine it’s monetary policy direction. If the jobs figures continue to deteriorate, it would increase the chances of a rate cut. And what will have a bigger impact on the markets is the potential for unconventional policy measures.
The data we’re waiting for covers January. This was back when there was a surge of optimism following the signing of the phase I trade agreement (the provisions of which became effective on Friday the 14th).
It might seem like a really long time ago, but it’s been less than two months since the deal was finally inked. The coronavirus – now officially COVID-19 – outbreak didn’t get on international news until half-way through the month.
Therefore, it likely wouldn’t have had much of an effect on the numbers we will be reviewing.
What We Are Expecting
Of all the data points, what most influences the market is the Unemployment Change figure. For several years now it has been oscillating between 10-40K. Numbers beyond that range typically move the AUD significantly more. This is because they generally catch the market by surprise.
The consensus is for there to have been 31K net jobs created in Australia during January. This would be a slight increase from the 28.9K reported in the prior month.
The next important figure is the employment rate. Expectations are for this to increase slightly to 5.2% from 5.1%. In effect, it would be a continuation of the sideways trend that has been in place since June of last year.
The market could, however, interpret it as a negative sign. This is because some analysts had seen last month’s third consecutive drop in unemployment as a sign of a growing jobs market.
The Trends
In order to confirm that the employment situation is improving, we’d have to see a result of 5.0% or lower. That would likely be interpreted by the RBA that more easing isn’t necessary: their current expectations on employment for the first quarter is to average 5.2%.
On the other hand, an unemployment rate above 5.3% could indicate that the situation slipping out of control. This would then make the RBA feel more compelled to step in. We could see substantial weakness in the AUD if the unemployment rate were to move higher.
There are Two Important Bits of Context
First, the unemployment rate always has to be taken in the context of the participation rate.
We can expect it to stay stable at 66.0%. If participation increases, it would explain a rise in unemployment. Or, it would at least explain why the rate didn’t meet expectations and soften the market reaction.
Second, February and March are when we might see some impact from COVID-19 and the wildfires that have been afflicting Australia. Even if numbers beat expectations, they might get offset quickly in the coming data releases.
Alternatively, if the numbers are worse than we anticipate, there isn’t much hope that the employment situation will improve over the next couple of months.
This time around, the employment figures are likely to weigh on the Aussie.