The EUR/USD currency pair keeps consolidating. There is no defined trend. The trading instrument is testing local support and resistance levels at 1.07850 and 1.08250, respectively. The USA continues to publish positive economic releases. Demand for USD remains at a high level. Nevertheless, in the nearest future we do not exclude technical correction of EUR/USD quotes after a significant drop. We recommend opening positions from key levels.
The Economic News Feed for 21.02.2020:
– EU Inflation Report (EU) – 12:00 (GMT+2:00);
– Secondary House Market Sales (US) – 17:00 (GMT+2:00);
Indicators do not give accurate signals: the price is consolidating near 50 MA and 100 MA.
The MACD histogram is in the negative zone, but above the signal line, which gives a weak sell signal for EUR/USD.
The Stochastic Oscillator is located in the neutral zone, the %K line crossed the %D line. There are no signals at the moment.
Trading recommendations
Support levels: 1.07850, 1.07500
Resistance levels: 1.08250, 1.08650, 1.09000
If the price fixes below 1.07850, exoect a decline toward 1.07500-1.07300.
Alternatively, the quotes could grow toward 1.08500-1.08700.
The GBP/USD currency pair
Technical indicators of the currency pair:
Prev Open: 1.29158
Open: 1.28796
% chg. over the last day: -0.31
Day’s range: 1.28758 – 1.28991
52 wk range: 1.1959 – 1.3516
The GBP/USD currency pair has retreated from the local lows. At the moment the technical picture is ambiguous. Sterling is testing the round level at 1.29000. The mark 1.28500 is a key support. The trading instrument has a potential for recovery. Financial markets participants are waiting for important economic reports from UK and USA. Positions should be opened from key levels.
At 11:30 (GMT+2:00) the UK will publish a number of indicators on business activity.
The indicators signal the sellers’ strength: the price has fixed below 50 MA and 100 MA.
The MACD histogram is in the negative zone, but above the signal line, which gives a weak signal to sell GBP/USD.
The Stochastic Oscillator is located in the overbought zone, the %K line has crossed the %D line. There are no signals at the moment.
Trading recommendations
Support levels: 1.28500, 1.28000
Resistance levels: 1.29000, 1.29450, 1.29750
If the price fixes above the round level of 1.29000, expect the quotes to grow toward 1.29400-1.29600.
Alternatively, the quotes could descend toward 1.28300-1.28000.
The USD/CAD currency pair
Technical indicators of the currency pair:
Prev Open: 1.32283
Open: 1.32587
% chg. over the last day: +0.31
Day’s range: 1.32447 – 1.32672
52 wk range: 1.2949 – 1.3566
There is an uncertain technical pattern on the USD/CAD currency pair. The trading instrument is moving sideways. At the moment local support and resistance levels are at 1.32400 and 1.32700, respectively. USD/CAD quotes have a potential to move down. Investors are waiting for important economic releases from Canada. We also recommend paying attention to the dynamics of oil quotes. Positions should be opened from key levels.
At 15:30 (GMT+2:00) the data on retail sales in Canada will be published.
Indicators do not give an accurate signal: 50 MA crossed 100 MA.
The MACD histogram is in the positive zone, but below the signal line, which gives a weak signal to buy USD/CAD.
The Stochastic Oscillator is located near the oversold area, the %K line has crossed the %D line. There are no signals at the moment.
Trading recommendations
Support levels: 1.32400, 1.32150, 1.31800
Resistance levels: 1.32700, 1.33000, 1.33250
If the price fixes below 1.32400, expect the quotes to fall toward 1.32000.
Alternatively, the quotes could grow toward 1.32900-1.33100.
The USD/JPY currency pair
Technical indicators of the currency pair:
Prev Open: 111.337
Open: 112.091
% chg. over the last day: +0.55
Day’s range: 111.871 – 112.185
52 wk range: 104.45 – 113.53
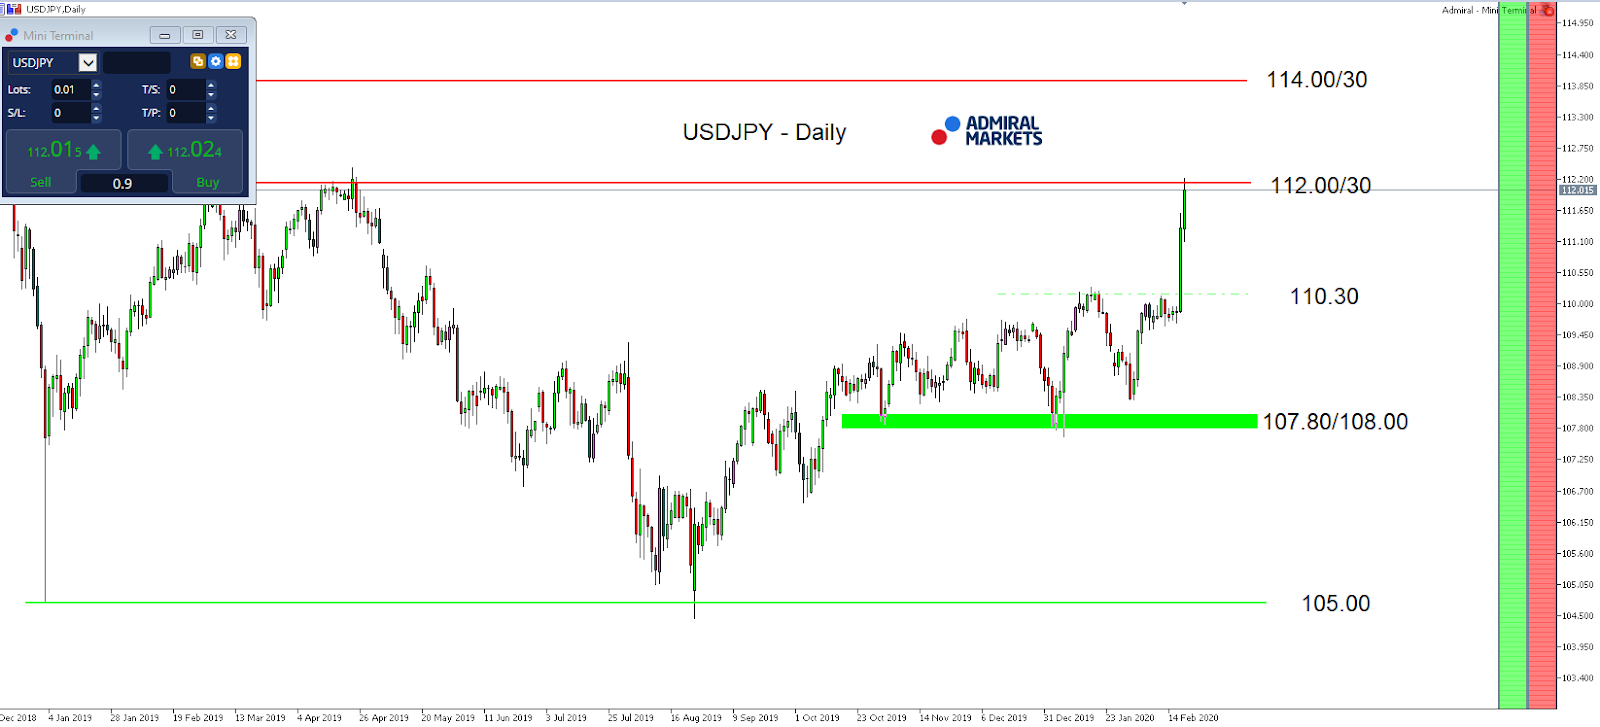
USD/JPY quotes show a stable upward trend. The trading instrument has updated the local highs. At the moment the yen has stabilized. Local support and resistance levels are at 111.750 and 112.250, respectively. Technical correction of USD/JPY currency pair is not ruled out in the nearest future. We expect important statistical data on the US economy. We also recommend to keep an eye on the current information about the epidemic in China. Positions should be opened from key levels.
The Economic News Feed for 21.02.2020 is calm.
The indicators signal the strength of buyers: the price has fixed above 50 MA and 100 MA.
The MACD histogram is in the positive zone, but below the signal line, which gives a weak signal to buy USD/JPY.
The Stochastic Oscillator is in the neutral zone, the %K line is below the %D line, which indicates the development of a correction movement.
Trading recommendations
Support levels: 111.750, 111.200, 110.750
Resistance levels: 112.250, 112.500
If the price fixes above 112.250, expect the quotes to rise toward 112.500-112.800.
Alternatively, the quotes could correct toward 111.300-111.000.
It seems as if the USD/JPY took its time to react to Japan’s latest economic developments last Monday.
The data showed that Japan’s GDP shrank an annualized 6.3% in Q4 of 2019, following a downwardly revised 0.5% growth from the previous period, performing much worse than the pessimistic market forecasts of a 3.7% fall.
It was the sharpest contraction since the second quarter of 2014, and second-biggest drop since the Great Financial Crisis. This was led by falls in consumer and business spending on the back of a sales tax hike, a destructive typhoon, and subdued global demand. And yet, this does not include the potential negative effects of a shrinking global economy driven by developments around the Coronavirus, so the JPY was sold off sharply, pushing the USD/JPY to new yearly highs and the highest levels since May 2019.
If today’s economic data around several US PMI’s come in better than expected and result, at least in the short-term, in a push higher in 10-year US-yields, the push above 111.00 over from the last few days would certainly become sustainable. It would bring 112.00/30 into our focus for the weekly close, make further gains in the currency pair up to 114.00/30 in the coming days a possibility.
Technically the mode on a daily time-frame can now be considered bullish, as long as we trade above 107.80/108.00:
Source: Admiral Markets MT5 with MT5-SE Add-on USD/JPY Daily chart (between December 11, 2018, to February 20, 2020). Accessed: February 20, 2020, at 10:00pm GMT – Please note: Past performance is not a reliable indicator of future results, or future performance.
In 2015, the value of the USD/JPY increased by 0.5%, in 2016 it fell by 2.8%, in 2017, it fell by 3.6%, in 2018, it fell by 2.7%, in 2019, it fell by 0.85%, meaning that after five years, it was down by 9.2%.
Discover the world’s #1 multi-asset platform
Admiral Markets offers professional traders the ability to trade with a custom, upgraded version of MetaTrader 5, allowing you to experience trading at a significantly higher, more rewarding level. Experience benefits such as the addition of the Market Heat Map, so you can compare various currency pairs to see which ones might be lucrative investments, access real-time trading data, and so much more. Click the banner below to start your FREE download of MT5 Supreme Edition!
Disclaimer: The given data provides additional information regarding all analysis, estimates, prognosis, forecasts or other similar assessments or information (hereinafter “Analysis”) published on the website of Admiral Markets. Before making any investment decisions please pay close attention to the following:
This is a marketing communication. The analysis is published for informative purposes only and are in no way to be construed as investment advice or recommendation. It has not been prepared in accordance with legal requirements designed to promote the independence of investment research, and that it is not subject to any prohibition on dealing ahead of the dissemination of investment research.
Any investment decision is made by each client alone whereas Admiral Markets shall not be responsible for any loss or damage arising from any such decision, whether or not based on the Analysis.
Each of the Analysis is prepared by an independent analyst (Jens Klatt, Professional Trader and Analyst, hereinafter “Author”) based on the Author’s personal estimations.
To ensure that the interests of the clients would be protected and objectivity of the Analysis would not be damaged Admiral Markets has established relevant internal procedures for prevention and management of conflicts of interest.
Whilst every reasonable effort is taken to ensure that all sources of the Analysis are reliable and that all information is presented, as much as possible, in an understandable, timely, precise and complete manner, Admiral Markets does not guarantee the accuracy or completeness of any information contained within the Analysis. The presented figures refer that refer to any past performance is not a reliable indicator of future results.
The contents of the Analysis should not be construed as an express or implied promise, guarantee or implication by Admiral Markets that the client shall profit from the strategies therein or that losses in connection therewith may or shall be limited.
Any kind of previous or modeled performance of financial instruments indicated within the Publication should not be construed as an express or implied promise, guarantee or implication by Admiral Markets for any future performance. The value of the financial instrument may both increase and decrease and the preservation of the asset value is not guaranteed.
The projections included in the Analysis may be subject to additional fees, taxes or other charges, depending on the subject of the Publication. The price list applicable to the services provided by Admiral Markets is publicly available from the website of Admiral Markets.
Leveraged products (including contracts for difference) are speculative in nature and may result in losses or profit. Before you start trading, you should make sure that you understand all the risks.
The Dollar index (DXY) is ever so close to the 100 mark; the last time it breached that psychologically-important mark was in April 2017. A break above 100 would crystalize the golden cross pattern, as its 50-day moving average climbs above its 200-day moving average, confirming the Dollar’s upward trend.
Driven by the risk-aversion in the markets due to the black swan event that is the coronavirus outbreak, coupled with the resilience demonstrated by the US economy, investors had strong reasons to cling to the safety of the Greenback during times of uncertainty.
However, with its 14-day RSI now rising into overbought domain, the DXY could be poised to moderate. Still, considering how tantalizingly close the 100 line is, the Greenback may just have enough fuel in their tank to reach that milestone before the month is over.
Dollar set to be data-driven over coming days
Dollar bulls will have a host of US economic indicators that could be used as stepping stones to send DXY higher over the coming days. Any positive surprises in the incoming figures on Q4 GDP, home sales, manufacturing, and consumer spending, could spur King Dollar onto greater heights.
More Dollar gains should spell more near-term pain for currencies across the G10 and emerging-markets complex. As the biggest component in the Dollar index, the Euro is currently offering little drag on the Dollar and poses little threat to DXY’s 3.5 percent advance so far in 2020.
Disclaimer: The content in this article comprises personal opinions and should not be construed as containing personal and/or other investment advice and/or an offer of and/or solicitation for any transactions in financial instruments and/or a guarantee and/or prediction of future performance. ForexTime (FXTM), its affiliates, agents, directors, officers or employees do not guarantee the accuracy, validity, timeliness or completeness, of any information or data made available and assume no liability as to any loss arising from any investment based on the same.
US stock market rally paused on Thursday against the background of increase in coronavirus infection cases outside China. The S&P 500 lost 0.38% to 3373.23. The Dow Jones industrial average slid 0.44% to 29423.3. Nasdaq composite index fell 0.7% to 9750.96. The dollar strengthening accelerated as Philadelphia Fed Manufacturing Index jumped to two-year high in February while the number of people applying for first time jobless benefits rose last week: live dollar index data show the ICE US Dollar index, a measure of the dollar’s strength against a basket of six rival currencies, rose 0.3% to 99.86 but is lower currently. Futures on stock indexes point to lower openings today.
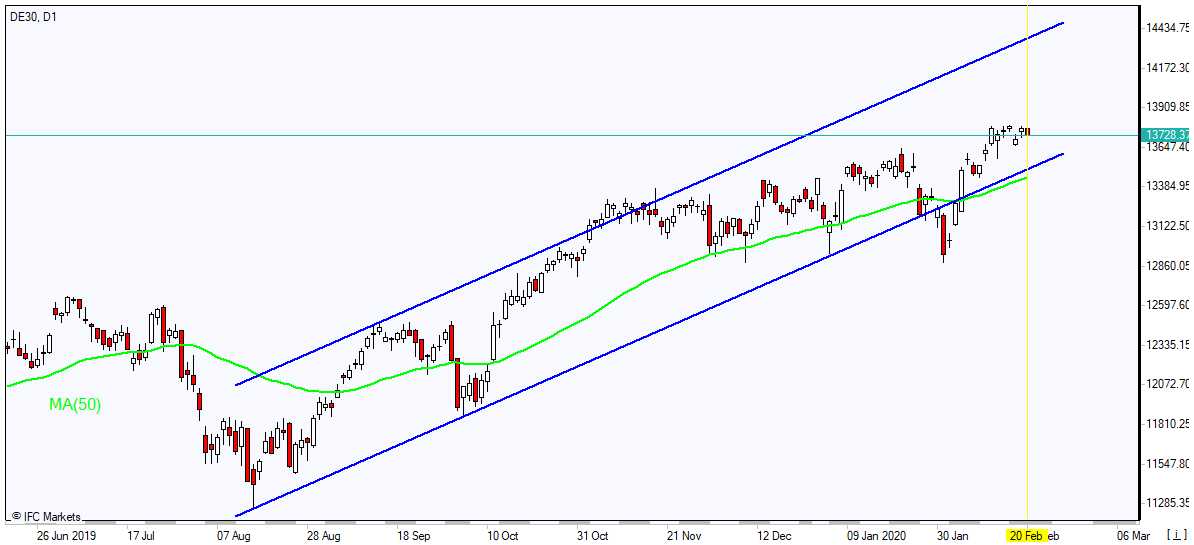
DAX 30 led European indexes retreat
European stocks pulled back on Thursday. EUR/USD reversed climbing while the GBP/USD continued sliding yesterday with both pairs lower currently. The Stoxx Europe 600 index lost 0.6% led by insurance shares. Germany’s DAX 30 fell 0.9% to 13664. France’s CAC 40 slumped 0.8% while UK’s FTSE 100 slid 0.3% to 7436.64 despite report retail sales rose 0.9% on the month after a 0.5% fall in December.
Hang Seng leads Asian indexes losses
Asian stock indices are mostly lower today after news of rise in new virus cases in South Korea. Nikkei ended down 0.4% at 23386.74 with yen advance against dollar resuming. Markets in China are mixed after reports of a rise in new cases in Beijing: the Shanghai Composite Index is up 0.3% while Hong Kong’s Hang Seng Index is 1.2% lower. Australia’s All Ordinaries Index slid 0.3% despite continuing Australian dollar decline against the greenback.
Brent futures prices are edging lower today. Prices ended higher yesterday after a smaller than expected weekly increase in US crude supplies. The Energy Information Administration reported US oil inventories rose 0.4 million barrels last week when the American Petroleum Institute on Wednesday reported a climb of 4.2 million barrels. April Brent crude rose 0.3% to $59.31 a barrel on Thursday.
Gold rise intact
Gold prices are extending gains today. Prices rose yesterday: April gold added 0.5% to $1620.50 an ounce on Thursday.
Note: This overview has an informative and tutorial character and is published for free. All the data, included in the overview, are received from public sources, recognized as more or less reliable. Moreover, there is no guarantee that the indicated information is full and precise. Overviews are not updated. The whole information in each overview, including opinion, indicators, charts and anything else, is provided only for familiarization purposes and is not financial advice or а recommendation. The whole text and its any part, as well as the charts cannot be considered as an offer to make a deal with any asset. IFC Markets and its employees under any circumstances are not liable for any action taken by someone else during or after reading the overview.
Peter Epstein of Epstein Research profiles a company with a project in the highly prospective Red Lake area as well as properties in Argentina’s Lithium Triangle.
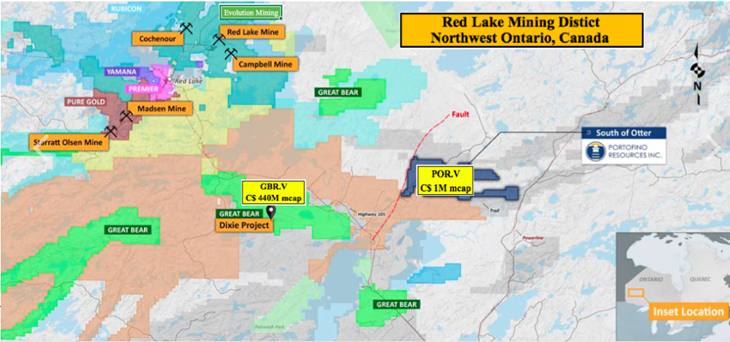
Last September Portofino Resources Inc. (POR:TSX.V; POT:FSE) announced a binding agreement for the right to acquire a 100% interest in mining claims in the famous Red Lake mining district of Ontario. Portofino joins both majors and juniors including Australia-listed Evolution Mining and Canada-listed Yamana, Great Bear Resources, Premier Gold Mines, Pure Gold, Rubicon Minerals, Pacton Gold, BTU Metals and GoldOn Resources.
Portofino’s block comprises 14 mining claims covering ~5,120 hectares. The claims are near investment crowd favorite Dixie project, being drilled out by Great Bear Resources (GBR). GBR’s latest results from a fully financed 200,000-meter drill program were impressive. One of several intervals was 48.7 grams per tonne (g/t) gold (Au) over 8.7 meters (m), including 1.2m @ 281.9 g/t Au.
Gold price had its best year (2019) in a decade .
So, ultra, high-grade Au mineralization, found at shallow depth (under 300m), across multiple drill programs in 20172019. GBR has a market cap of $440 million. Portofino’s 5,120- hectare “South of Otter” property is less than 10 km east of GBR’s 9,140-hectare flagship project.
If South of Otter hosts anything good, which remains to be seen, it might be high-grade Au, like Dixie, or high-grade copper (Cu) and zinc (Zn) mineralization, like that found on other nearby properties.
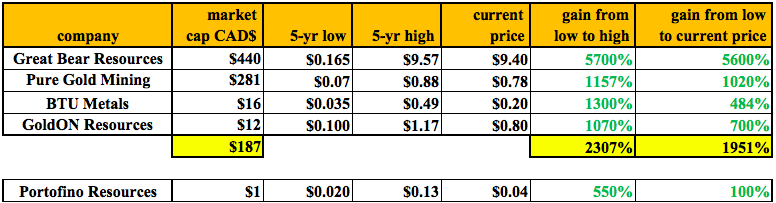
I’m shamelessly playing the close-olgy card here, but only because GBR is one of the best gold junior stories of the past decade, up ~5,600% from $0.165 in 4Q 2016 to $9.40 today. In fact, several juniors have done quite well. Pure Gold Mining is up ~1,020% since 4Q 2015. BTU Metals is up nearly 500% since 3Q 2018. One more, GoldON Resources, is up ~700% since 1Q 2019.
That’s four Red Lake juniors with spectacular share price success. Four out of roughly 16 (25%) publicly traded companies with all, or substantially all, of their gold and/or base metals assets in and around Red Lake, Ontario. Portofino, with a market cap of just $1 million is perhaps the smallest player in the entire district. Yet, its under-explored property is both sizable and meaningfully prospective.
South of Otter is located within a geological setting that hosts the past-producing South Bay Mine (1.6 Mt @ 11.1% Zn, 1.8% Cu and 2.1 oz./t silver (Ag). GBR’s Dixie project is also on this trend. In addition to being on trend, Portofino’s property lies in a similar geological and structural setting.
Two historical operators, Goldcorp (recently acquired by Newmont) and Tri Origins, compiled a vast amount of geophysical data that mapped structures within the South of Otter claims. Portofino has commenced geophysical and geochemical surveys to further understand the geology and mineralization associated with past discoveries, which lie just north of the property but strike onto Portofino’s claims.
Red Lake exploration program started last week
These surveys will provide Portofino with the data required to effectively target both gold and base metal mineralization and identify similar structures for exploration that are being explored along trend by companies including Great Bear Resources and BTU Metals. BTU recently reported an intercept of 44.3m of 1.14% Cu Eq, with intervals of up to 5.56% Cu, 99.6 g/t Ag plus 2 g/t Au.
Portofino’s CEO David Tafel stated,
“We have been able to acquire a very prospective land package in a known gold mining camp proximal to the Dixie project which has recently produced multiple high-grade gold discoveries by Great Bear Resources. This acquisition allows us to diversify our project portfolio while we continue to advance our lithium projects.”
The South of Otter property is ~40 km southeast of the town of Red Lake, Ontario, and less than 10 km east of GBR’s Dixie Lake. Historical work on the claims included prospecting, sampling and limited diamond drilling.
With the gold price up US$300/oz (+24%) from the low of 2019, management is wisely seizing an opportunity to conduct meaningful programs that may, in part, be guided by ongoing successes at neighboring projects. Active drill programs are underway on properties in virtually every direction from Portofino’s South of Otter property. In fact, one of the most aggressive drill campaigns in Canada (200,000 meters) is being done by Great Bear.
Portofino Resources’ South of Otter Property
To earn 100% interest in South of Otter, Portofino has agreed to issue 500k shares and make payments over a four-year period totaling $70,000. The property vendor will retain a 1.5% Net Smelter Return (NSR), of which one half, (0.75%), can be purchased for $400,000.
Management has completed a review of all available historical assessment work on the South of Otter property and has announced an initial exploration plan starting this week. According to the press release,
“The first phase of Portofino’s 2020 exploration program consists of ~25-line km of ground VLF/EM geophysics and soil geochemistry surveys. The objective is to delineate mineralized structures related to past gold and base metal discoveries in the region and outline targets for follow-up trenching and drilling. Multiple gold, copper and zinc deposits / prospects have been discovered both immediately to the north and south of the claim boundaries.”
Utilizing historical geological and airborne magnetic surveys has enabled the company to advance its exploration program rapidly and cost effectively. Combined with the new data to be collected from the upcoming program, the company expects to delineate mineralized structures related to past gold and base metal discoveries and outline targets for follow-up trenching and drilling.
Portofino’s property contains excellent targets for both Red Lake-style Au mineralization as well as gold-bearing base metal prospects. Historical work includes prospecting, sampling, plus limited drilling, as well as airborne magnetic geophysical surveys commissioned by a previous operator.
Portofino’s brine lithium prospects in Argentina are highly prospective
Readers may recall that Portofino Resources is also known as a lithium play. It has locked up (through favorable option structures) three projects in the heart of the Lithium Triangle.
In the first half of 2019, Portofino continued to move the ball forward on two of its three projects. Although it’s too early to know if the company has good lithium assets, one of its projects, Hombre Muerto West (HMW), is in the single best salar in Argentinasalar del Hombre Muerto.
Neighbors in and around Hombre Muerto include Livent Corp. (formerly FMC), Korean giant POSCO and Australia-listed Galaxy Resources. Last year, POSCO famously paid ~$364 million to Galaxy for 17,500 hectares, that’s ~$20,800/ha. That land package reportedly had a 2.54 million tonne LCE Indicated + Inferred resource.
Over the past few months, a number of lithium juniors and producers have seen significant rebounds in their share prices. Eight well-known namesNeo Lithium, Advantage Lithium, Lithium Americas, Ganfeng, Livent, Wealth Minerals, Standard Lithium and Bacanoraare up an average of 125% from 52-week lows.
Gold sentiment is high and lithium sentiment might be turning. Portofino now has two segments (lithium and gold), each of which could be worth considerably more than the company’s entire market cap of just $1 million.
It’s early days, but a raging bull market in precious metals (underway?) and/or a bounce in lithium prices could draw attention to Portofino Resources (TSX-V: POR) this year and next.
Peter Epstein is the founder of Epstein Research. His background is in company and financial analysis. He holds an MBA degree in financial analysis from New York University’s Stern School of Business.
Streetwise Reports Disclosure: 1) Peter Epstein’s disclosures are listed below. 2) The following companies mentioned in the article are billboard sponsors of Streetwise Reports: Great Bear Resources. Click here for important disclosures about sponsor fees. The information provided above is for informational purposes only and is not a recommendation to buy or sell any security. 3) Statements and opinions expressed are the opinions of the author and not of Streetwise Reports or its officers. The author is wholly responsible for the validity of the statements. The author was not paid by Streetwise Reports for this article. Streetwise Reports was not paid by the author to publish or syndicate this article. Streetwise Reports requires contributing authors to disclose any shareholdings in, or economic relationships with, companies that they write about. Streetwise Reports relies upon the authors to accurately provide this information and Streetwise Reports has no means of verifying its accuracy.
4) The article does not constitute investment advice. Each reader is encouraged to consult with his or her individual financial professional and any action a reader takes as a result of information presented here is his or her own responsibility. By opening this page, each reader accepts and agrees to Streetwise Reports’ terms of use and full legal disclaimer. This article is not a solicitation for investment. Streetwise Reports does not render general or specific investment advice and the information on Streetwise Reports should not be considered a recommendation to buy or sell any security. Streetwise Reports does not endorse or recommend the business, products, services or securities of any company mentioned on Streetwise Reports. 5) From time to time, Streetwise Reports LLC and its directors, officers, employees or members of their families, as well as persons interviewed for articles and interviews on the site, may have a long or short position in securities mentioned. Directors, officers, employees or members of their immediate families are prohibited from making purchases and/or sales of those securities in the open market or otherwise from the time of the interview or the decision to write an article until three business days after the publication of the interview or article. The foregoing prohibition does not apply to articles that in substance only restate previously published company releases. As of the date of this article, officers and/or employees of Streetwise Reports LLC (including members of their household) own securities of Newmont Goldcorp, a company mentioned in this article.
Disclosures: The content of this article is for information only. Readers fully understand and agree that nothing contained herein, written by Peter Epstein of Epstein Research [ER], (together, [ER]) about Portofino Resources, including but not limited to, commentary, opinions, views, assumptions, reported facts, calculations, etc. is not to be considered implicit or explicit investment advice. Nothing contained herein is a recommendation or solicitation to buy or sell any security. [ER] is not responsible under any circumstances for investment actions taken by the reader. [ER] has never been, and is not currently, a registered or licensed financial advisor or broker/dealer, investment advisor, stockbroker, trader, money manager, compliance or legal officer, and does not perform market making activities. [ER] is not directly employed by any company, group, organization, party or person. The shares of Portofino Resources are highly speculative, not suitable for all investors. Readers understand and agree that investments in small cap stocks can result in a 100% loss of invested funds. It is assumed and agreed upon by readers that they will consult with their own licensed or registered financial advisors before making any investment decisions.
At the time this article was posted, Peter Epstein owned shares of Portofino Resources and Portofino was an advertiser on [ER].
Readers understand and agree that they must conduct their own due diligence above and beyond reading this article. While the author believes he’s diligent in screening out companies that, for any reasons whatsoever, are unattractive investment opportunities, he cannot guarantee that his efforts will (or have been) successful. [ER] is not responsible for any perceived, or actual, errors including, but not limited to, commentary, opinions, views, assumptions, reported facts & financial calculations, or for the completeness of this article or future content. [ER] is not expected or required to subsequently follow or cover events & news, or write about any particular company or topic. [ER] is not an expert in any company, industry sector or investment topic.
Shares of Enphase Energy traded 40% higher, setting a new 52-week intraday high price, after reporting Q4/19 and FY/19 financial results.
After U.S. markets closed for trading yesterday afternoon, global solar energy technology firm Enphase Energy Inc. (ENPH:NASDAQ), which claims to be the world’s leading supplier of solar microinverters, announced financial results for the fourth quarter of 2019.
The company’s President and CEO Badri Kothandaraman reported on some of the operational and financial highlights indicating that in Q4/19 the firm increased revenue by 128% to $210.0 million, compared to $92.3 million in Q4/18. The firm noted that in Q4/19 GAAP gross margin was 37.1% and non-GAAP gross margin was 37.3%.
Enphase reported “GAAP net income of $116.7 million, including an income tax benefit of $72.2 million; non-GAAP net income of $52.0 million, and GAAP diluted earnings per share (EPS) of $0.88, including an income tax benefit of $0.54; and non-GAAP diluted EPS of $0.39.”
The company added that it shipped approximately 677 megawatts DC, or 2,112,725 microinverters in Q4/19. The firm stated that it achieved volume shipments of its highest power microinverter, the IQ 7A, as customers continued to seek module-level power electronics optimal for high-efficiency solar modules.
For FY/19 revenue was $624.3 million, compared to $316.2 million in FY/18 and GAAP net income was $161.1 million, or diluted EPS of $1.23. The company advised that FY/19 was the first full year of GAAP profitability in its history.
The company touched on a few of the business highlights in the quarter including that in November 2019 it entered into a strategic supply agreement with Sunrun Inc. to provide its seventh-generation Enphase IQ microinverters to Sunrun for use in its residential solar business.
In January 2020, Enphase announced that Petersen-Dean Inc. selected Enphase as its premier supplier of solar inverters and battery storage systems, and earlier this month the firm announced it joined forces with CREATON GmbH to deliver photovoltaic (PV) in-roof systems to residential solar customers throughout Germany.
The company provided some forward guidance and advised that it expects Q1/20 revenue to be within a range of $200-210 million, including $44.5 million of revenue for ITC safe harbor shipments and expects both GAAP and non-GAAP gross margin to be within a range of 36-39%.
Enphase Energy is a global energy technology company headquartered in Fremont, Calif., that “delivers smart, easy-to-use solutions that connects solar generation, storage and management on one intelligent platform.” The company states its microinverter technology, which produces a fully integrated solar plus storage solution, has “revolutionized the solar industry.” To date, the firm advised that it has shipped more than 25 million microinverters and deployed over 1,000,000 Enphase systems in 130 countries.
Enphase Energy started off the day with a market capitalization of around $1.9 billion with approximately 122.4 million shares outstanding and a short interest of about 18.1%. ENPH shares opened 18% higher today at $47.51 (+$7.34, +18.27%) over yesterday’s $40.17 closing price and reached a new 52-week high price this morning of $57.57. The stock has traded today between $47.30 and 57.57 per share and is currently trading at $55.53 (+$15.36, +38.24%).
Disclosure: 1) Stephen Hytha compiled this article for Streetwise Reports LLC and provides services to Streetwise Reports as an independent contractor. He or members of his household own securities of the following companies mentioned in the article: None. He or members of his household are paid by the following companies mentioned in this article: None. 2) The following companies mentioned in this article are billboard sponsors of Streetwise Reports: None. Click here for important disclosures about sponsor fees. 3) Comments and opinions expressed are those of the specific experts and not of Streetwise Reports or its officers. The information provided above is for informational purposes only and is not a recommendation to buy or sell any security. 4) The article does not constitute investment advice. Each reader is encouraged to consult with his or her individual financial professional and any action a reader takes as a result of information presented here is his or her own responsibility. By opening this page, each reader accepts and agrees to Streetwise Reports’ terms of use and full legal disclaimer. This article is not a solicitation for investment. Streetwise Reports does not render general or specific investment advice and the information on Streetwise Reports should not be considered a recommendation to buy or sell any security. Streetwise Reports does not endorse or recommend the business, products, services or securities of any company mentioned on Streetwise Reports. 5) From time to time, Streetwise Reports LLC and its directors, officers, employees or members of their families, as well as persons interviewed for articles and interviews on the site, may have a long or short position in securities mentioned. Directors, officers, employees or members of their immediate families are prohibited from making purchases and/or sales of those securities in the open market or otherwise from the time of the interview or the decision to write an article until three business days after the publication of the interview or article. The foregoing prohibition does not apply to articles that in substance only restate previously published company releases.
The reasons a green light is anticipated and how it relates to the closing of Avenue Therapeutics’ pending acquisition are discussed in an H.C. Wainwright & Co. report.
In a Feb. 13 research note, H.C. Wainwright & Co. analyst Ed Arce reported that the U.S. Food and Drug Administration (FDA) formally accepted Avenue Therapeutics Inc.’s (ATXI:NASDAQ) IV tramadol 50 mg and set Oct. 10, 2020, as the PDUFA date for it. “We expect intravenous (IV) tramadol’s approval by its PDUFA date,” Arce added.
The biopharma’s new drug application (NDA) for IV Tramadol called for the use of 50 mg in managing moderate to moderately severe pain in adults, in a medically supervised healthcare setting.
Arce indicated that H.C. Wainwright expects the FDA will approve this, based mainly on positive results from two pivotal Phase 3 trials. One study was of patients with hard tissue pain during recovering from bunionectomy, and the other involved patients with soft tissue pain following abdominoplasty. Another reason is that safety data submitted by Avenue Therapeutics in the NDA indicates that “tramadol abuse is uncommon and infrequent compared to other prescription opioids in the U.S. and European countries where IV tramadol is available,” the analyst explained.
In other news, Arce pointed out, Avenue Therapeutics is “on the way to passing the final hurdles of its InvaGen Pharmaceuticals acquisition” but four conditions must be met, all related to IV tramadol, for the transaction to be closed.
The FDA must approve IV Tramadol with a broad label allowing its use “for moderate to moderately severe pain” associated with all types of surgeries. IV Tramadol must not have any risk evaluation and mitigation strategies or other restrictions placed on it, and it must be classified as a Schedule IV substance. Assuming Avenue Therapeutics achieves these requirements, noted Arce, shareholders as of April 2021 will be able to receive payment for their shares.
H.C. Wainwright has a Buy rating and a $12 per share price target on Avenue Therapeutics, whose stock is currently trading at around $9.99 per share.
Disclosure: 1) Doresa Banning compiled this article for Streetwise Reports LLC and provides services to Streetwise Reports as an independent contractor. She or members of her household own securities of the following companies mentioned in the article: None. She or members of her household are paid by the following companies mentioned in this article: None. 2) The following companies mentioned in this article are billboard sponsors of Streetwise Reports: None. Click here for important disclosures about sponsor fees. 3) Comments and opinions expressed are those of the specific experts and not of Streetwise Reports or its officers. The information provided above is for informational purposes only and is not a recommendation to buy or sell any security. 4) The article does not constitute investment advice. Each reader is encouraged to consult with his or her individual financial professional and any action a reader takes as a result of information presented here is his or her own responsibility. By opening this page, each reader accepts and agrees to Streetwise Reports’ terms of use and full legal disclaimer. This article is not a solicitation for investment. Streetwise Reports does not render general or specific investment advice and the information on Streetwise Reports should not be considered a recommendation to buy or sell any security. Streetwise Reports does not endorse or recommend the business, products, services or securities of any company mentioned on Streetwise Reports. 5) From time to time, Streetwise Reports LLC and its directors, officers, employees or members of their families, as well as persons interviewed for articles and interviews on the site, may have a long or short position in securities mentioned. Directors, officers, employees or members of their immediate families are prohibited from making purchases and/or sales of those securities in the open market or otherwise from the time of the interview or the decision to write an article until three business days after the publication of the interview or article. The foregoing prohibition does not apply to articles that in substance only restate previously published company releases.
Disclosures from H.C. Wainwright & Co., Avenue Therapeutics Inc., First Take, February 13, 2020
Investment Banking Services include, but are not limited to, acting as a manager/co-manager in the underwriting or placement of securities, acting as financial advisor, and/or providing corporate finance or capital markets-related services to a company or one of its affiliates or subsidiaries within the past 12 months.
I, Ed Arce and Thomas Yip, certify that 1) all of the views expressed in this report accurately reflect my personal views about any and all subject securities or issuers discussed; and 2) no part of my compensation was, is, or will be directly or indirectly related to the specific recommendation or views expressed in this research report; and 3) neither myself nor any members of my household is an officer, director or advisory board member of these companies.
None of the research analysts or the research analyst’s household has a financial interest in the securities of Avenue Therapeutics, Inc. (including, without limitation, any option, right, warrant, future, long or short position).
As of January 31, 2020 neither the Firm nor its affiliates beneficially own 1% or more of any class of common equity securities of Avenue Therapeutics, Inc.
Neither the research analyst nor the Firm has any material conflict of interest in of which the research analyst knows or has reason to know at the time of publication of this research report.
The research analyst principally responsible for preparation of the report does not receive compensation that is based upon any specific investment banking services or transaction but is compensated based on factors including total revenue and profitability of the Firm, a substantial portion of which is derived from investment banking services.
The Firm or its affiliates did not receive compensation from Avenue Therapeutics, Inc. for investment banking services within twelve months before, but will seek compensation from the companies mentioned in this report for investment banking services within three months following publication of the research report.
The Firm does not make a market in Avenue Therapeutics, Inc. as of the date of this research report.
H.C. Wainwright & Co., LLC and its affiliates, officers, directors, and employees, excluding its analysts, will from time to time have long or short positions in, act as principal in, and buy or sell, the securities or derivatives (including options and warrants) thereof of covered companies referred to in this research report.
Egypt’s central bank left its key interest rates unchanged for the second consecutive month, saying it had lowered its rates by 350 basis points during the second half of last year and keeping them steady remains consistent with achieving its inflation target and supporting lower inflation in the medium term.
The Central Bank of Egypt (CBE) left its overnight deposit rate, the overnight lending rate, the rate of the main operation and the discount rate steady at 12.25 percent, 13.25 percent, 12.75 percent and 12.75 percent, respectively.
The decision to maintain rates was expected by roughly half of analysts’ surveyed as CBE was not considered to be in any rush to lower rates while inflation is picking up.
CBE has cut its rate six times and by a total of 650 basis points since February 2018, including four cuts of 450 basis points in 2019. From August through November the rate was cut 350 points.
Egypt’s headline inflation inched up to 7.2 percent in January from 7.1 percent in December, mainly due to higher food prices such as poultry and fresh vegetables, while core inflation rose to 2.7 percent from 2.4 percent.
Despite this recent uptick, inflation still remains well below CBE’s target of 9.0 percent, plus/minus 3 percentage points, for the fourth quarter of 2020.
CBE said its monetary policy was still supporting private domestic demand, which has outpaced exports as the main driver of economic activity in the first three quarters of last year, driven by growth in private investments.
Egypt was hit hard by the Arab Spring in 2011, which ended Hosni Mubarak’s 30-year rule, as it scared off tourists and foreign investors, resulting in a persistent shortage of foreign currency.
But helped by the appointment of Tarek Amer as CBE governor in November 2015 – he reformed the banking system and the foreign exchange market – and a 2016 agreement with the International Monetary Fund (IMF), Egypt’s economy has rebounded.
Egypt’s gross domestic product grew an annual 5.6 percent in the third quarter of last year, slightly down from 5.7 percent in the second quarter but up from 5.5 percent in the year ago quarter.
“However, disruptions to global economic activity following the recent coronavirus outbreak could weigh on the global economic outlook, at least in the near term,” CBE said, adding oil prices have declined from lower demand but still remain volatile due to geopolitical risks.
Since January last year the Egyptian pound has steadily appreciated, with its rise accelerating this month.
Today the pound eased after the policy decision to trade at 15.57 to the U.S. dollar to be up 2.8 percent since the start of this year and some 22 percent since the pound lost about half its value in the wake of the decision to float the pound in November 2016. The collapse in the pound in 2016 boosted inflation to 33 percent in July 2017 and CBE quickly raised its key interest rate by 400 basis points that year to curb the pass-through of higher import prices to overall inflation. After the initial surge in inflation, it began decelerating in the second half of 2017 and fell to 3.1 percent in October last year – the lowest since December 2005 – before picking up speed in the last three months.
The Central Bank of Egypt issued the following statement:
“The Monetary Policy Committee (MPC) decided to keep the Central Bank of Egypt’s (CBE) overnight deposit rate, overnight lending rate, and the rate of the main operation unchanged at 12.25 percent, 13.25 percent, and 12.75 percent, respectively. The discount rate was also kept unchanged at 12.75 percent. Annual headline urban inflation recorded 7.2 percent in January 2020 compared to 7.1 percent in December 2019, as monthly inflation recorded 0.7 percent in January 2020 compared to 0.6 percent in January 2019. Monthly headline inflation in January 2020 was mainly driven by higher food prices as well as by higher non-food prices but with a lesser extent. Meanwhile, annual core inflation increased to 2.7 percent in January 2020 compared to 2.4 percent in December 2019. Annual inflation rates came in line with the expectations of the Central Bank of Egypt. Real GDP growth stabilized around 5.6 percent in 2019 H2 compared to its level in FY2018/19. Monetary policy continued to support private domestic demand, which has outpaced net exports as the main driver of economic activity in the first three quarters of 2019, driven by the acceleration in private investment growth. While the expansion of global economic activity stabilized, financial conditions and uncertainty regarding trade policies eased somewhat. However, disruptions to global economic activity following the recent coronavirus outbreak could weigh on the global economic outlook, at least in the near term. Meanwhile, international oil prices declined due to lower demand, yet remain subject to volatility due to potential supply-side factors that include geopolitical risks. Regarding the labor market, the unemployment rate recorded 8.0 percent in 2019 Q4 compared to 7.8 percent and 7.5 percent in 2019 Q3 and Q2, respectively. Nevertheless, employment continued to recover on a quarterly basis for the fourth consecutive quarter. Against this background, and following the cumulative reduction of 350 basis points during the second half of 2019, the MPC decided that keeping key policy rates unchanged remains consistent with achieving the inflation target of 9 percent (±3 percentage points) in 2020 Q4 and supporting the disinflation path over the medium-term. The MPC closely monitors all economic developments and will not hesitate to resume its easing cycle subject to further moderation of inflationary pressures.” www.CentralBankNews.info
Indonesia’s central bank returned to the easing path after a three month pause by cutting its benchmark 7-day reverse repo rate by another 25 basis points to 4.75 percent “to maintain domestic economic growth momentum in the face of a global economic recovery potentially restrained by the recent Covid-19 outbreak.”
It was the first rate cut by Bank Indonesia (BI) since October 2019 and its key rate has now been lowered by 125 basis points since July last year when it began easing its monetary policy stance preemptively in the face of the threat to the global economy from uncertainty over the trade war between China and the U.S.
In addition to cutting its benchmark rate, BI also lowered its deposit rate by 25 basis points to 4.0 percent and the lending rate by the same amount to 5.50 percent.
To ensure adequate liquidity in the banking system and support the transmission of its accommodative policy stance, BI said it would adjust the calculation of its macroprudential intermediation ratio (MIR) by expanding the funding and financing purview of foreign bank branches and strengthen the payment system toward fostering economic growth.
“Moreover, Bank Indonesia will continue to strengthen coordination with the Government and other relevant authorities to maintain economic stability and catalyst domestic demand, while accelerating structural reforms and implementing efforts to mitigate the impact of Covid-19,” BI said.
Despite the recent phase 1 trade deal between China and the U.S., which BI said had helped ease global uncertainty, the optimism generated about the global economy has been eroded by the virus, which is expected to dent China’s economy and impede the global recovery, “at least during the first quarter of 2020.”
BI lowered its forecast for global growth this year to 3.0 percent from an earlier 3.1 percent but raised its forecast for 2021 growth to 3.4 per cent from 3.2 percent.
“Covid-19 has rattled global financial markets, increasing risk and triggering a reversal of global flows from developing countries to safe-have assets and commodities, which has intensified currency risks in emerging market countries,” BI said.
Indonesia’s economy slowed last year to 5.02 percent from 5.17 percent in 2018 and BI lowered its forecast for this year to a range of 5.0 – 5.4 percent from an earlier forecast of 5.1 – 5.5 percent “due to the potentially muted global economic recovery in light of the recent Covid-19 outbreak, which will impact Indonesia’s economy through the tourism, trade and investment channels.”
Economic activity in 2021 is expected to accelerate, with growth of 5.2 – 5.6 percent, BI said.
Indonesia’s inflation rate has been decelerating for the last five months and fell to 2.68 percent in January due to deflation of administered prices but BI said core inflation remains under control and in line with its policy of anchoring inflation expectations and maintaining an exchange rate of the rupiah that is in line with its fundamental value.
BI expects inflation to remain within its target corridor of 3.0 percent, plus/minus 1 percentage point, in 2020 and 2021.
After falling in the first 10 months of 2019, Indonesia’s rupiah bounced back until late January when it, and other emerging market currencies, were hit by the shift in investors’ sentiment following the Covid-19 outbreak.
Today the rupiah eased further in response to the rate cut to trade at 13,745 to the U.S. dollar but remains 1.3 percent higher than the start of 2020.
Bank Indonesia released the following statement:
“The BI Board of Governors agreed on 19th and 20th February 2019 to lower the BI 7-day Reverse Repo Rate by 25 bps to 4,75%, Deposit Facility (DF) rates lowered 25 bps to 4,00% and Lending Facility (LF) rates lowered 25 bps to 5,50%. Monetary policy remains accommodative and is consistent with controlled inflation in the target corridor, maintained external stability as well as pre-emptive measures to maintain domestic economic growth momentum in the face of a global economic recovery potentially restrained by the recent Covid-19 outbreak. Furthermore, Bank Indonesia will continue to orient monetary operations towards maintaining adequate liquidity and supporting the transmission of an accommodative policy mix. Meanwhile, Bank Indonesia will maintain accommodative macroprudential policy to stimulate economic financing with respect to the suboptimal financial cycle, while also adhering to prudential principles. To that end, Bank Indonesia will adjust the calculation of the Macroprudential Intermediation Ratio (MIR) by expanding the funding and financing purview for foreign bank branches towards further national economic advancement. In addition, Bank Indonesia will continue to strengthen payment system policy towards fostering economic growth through the expansion of QRIS (Quick Response Code Indonesian Standard) acceptance and electronification of social aid program (bansos) disbursements and local government financial transactions. Moving forward, Bank Indonesia will monitor global and domestic economic developments in order to fully utilise the room available to implement an accommodative policy mix to maintain controlled inflation and external stability as well as to support economic growth momentum. Moreover, Bank Indonesia will continue to strengthen coordination with the Government and other relevant authorities to maintain economic stability and catalyse domestic demand, while accelerating structural reforms and implementing efforts to mitigate the impact of Covid-19.
The global economic recovery process has been hampered by the Covid-19 (coronavirus disease 2019) outbreak since the end of January 2020. Nevertheless, the Phase 1 Trade Deal agreed between the United States and China has helped to ease global uncertainty and stoke economic optimism concerning the global economic recovery outlook. The latest reading on a number of global economic indicators, such as consumer confidence, Purchasing Managers Index (PMI) and export orders, recorded gains from December 2019-January 2020. Optimism has been eroded, however, by the Covid-19 outbreak, which is expected to subdue economic performance in China and impede the global economic recovery process, at least during the first quarter of 2020. Bank Indonesia has revised down its global economic growth projection for 2020 from 3.1% to 3.0% before accelerating to 3.4% in 2021, up from the 3.2% projected previously for 2021. Covid-19 has rattled global financial markets, increasing risk and triggering a reversal of global flows from developing countries to safe-haven assets and commodities, which has intensified currency risk in emerging market countries. Moving forward, efforts to contain Covid-19 demand vigilance due to the potential impact on economic growth, trade volume and international commodity prices as well as capital flows to and from developing countries, including Indonesia.
Efforts are required to stimulate national economic growth and ensure economic resilience in the face of a potentially restrained global economic recovery. In 2019, national economic growth was solid at 5.02% despite declining from 5.17% in 2018. Solid domestic demand remains a key driver of economic growth, while exports languish on compressed global demand and sliding commodity prices. Regionally, solid domestic demand is supported by increasing inter-regional trade, such as in Sumatra. In addition, economic growth in Kalimantan and Bali-Nusa Tenggara has been maintained as exports of primary commodities improve. Moving forward, Bank Indonesia projects lower economic growth in 2020 at 5.0-5.4%, downgraded from 5.1-5.5%, before accelerating in 2021 to 5.2-5.6%. Bank Indonesia has revised down its projection for 2020 due to the potentially muted global economic recovery in light of the recent Covid-19 outbreak, which will impact Indonesia’s economy through the tourism, trade and investment channels. Nonetheless, Bank Indonesia will continue to strengthen coordination with the government and other relevant authorities to strengthen the sources, structure and speed of economic growth, while attracting investment through infrastructure projects and implementation of the Omnibus Bill on Job Creation and Taxation.
Indonesia’s balance of payments has continued gaining strength, thereby bolstering external resilience. For 2019 as a whole, the overall balance of payments recorded a USD4.7 billion surplus after experiencing a USD7.1 billion deficit in 2018. The gain comes amidst a significant capital and financial account surplus in line with maintained national economic performance, highly attractive financial markets and less global financial market uncertainty. Furthermore, the current account deficit has also declined from 2.94% of GDP in 2018 to just 2.72% of GDP in 2019. The latest reading in January 2020 points to a net inflow of foreign capital to the domestic financial markets totalling USD6.3 billion. At the beginning of February 2020, however, foreign capital inflows, portfolio investment in particular, experienced a correction in response to the Covid-19 outbreak. Meanwhile, the trade balance recorded a USD0.86 billion deficit in the reporting period in line with sluggish exports due to global economic headwinds. The position of reserve assets at the end of January 2020 stood at USD131.7 billion, equivalent to 7.8 months of imports or 7.5 months of imports and servicing government external debt, which is well above the international adequacy standard of around three months of imports. Moving forward, Bank Indonesia will constantly strengthen coordination with the government in order to bolster external sector resilience, including attracting foreign direct investment, and controlling the current account deficit, which is projected in the 2.5-3.0% of GDP range in 2020 and 2021.
The rupiah exchange rate remains stable and consistent with the currency’s fundamental value, underpinned by a robust balance of payments. As of 19th February 2020, the rupiah had strengthened by an average of 0.27% compared to the January 2020 level, despite depreciating 0.24% (ptp) on the level recorded at the end of January 2020. A softer rupiah at the beginning of February 2020 was triggered by negative sentiment surrounding Covid-19, before quickly stabilising due to the foreign exchange supplied by exporters as well as maintained foreign capital inflows. The rupiah appreciated in January 2020 by an average of 2.13% compared with the December 2019 average level. Looking forward, Bank Indonesia predicts rupiah stability in line with the currency’s fundamental value and maintained market mechanisms. Furthermore, Bank Indonesia will continue to accelerate financial market deepening, targeting the money market and foreign exchange market in particular, in order to support exchange rate policy effectiveness and strengthen domestic financing.
Low and stable inflation was maintained in 2019, thus supporting economic stability. CPI inflation in January 2020 stood at 0.39% (mtm) or 2.68% (yoy), influenced by controlled core inflation, administered prices (AP) deflation and a slight build-up of inflationary pressures on volatile foods (VF). Core inflation has remained under control in line with policy consistency by Bank Indonesia to anchor rational inflation expectations, including maintaining rupiah exchange rates in line with the currency’s fundamental value. Administered prices experienced deflationary pressures in the reporting period due to lower special fuel prices and the normalisation of airfares after the recent spike in response to high demand during the festive period. In contrast, VF inflation intensified due, amongst others, to disruptions affecting the production and distribution of various volatile foods, triggered by widespread flooding in various regions. Moving forward, Bank Indonesia will consistently maintain price stability and strengthen policy coordination with the central and local governments in order to maintain low and stable inflation within the target corridor for 2020 and 2021, namely 3.0%±1%.
Effective transmission of the accommodative monetary policy stance has been strengthened by adequate liquidity in the banking industry. Liquidity in the money market and banking industry remains adequate, as reflected by a high average daily transaction volume in the interbank money market during January 2020 at Rp15.12 trillion, together with a high ratio of liquid assets to deposits of 20.86% recorded in December 2019. Monetary policy transmission through the interest rate channel to the money market remains effective, as reflected by a further 103bps decline in the overnight interbank rate to 4.81% and a 119bps decrease in the 1-week JIBOR to a level of 5.05% since the end of June 2019, before Bank Indonesia initiated policy rate reductions in July 2019. In addition, transmission of lower interest rates to the banking industry continues, with the weighted average deposit rate recorded at 6.22% in January 2020, falling 61bps since the end of June 2019. On the other hand, lending rates have come down 29bps to 10.13% in the same period. Meanwhile, growth of narrow money (M1) and broad money (M2) in December 2019 followed the current economic growth trend at 7.43% (yoy) and 6.54% (yoy) respectively. Bank Indonesia will continue to ensure adequate liquidity and enhance money market efficiency, while strengthening transmission of the accommodative policy mix.
Financial system stability has been maintained despite the bank intermediation function still demanding attention. Financial system stability was reflected by a high Capital Adequacy Ratio (CAR) of 23.31% in December 2019 coupled with a low level of non-performing loans (NPL) at 2.53% (gross) or 1.18% (nett). Meanwhile, credit growth remains sluggish, decelerating from 7.05% (yoy) in November 2019 to 6.08% (yoy) in December 2019. Furthermore, deposit growth is also suboptimal, declining from 6.72% (yoy) in November 2019 to 6.54% (yoy) in December 2019. Moving forward, Bank Indonesia will continue to stimulate the bank intermediation function in order to underpin economic growth momentum. Bank Indonesia projects growth of outstanding loans disbursed by the banking industry in 2020 in the 9-11% range, revised down from 10-12% previously in line with the downgraded projection for economic growth in 2020. On the other hand, Bank Indonesia projects deposit growth in 2020 and 2021 in the 8-10% range. Bank Indonesia will maintain an accommodative macroprudential policy stance and strengthen coordination with other relevant authorities in order to maintain financial system stability and catalyse the bank intermediation function.
Payment system availability, both cash and non-cash, remains uninterrupted. The position of currency in circulation grew 6.61% (yoy) in January 2020, while non-cash payment transactions using ATM/debit cards, credit cards and electronic money declined 0.76% (yoy) over the same period, dominated by ATM/debit cards with a 93.16% share. Vibrant growth of e-money transactions was maintained in January 2020 at 172.85% (yoy), evidencing greater public uptake of digital currency. Bank Indonesia continuously strengthens payment system policy to support national economic growth momentum through digital economic and financial transformation. Bank Indonesia is planning to organise National QRIS Week 2020 throughout all provinces of the archipelago in order to expand QRIS acceptance. Furthermore, coordination with the government will be strengthened to accelerate transaction electronification, social aid program (bansos) disbursements and local government financial transactions in particular. Moving forward, Bank Indonesia will continue to maintain the continuity of a fast, simple, affordable, secure and reliable payment system, supported by integrated supervision and strong consumer protection.”
By TheTechnicalTraders – As we continue to get more and more information related to the Coronavirus spreading across Asia and Europe, the one thing we really must consider is the longer-term possibility that major global economies may contract in some manner as the Chinese economy is currently doing. The news suggests over 700+ million people in China are quarantined. This is a staggering number of people – nearly double the total population of the entire United States.
If the numbers presented by the Chinese are accurate, the Coronavirus has a very high infection rate, yet a moderately small mortality rate (2~3%). Still, if this virus continues to spread throughout the world and infects more and more people, there is a very real potential that 20 to 50 million people may be killed because of this event. It may become one of the biggest Black Swan events in recent history.
We really won’t know the total scope of the damage to the Chinese and Asian economies for another 35+ days – possibly longer. The information we have been able to pull from available news sources and from the Chinese press is that hundreds of millions are quarantined, the Chinese Central Bank is pouring capital into their markets in order to support their frail economy and, just recently, President Xi suggested stimulus will not be enough – austerity measure will have to be put into place to protect China from creating a massive debt-trap because of this virus.
Austerity is a process of central bank planners cutting expenses, cutting expansion plans, cutting everything that is not necessary and planning for longer-term economic contraction. It means the Chinese are preparing for a long battle and are attempting to protect their wealth and future from an extreme collapse event.
From an investor standpoint, FANG stocks have outperformed the S&P, NASDAQ and DOW JONES indexes by many multiples over the past 5~6 years. The chart below highlights the rally in the markets that originated in late 2016 (think 2016 US Presidential Election) and the fact that foreign capital poured into the US stock market chasing expected returns promised by future President Trump.
It becomes very clear that the FANG stocks rallied very quickly after the elections were completed and continued to pull away from valuation levels of the S&P, NASDAQ and DOW JONES US indexes. How far has the FANG index rallied above the other US major indexes? At some points, the FANG index was 30~40% higher than the biggest, most mature industries within the US. In late 2018, everything contracted a bit – including the FANG index.
As or right now, the FANG index has risen nearly 274% from October 2014. The S&P has risen nearly 60% over that same time. The NASDAQ has risen 140% and the S&P 500 Info Tech Index rose 180%. The reality is that capital has poured into the technology sector, FANG stocks and various other US stock market indexes chasing this incredible rally event.
This Netflix Weekly chart highlights what we believe are some of the early signs of weakness in the FANG sector. The sideways FLAG formation suggests NFLX has reached a peak in early 2018 and investors have shied away from pouring more capital into this symbol while the Technology index and FANG index have continued to rally over the past 8+ months.
This Weekly Custom FANG Index chart highlights the rally that took place after October 2018 and continues to drive new highs today. This move on our Custom FANG index shows a very clear breakout rally taking place which is why we believe more foreign capital poured into the US markets as the US/China trade deal continued to plague the global markets and as BREXIT and other economic issues started to weigh on economic outputs. What did investors do to avoid these risks? Pour their capital into the hot US technology sector.
Another chart we like to review is our Custom Technology Index Weekly chart. This chart shows a similar pattern to the FANG chart above, yet it presents a very clear picture of the excessive price rally and rotation that has taken place over the past 5+ months. The real risk with this trend is that investors may start to believe “it will go on forever” and “there is no risk in these trades”. There is a very high degree of risk in these trades. Once the bubble bursts, the downside move may become very violent and shocking.
A reversion event, bubble burst event, in the technology sector as a result of the economic collapse in China and throughout other areas of the world may break this rally in the technology sector at some point and may push investors to re-evaluate their trading plans. Until investors understand the risks setting up because of the Coronavirus and the potential for a 20%, 30%, even 40% decrease in economic activity and consumer spending may finally push global investors to really think about the true valuations within the FANG/Technology sector.
We writing this article to alert you to the very real fact that “what goes up – must come down” at some point. Pay attention to how this plays out and what may cause global investors to suddenly change their opinion of the Technology sector. A pullback in this sector may result in a -40% to -50% price reversion.
We believe the economic collapse and humanitarian crisis that is unfolding in China may be enough to put a massive dent in future expectations for 2020 and 2021. You simply can’t have a major global economic collapse in this manner without having some type of cross-over event. As we learned in 2008-09 with the US credit crisis – when a major economy collapses its assets and financial markets, the ripples spread across the globe. China may become the next financial crisis event for the new decade.
Join my Swing Trading ETF Wealth Building Newsletter if you like what you read here and ride my coattails as I navigate these financial markets and build wealth while others lose nearly everything they own.