As we can see in the H4 chart, the convergence made GBPUSD reverse after falling and reaching 50.0%, and rebound towards 38.2% fibo. However, this growth shouldn’t be considered as reverse as long as the price is moving below the resistance at 23.6% fibo (1.3203). At the same time, one can’t exclude a possibility of a new decline towards 61.8% fibo at 1.2700.
The H1 chart shows a rising pullback after the downtrend, which has already reached 23.6% fibo and may continue towards 38.2% and 50.0% fibo at 1.3103 and 1.3182 respectively. If the price breaks the support (the low at 1.2848), the mid-term descending tendency will continue.
EURJPY, “Euro vs. Japanese Yen”
As we can see in the H4 chart, after the pair had corrected to the downside by 61.8%, there was a convergence that made EURJPY start a new rising impulse, which has already risen towards 61.8% fibo. The current short-term decline may be considered as a pullback before a new ascending impulse; the upside targets may be 76.0% fibo at 121.81 and the high at 122.87. Later, the market may break the high and continue growing towards the post-correctional extension area between 138.2% and 161.8% fibo at 124.55 and 125.57 respectively.
The H1 chart shows a new correction to the downside, which has already reached 61.8% fibo and may yet continue towards 76.0% fibo at 119.17. Anyway, after the pullback is over, the instrument is expected to resume growing to reach the local high at 121.40.
Attention! Forecasts presented in this section only reflect the author’s private opinion and should not be considered as guidance for trading. RoboForex LP bears no responsibility for trading results based on trading recommendations described in these analytical reviews.
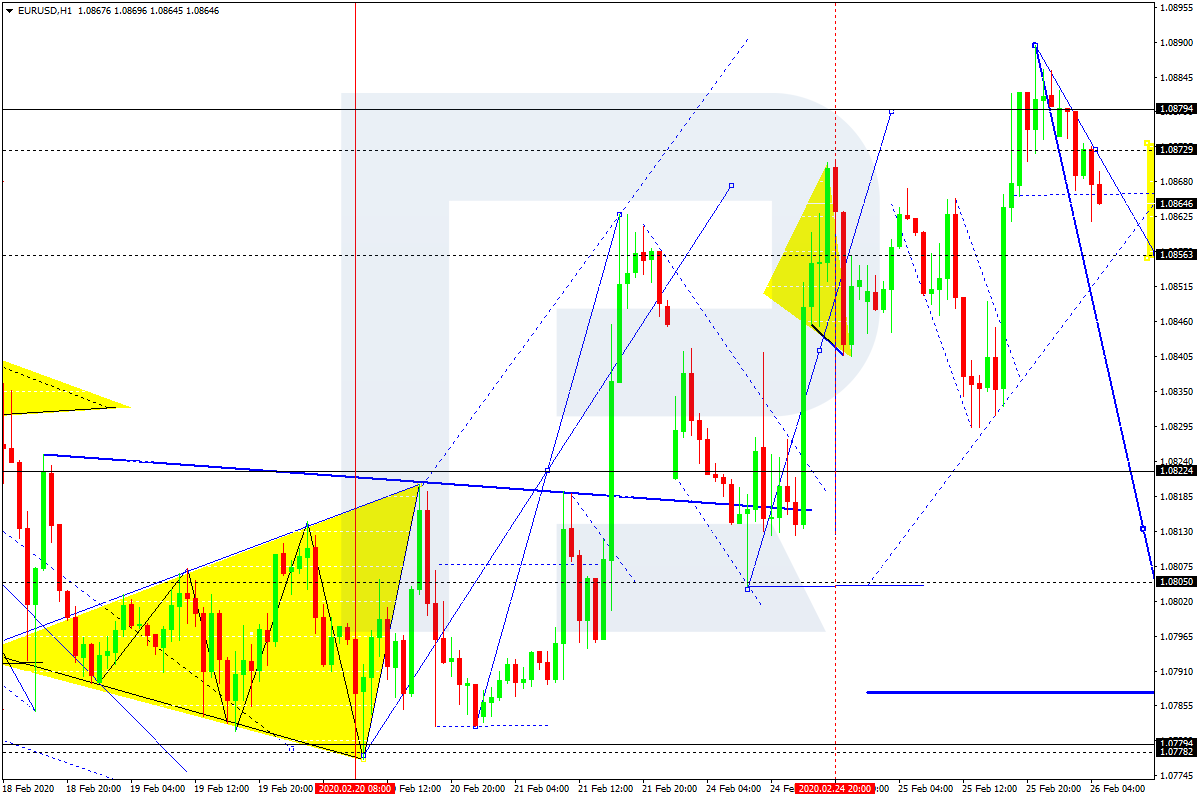
After updating the high at 1.0888, EURUSD is falling towards 1.0856. Possibly, the pair may reach this level and then start another correction towards 1.0872. Later, the market may form a new descending structure with the short-term target at 1.0840.
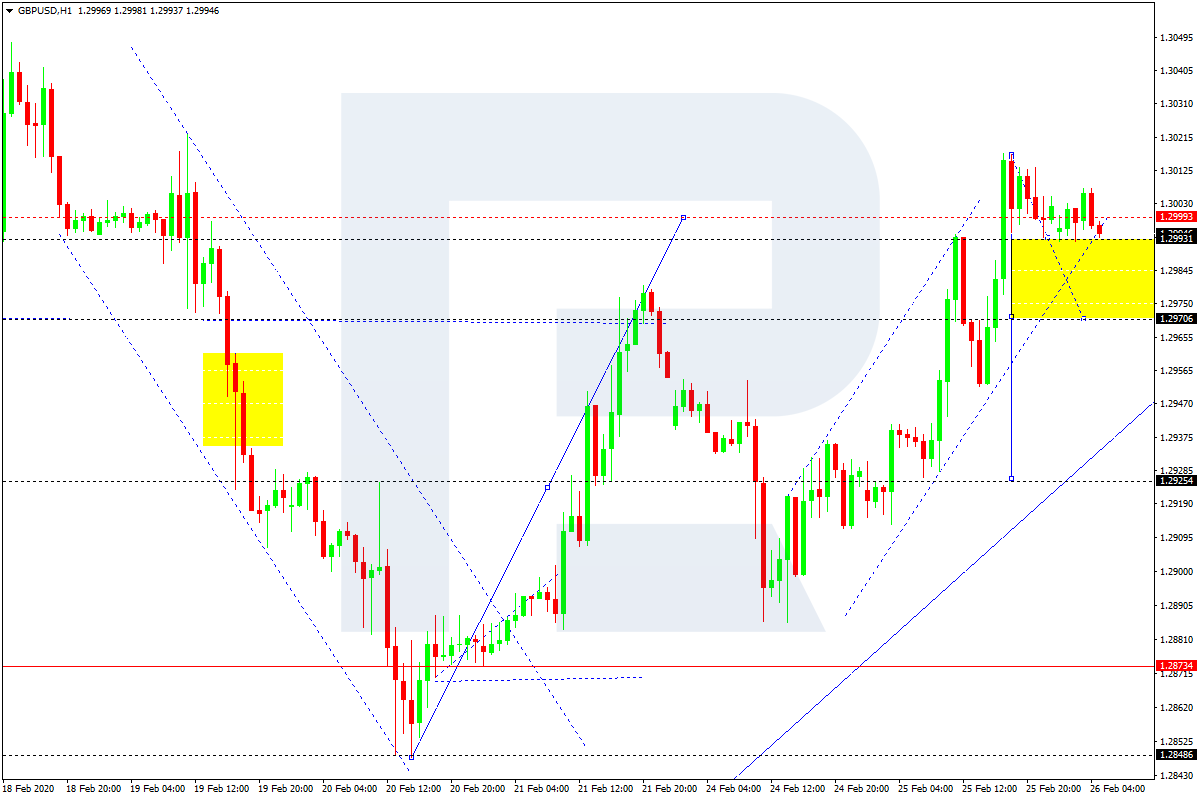
GBPUSD, “Great Britain Pound vs US Dollar”
GBPUSD has completed the ascending correction; right now, it is forming a new descending structure towards 1.2970. After that, the instrument may start another growth to reach 1.2993 and then trading downwards with the first target at 1.2929.
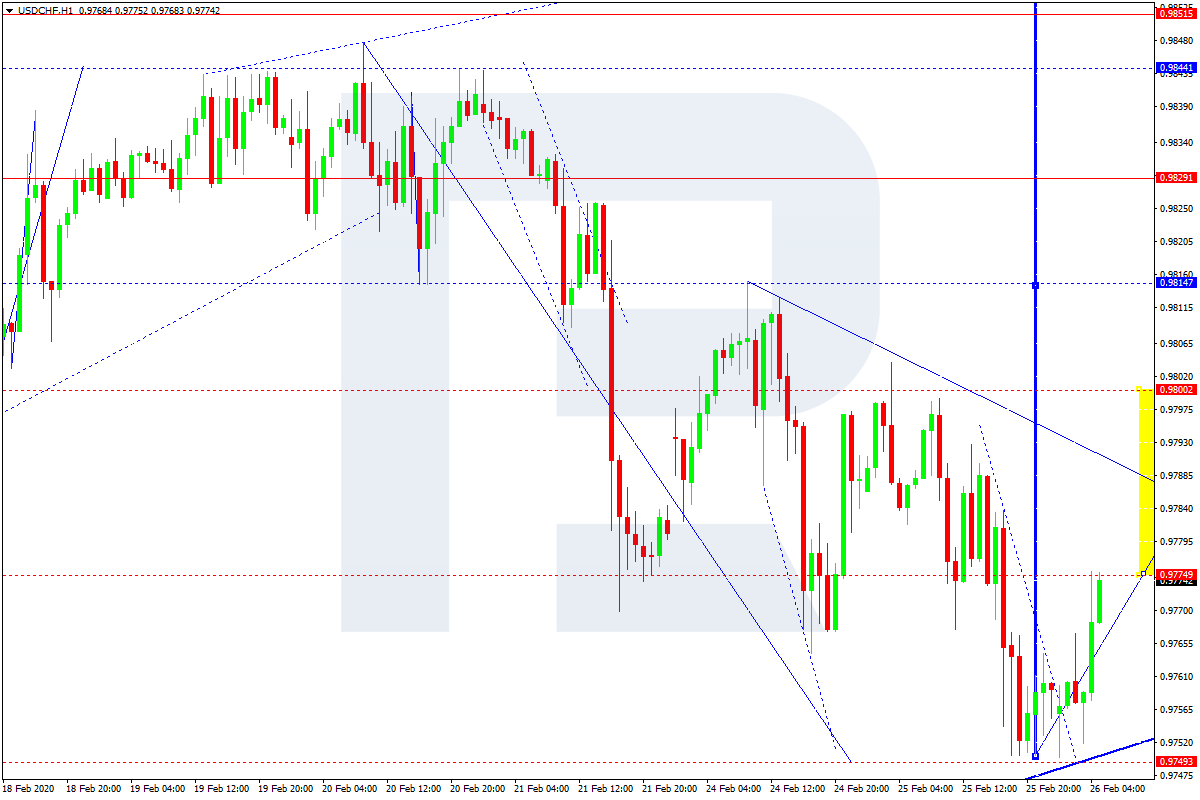
USDCHF, “US Dollar vs Swiss Franc”
After finishing the descending structure at 0.9750, USDCHF is trading upwards to reach 0.9799. Later, the market may start a new decline towards 0.9777 and then form one more ascending structure with the target at 0.9815.
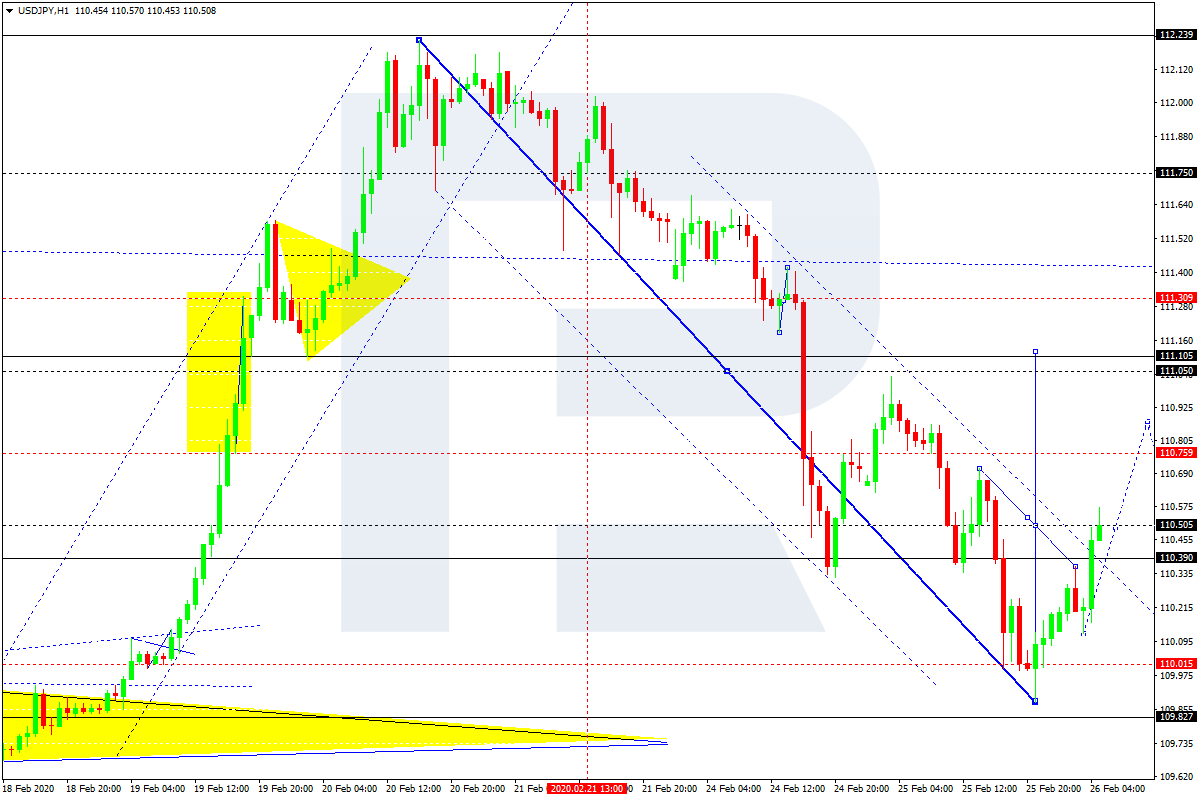
USDJPY, “US Dollar vs Japanese Yen”
USDJPY is growing towards 111.10. The main scenario implies that the price may reach this level and then resume falling towards 110.60. After that, the instrument may form one more ascending structure with the target at 111.75.
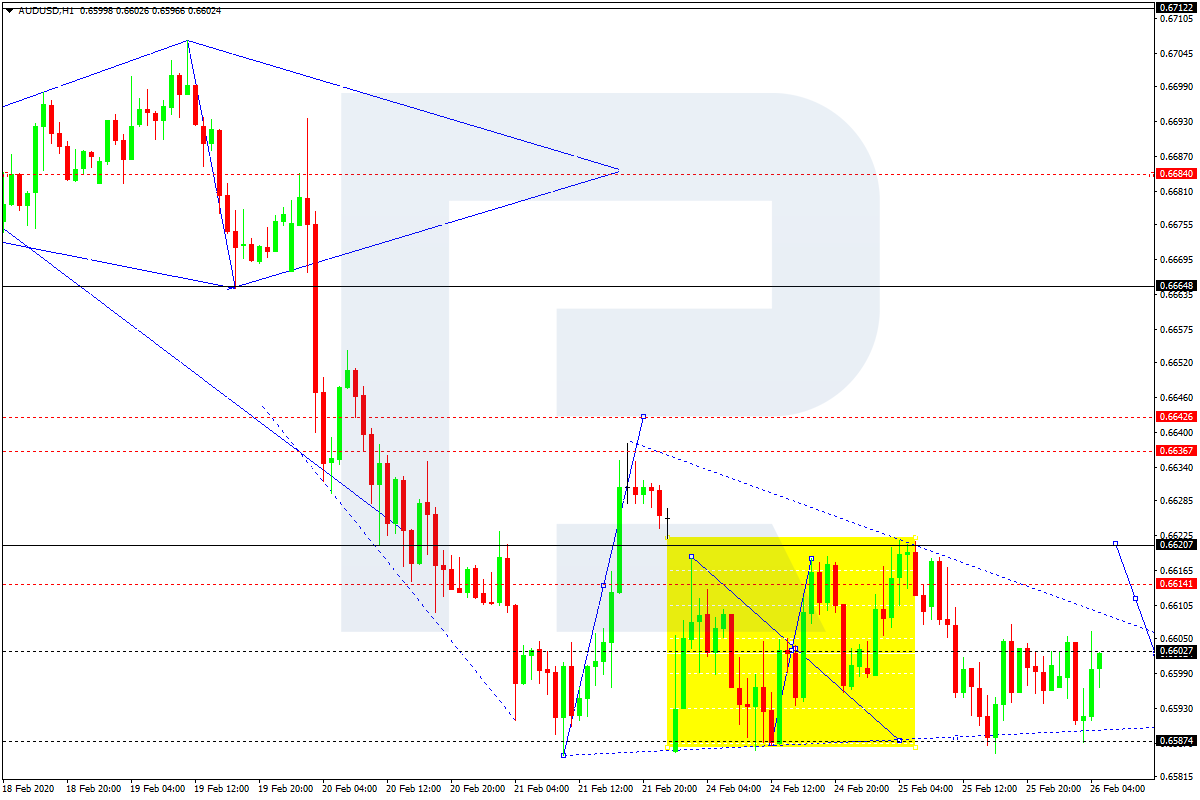
AUDUSD, “Australian Dollar vs US Dollar”
AUDUSD is still consolidating around 0.6602 without any particular direction. If later the price breaks this range to the upside, the market may start a new correction towards 0.6666; if to the downside – resume trading inside the downtrend with the target at 0.6540.
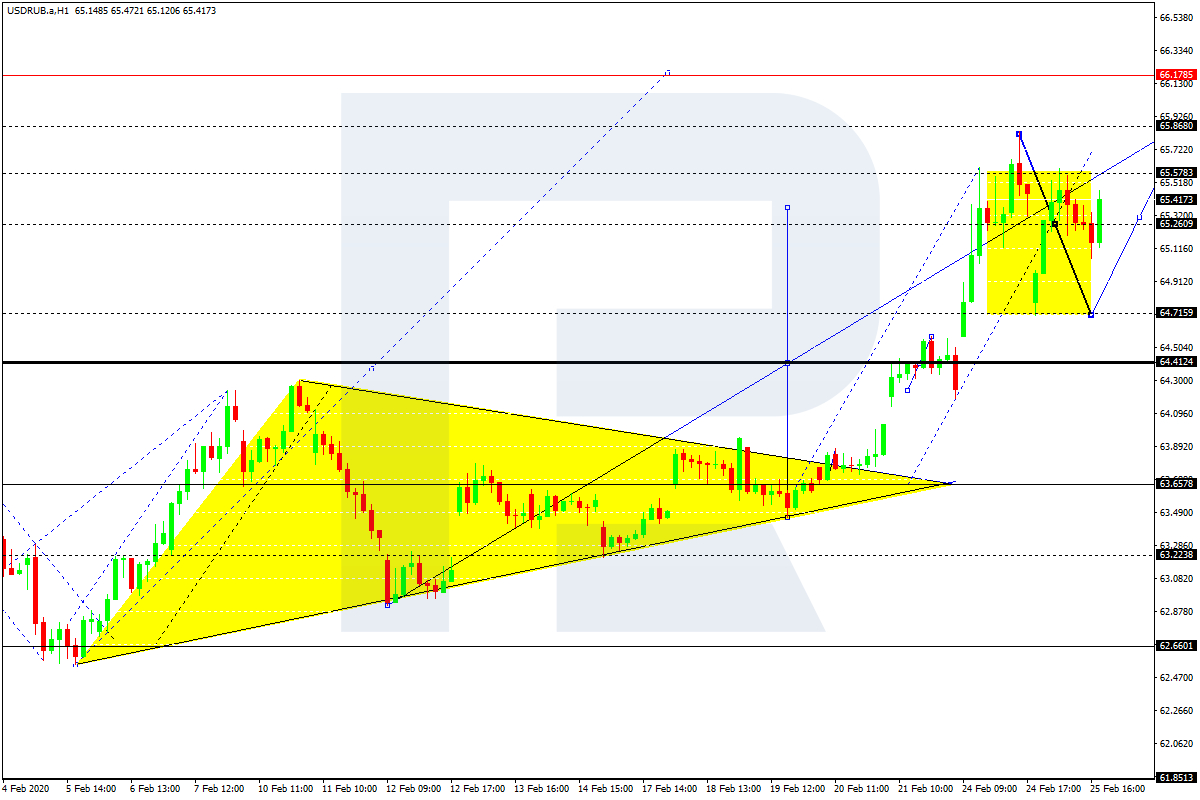
USDRUB, “US Dollar vs Russian Ruble”
After completing the descending impulse towards 64.74, USDRUB has returned to 65.57; right now, it is consolidating around 65.25. Possibly, the pair may expand the range up to 65.85 and then start a new decline towards 64.40. After that, the instrument may resume trading upwards with the target at 66.16.
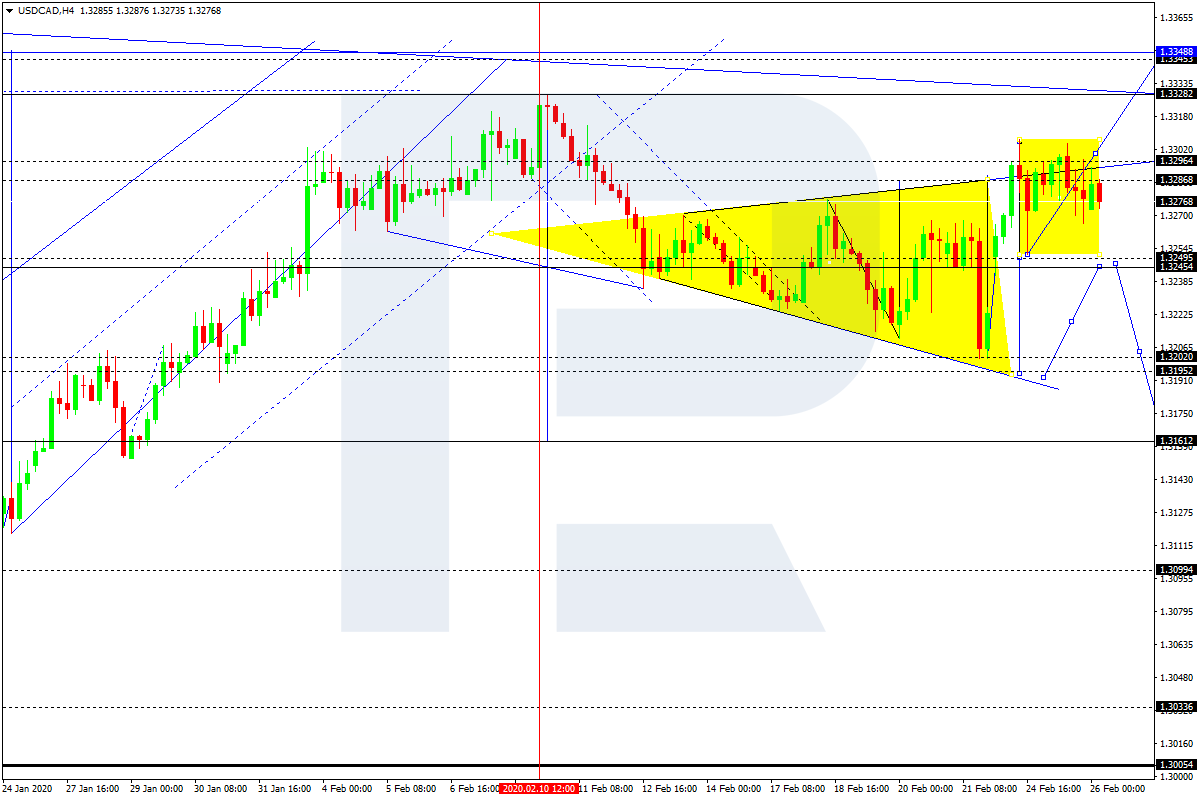
USDCAD, “US Dollar vs Canadian Dollar”
USDCAD is consolidating around 1.3288. If later the price breaks this range to the upside, the market may start a new growth towards 1.3344; if to the downside – continue the correction with the target at 1.3165.
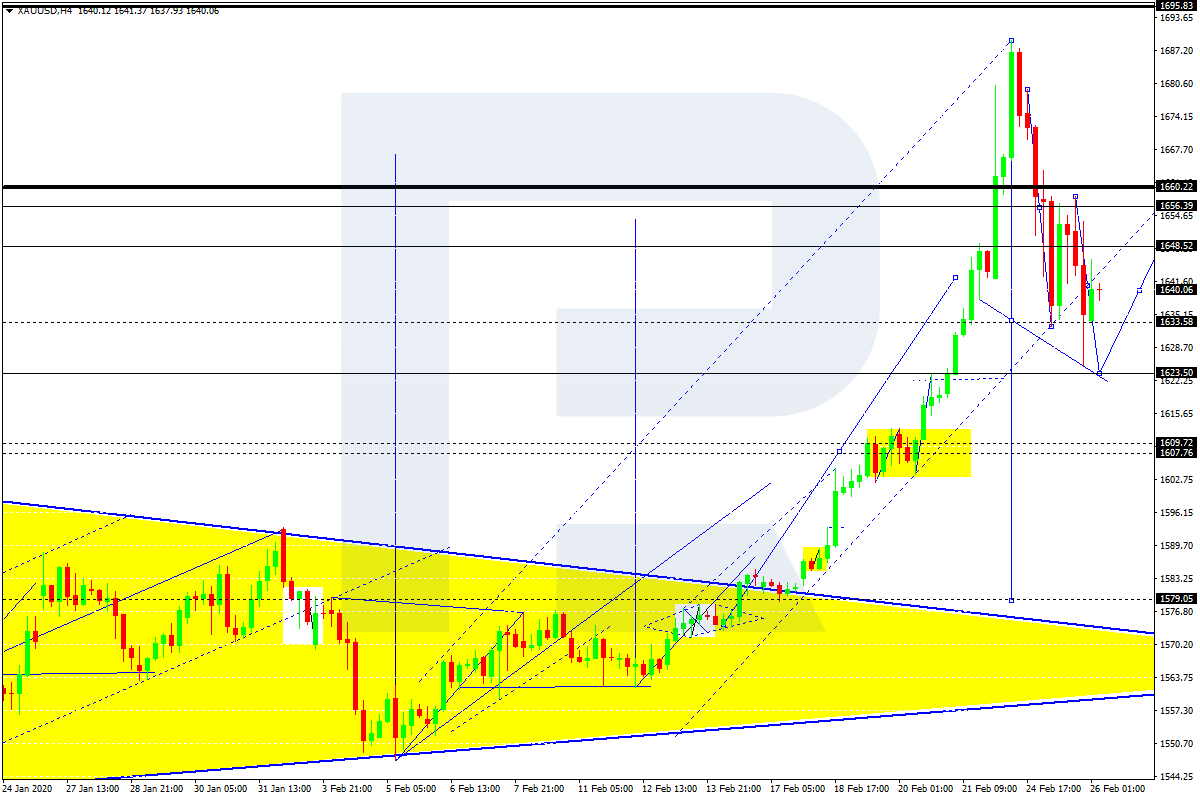
XAUUSD, “Gold vs US Dollar”
Gold has broken 1641.00 to the downside. Possibly, today the pair may reach 1623.50 and then form one more ascending structure towards 1656.40. Later, the market may start a new decline with the target at 1609.70.
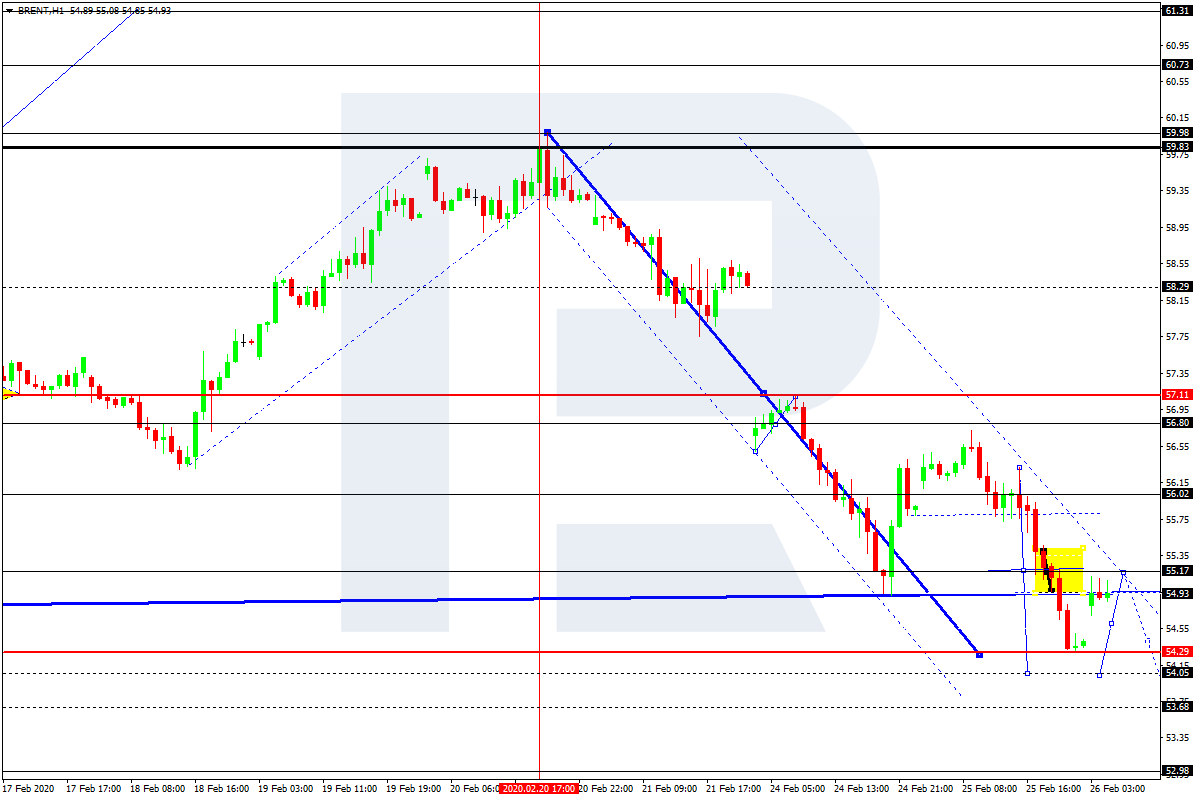
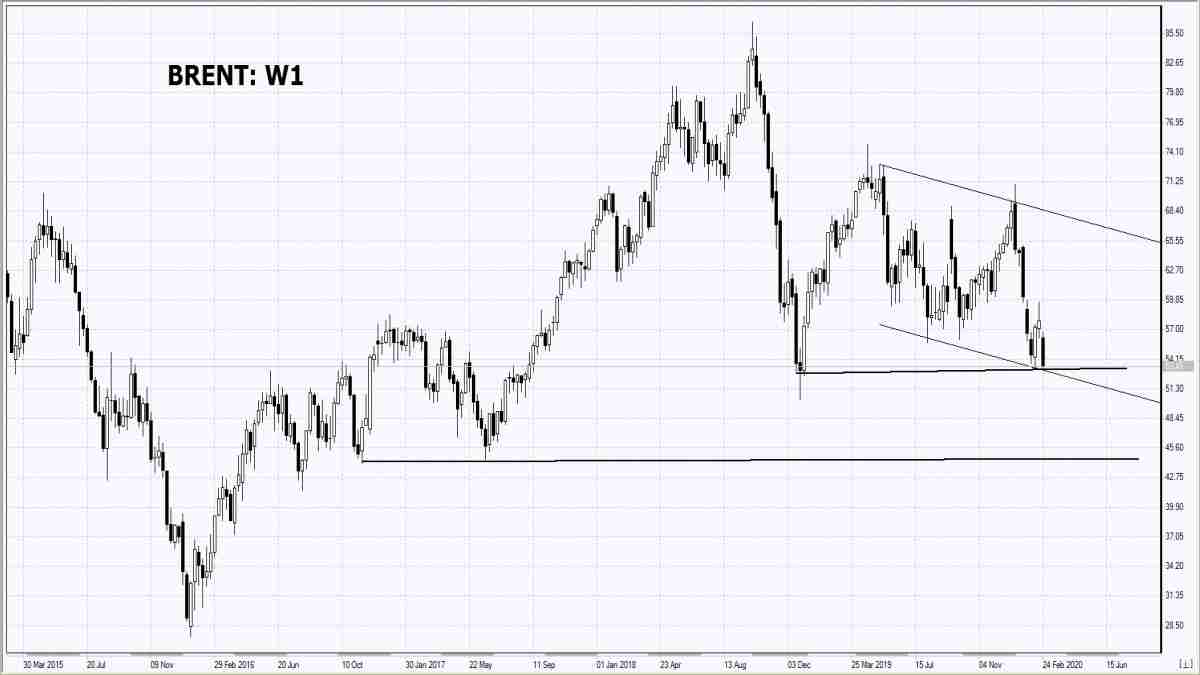
BRENT
Brent is moving downwards. Possibly, today the pair may reach 54.04 and then start another growth towards 55.22. After that, the instrument may form a new descending structure to reach 53.68 and then resume trading upwards with the target at 57.11.
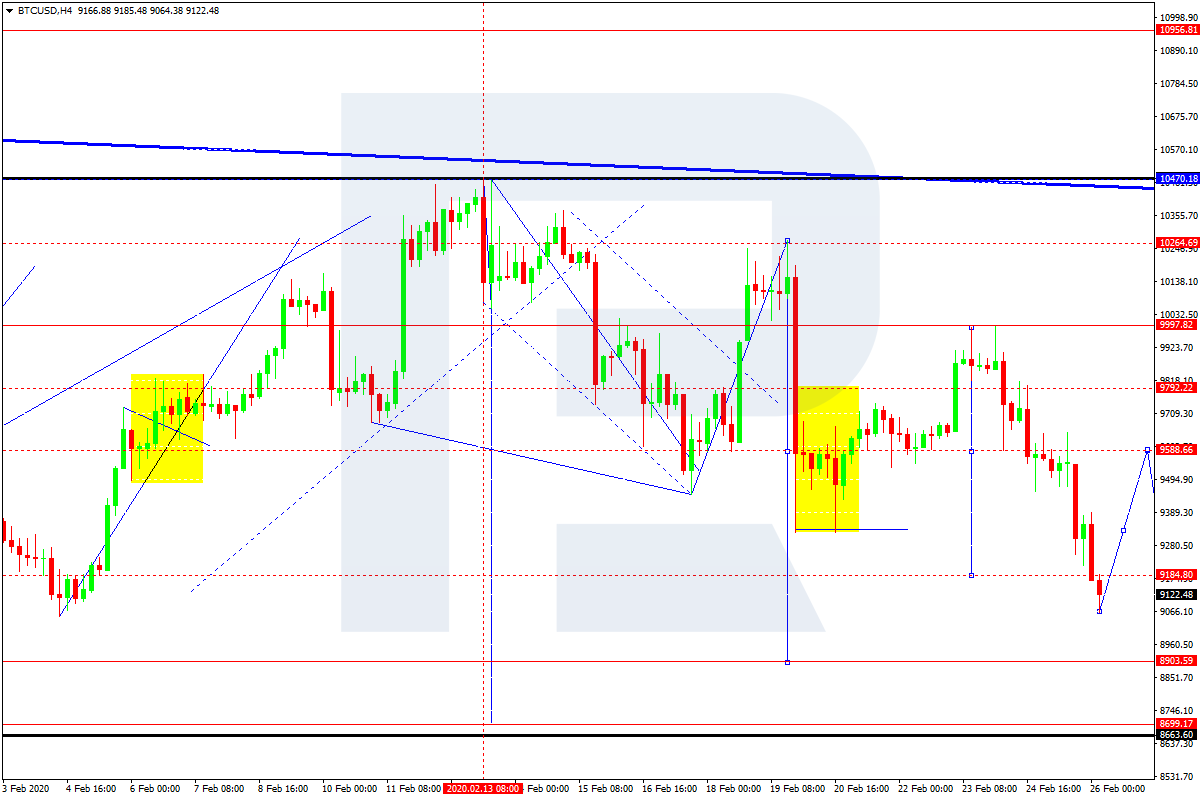
BTCUSD, “Bitcoin vs US Dollar”
BTCUSD is falling towards 8900.00. Later, the market may start another growth to reach 9600.00 and then resume trading downwards with the target at 8600.00.
Attention! Forecasts presented in this section only reflect the author’s private opinion and should not be considered as guidance for trading. RoboForex LP bears no responsibility for trading results based on trading recommendations described in these analytical reviews.
Today, futures for US stock indexes are “in the red”
On Tuesday, US stock quotes dropped down for the 3rd day in a row. The reason for this kind of negative tendency is still the epidemic of coronavirus. Investors suppose it can adversely affect the entire global economy. In particular, Apple, Nike, United Airlines and Mastercard have already announced a possible reduction in their income. It is worth noting that the growth rate of the number of cases with coronavirus in China is slowing down currently. The U.S. Centers for Disease Control and Prevention and the World Health Organization announced that the epidemic is likely to continue spreading in the United States and around the world. That statement was the main cause of yesterday’s descent in markets. In addition, the Associated Press declared the possible cancellation of the 2020 Summer Olympics in Tokyo. Until then, the opening of the games is scheduled for July 24. Over the past 2 days, the US S&P 500 (-3,03%) , Dow Jones Industrial Average (-3,15%) and Nasdaq (-2,7%) indices fell on Tuesday. Trading volume in US exchanges continued to increase and reached up to 12.24 billion shares, which is 53% more than the 20-day average. Today, the US is releasing data on new home sales in January. The US dollar Index ICE ICE is rising slightly today after a 3-day decline. Fed vice chairman Richard Clarida said his agency is monitoring the economy, but it’s too early to talk about a rate cut (1.75%).
European stock indices have been falling for 5 days consecutively
European exchanges keep losing in price amid the growing number of infection cases in Spain. We are witnessing a full-fledged epidemic in Italy and that makes investors fear this country will fall into recession again. European companies began to lower their sales and profit forecasts for 2020, following the American ones. Yesterday, the “Danone” food group did so. Today, a possible reduction in profits was announced by the British alcohol company “Diageo” (producer of Johnnie Walker Scotch whiskey, Smirnoff vodka and Guinness beer). Its shares decreased by 3%, and securities of the alcohol companies Rivals Remy Cointreau SA and Pernod Ricard by 4.2% and 2.2% respectively. Investors expect a drop in European companies’ total profit by 1.2% in the 4th quarter of last year. Today, the Eurozone is not expected to publish any significant macroeconomic data. ECB President Christine Lagarde will make a speech that can affect the foreign exchange market. The EUR/USD rate does not change today in anticipation of this event.
Nikkei continues to decline today
All the Asian indices fell today. Nikkei (-2.1%) collapsed to a 4-month low. The shares of the advertising holding Dentsu Group Inc crashed to a 7-year low after reports of a possible cancellation of the Olympic games in Tokyo. Hang Seng. Hang Seng went down at 0.73% today. During the bidding, it fell by 1.5%, but then gained back а part of the losses after reporting about measures to stimulate the economy by the Hong Kong authorities. To manage that, they planned a peak budget deficit. The Australian stock S&P/ASX 200 fell 2,3%.
Brent futures quotes updated their minimum since December 2018. Goldman Sachs, a major investment bank, lowered its forecast for the global oil consumption growth during this year from 1.6 million barrels a day to 600 thousand due to the coronavirus epidemy. He also reduced the forecast for the average Brent price from $ 63 per barrel to $ 60. The International Energy Agency (IEA) also lowered its forecast for global oil demand growth. In their opinion, it will be the lowest for the last decade and will amount to 825 thousand barrels per day. The data on the growth of oil reserves in USA for the week was declared for the fifth time in a row and appeared to be another negative factor for the quotations. This was reported by the American Petroleum Institute (API). Official stock data will be out tonight.
Note: This overview has an informative and tutorial character and is published for free. All the data, included in the overview, are received from public sources, recognized as more or less reliable. Moreover, there is no guarantee that the indicated information is full and precise. Overviews are not updated. The whole information in each overview, including opinion, indicators, charts and anything else, is provided only for familiarization purposes and is not financial advice or а recommendation. The whole text and its any part, as well as the charts cannot be considered as an offer to make a deal with any asset. IFC Markets and its employees under any circumstances are not liable for any action taken by someone else during or after reading the overview.
The US dollar has been declining against a basket of major currencies. The dollar index (#DX) closed yesterday in the red zone (-0.39%). New cases of coronavirus have become known. On Wednesday, Asia reported hundreds of new cases of coronavirus infection, including the first infected US military. The US is worried that such a spread of coronavirus will soon lead to a pandemic.
Meanwhile, the United States is pleased with the measures taken by China as part of the first phase of their trade agreement. According to the agreement, China should increase its purchases of US agricultural products by $200 billion over 2 years compared to the level of 2017. At the same time, in the statement by US officials, it does not mention that the Chinese economy is currently experiencing difficulties due to the coronavirus.
The “black gold” prices have continued to decline. At the moment, futures for the WTI crude oil are testing the $49.40 mark per barrel. At 17:30 (GMT+2:00), crude oil inventories will be published.
Market indicators
Yesterday, there were aggressive sales in the US stock market: #SPY (-3.03%), #DIA (-3.17%), #QQQ (-2.72%).
The 10-year US government bonds yield has not changed. At the moment, the indicator is at the level of 1.35-1.36%.
The EUR/USD currency pair is dominated by bullish moods. The trading instrument has renewed its local highs. The USA has published weak data on consumer confidence. Investors are concerned about the spread of the Covid-19 coronavirus outside China, which may lead to a serious decline in the global economy. At the moment, the trading instrument is consolidating in the range of 1.08600-1.08900. We expect economic reports from the USA. Positions should be opened from key levels. We also recommend you to pay attention to the speeches of ECB head and FOMC representatives.
The Economic News Feed for 26.02.2020:
– At 17:00 (GMT+2:00) the US will published a report on new home sales;
The indicators signal the strength of buyers: the price has fixed above 50 MA and 100 MA.
The MACD histogram is in the positive zone, but below the signal line, which gives a weak signal to buy EUR/USD.
The Stochastic Oscillator is in the neutral zone, the %K line is above the %D line, which also indicates a bullish sentiment.
Trading recommendations
Support levels: 1.08600, 1.08300, 1.08150
Resistance levels: 1.08900, 1.09250
If the price fixes above 1.08900, expect quotes to rise toward 1.09200-1.09400.
Alternatively, the quotes will descend toward 1.08300-1.08100.
The GBP/USD currency pair
Technical indicators of the currency pair:
Prev Open: 1.29301
Open: 1.30053
% chg. over the last day: +0.57
Day’s range: 1.29765 – 1.30080
52 wk range: 1.1959 – 1.3516
GBP/USD quotes have moved up. In the course of yesterday’s trading, GBP added more than 70 points in price against the U.S. dollar. The GBP/USD currency pair has set new local highs. At the moment the following key support and resistance levels can be identified at 1.29700 and 1.30150, respectively. The trading instrument has potential for further recovery. We recommend opening positions from key levels.
The Economic News Feed for 26.02.2020 is calm.
The indicators signal the strength of buyers: the price has fixed above 50 MA and 100 MA.
The MACD histogram is in the positive zone, but below the signal line, which gives a weak signal to buy GBP/USD.
The Stochastic Oscillator is located in the neutral zone, the %K line crossed the %D line. There are no signals at the moment.
Trading recommendations
Support levels: 1.29700, 1.29400, 1.29000
Resistance levels: 1.30150, 1.30600
If the price fixes above the resistance level of 1.30150, further growth of GBP/USD quotes is expected to 1.30500-1.30800.
Alternatively, the quotes could descend toward 1.29400-1.29100.
The USD/CAD currency pair
Technical indicators of the currency pair:
Prev Open: 1.32925
Open: 1.32787
% chg. over the last day: -0.10
Day’s range: 1.32740 – 1.32941
52 wk range: 1.2949 – 1.3566
USD/CAD currency pair is traded in flat. There is no defined trend. The CAD is testing local support and resistance levels: 1.32700 and 1.33050, respectively. The Canadian dollar continues to be under pressure from aggressive sales in the oil market. USD/CAD quotes have the upside potential. We recommend you to pay attention to the economic reports from the USA. Positions should be opened from key levels.
The Economic News Feed for 26.02.2020 is calm.
Indicators do not give accurate signals: the price has crossed 50 MA.
MACD histogram is near the 0 mark.
The Stochastic Oscillator is located in the neutral zone, the %K line is above the %D line, which indicates a bullish sentiment.
Trading recommendations
Support levels: 1.32700, 1.32450, 1.32250
Resistance levels: 1.33050, 1.33400
If the price fixes above 1.33050, further growth of USD/CAD quotes is expected to 1.33400-1.33600.
Alternatively, the quotes could descend toward 1.32500-1.32300.
The USD/JPY currency pair
Technical indicators of the currency pair:
Prev Open: 110.681
Open: 110.196
% chg. over the last day: -0.38
Day’s range: 110.134 – 110.579
52 wk range: 104.45 – 113.53
The USD/JPY currency pair continues to show negative dynamics. The trading instrument has updated the local lows again. The demand for safe haven currencies remains at a high level. Investors assess the risks of further coronavirus spreading from China. At the moment USD/JPY quotes are consolidating in the range of 110.000-110.600. The yen has a potential for further growth against greenback. We recommend you to pay attention to the dynamics of the US government securities yield. Positions should be opened from key levels.
The Economic News Feed for 26.02.2020 is calm.
The indicators signal the sellers’ strength: the price has fixed below 50 MA and 100 MA.
The MACD histogram is in the negative zone, but above the signal line, which gives a weak signal to sell USD/JPY.
The Stochastic Oscillator is in the neutral zone, the %K line is below the %D line, which also indicates a bearish mood.
Trading recommendations
Support levels: 110.000, 109.650
Resistance levels: 110.600, 111.100, 111.600
If the price fixes below the round 110.000 level, USD/JPY quotes are expected to fall further to 109.700-109.400.
Alternatively, the quotes could grow toward 111.00-111.300.
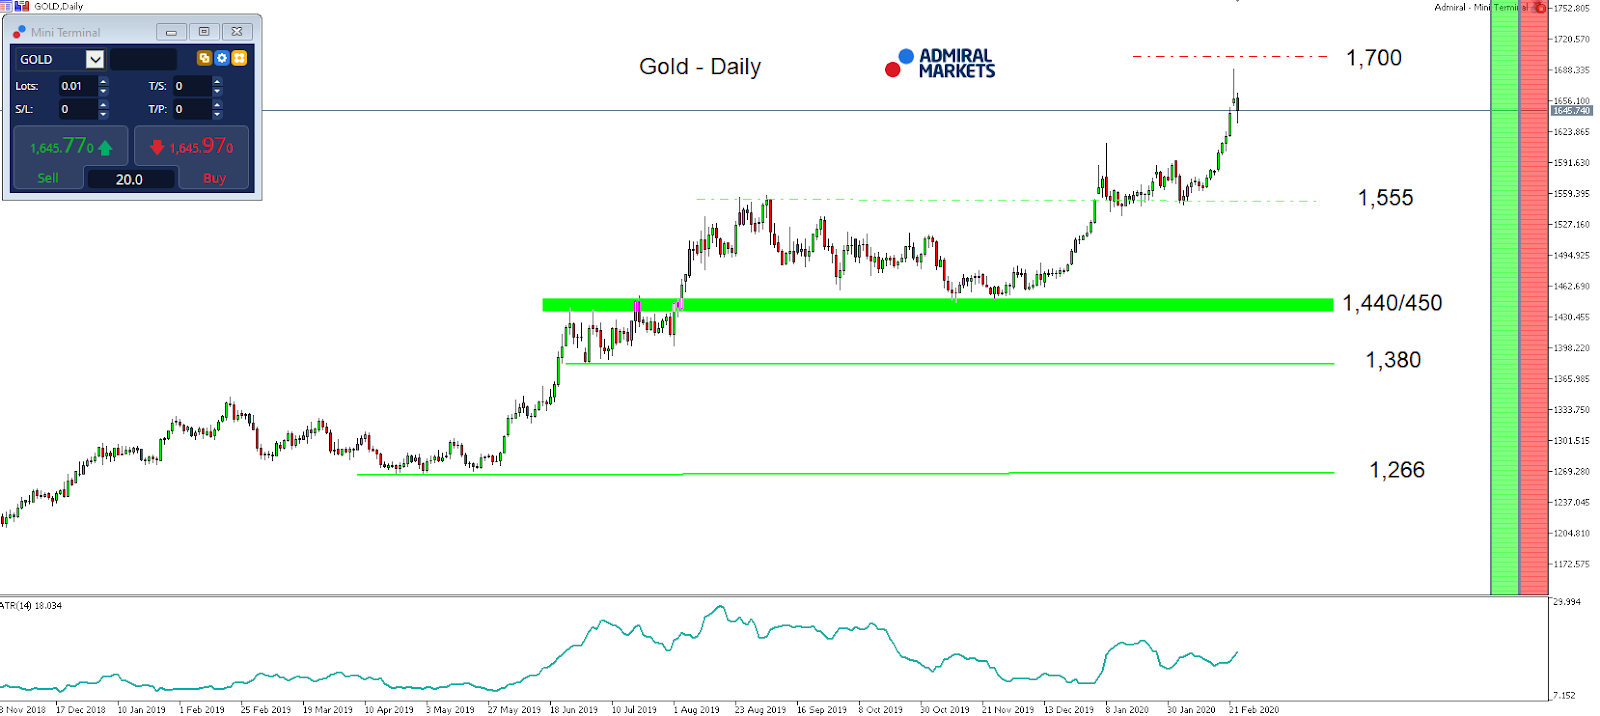
Driven by the latest economic developments in the US, as 30-year U.S. yields drop to record lows after the IHS Markit Flash Composite PMI last Friday came in at its lowest level since 2013, 10-year US yields breaking below 1.50%, and renewed fears around the Coronavirus, Gold went vertical and is trading at its highest levels since 2013.
While the technical mode looks very extended on the upside, and risk-reward ratios become more and more unattractive, we shouldn’t forget that yield sensitive assets like the precious metal have a high level of trend stability.
That said, a direct break above 1,700 USD, especially if US economic data from the Housing markets disappoints, remains an option even though the dynamic of the move should be lower.
The reason for this being, that market participants now expect, with a likelihood of 75%, the Fed to cut rates twice or by 50 basis points in 2020, and already see three 25 basis points cut with a likelihood of around 40% (according to the Fed Watch Tool).
With that in mind, disappointing US data and a foreseeable US economic downturn is already priced in, and could at least result in Gold consolidating, even though at an elevated level.
Technically, if we get to see a correction, a potential long trigger can be found around 1,600/620 USD, with the daily trend support to be found around 1,535/545 USD and Gold staying bullish on a daily time-frame above that level.
Source: Admiral Markets MT5 with MT5-SE Add-on Gold Daily chart (between November 23, 2018, to February 25, 2020). Accessed: February 25, 2020, at 10:00pm GMT – Please note: Past performance is not a reliable indicator of future results, or future performance.
In 2015, the value of Gold fell by 10.4%, in 2016, it increased by 8.1%, in 2017, it increased by 13.1%, in 2018, it fell by 1.6%, in 2019, it increased by 18.9%, meaning that after five years, it was up by 28%.
Discover the world’s #1 multi-asset platform
Admiral Markets offers professional traders the ability to trade with a custom, upgraded version of MetaTrader 5, allowing you to experience trading at a significantly higher, more rewarding level. Experience benefits such as the addition of the Market Heat Map, so you can compare various currency pairs to see which ones might be lucrative investments, access real-time trading data, and so much more. Click the banner below to start your FREE download of MT5 Supreme Edition!
Disclaimer: The given data provides additional information regarding all analysis, estimates, prognosis, forecasts or other similar assessments or information (hereinafter “Analysis”) published on the website of Admiral Markets. Before making any investment decisions please pay close attention to the following:
This is a marketing communication. The analysis is published for informative purposes only and are in no way to be construed as investment advice or recommendation. It has not been prepared in accordance with legal requirements designed to promote the independence of investment research, and that it is not subject to any prohibition on dealing ahead of the dissemination of investment research.
Any investment decision is made by each client alone whereas Admiral Markets shall not be responsible for any loss or damage arising from any such decision, whether or not based on the Analysis.
Each of the Analysis is prepared by an independent analyst (Jens Klatt, Professional Trader and Analyst, hereinafter “Author”) based on the Author’s personal estimations.
To ensure that the interests of the clients would be protected and objectivity of the Analysis would not be damaged Admiral Markets has established relevant internal procedures for prevention and management of conflicts of interest.
Whilst every reasonable effort is taken to ensure that all sources of the Analysis are reliable and that all information is presented, as much as possible, in an understandable, timely, precise and complete manner, Admiral Markets does not guarantee the accuracy or completeness of any information contained within the Analysis. The presented figures refer that refer to any past performance is not a reliable indicator of future results.
The contents of the Analysis should not be construed as an express or implied promise, guarantee or implication by Admiral Markets that the client shall profit from the strategies therein or that losses in connection therewith may or shall be limited.
Any kind of previous or modeled performance of financial instruments indicated within the Publication should not be construed as an express or implied promise, guarantee or implication by Admiral Markets for any future performance. The value of the financial instrument may both increase and decrease and the preservation of the asset value is not guaranteed.
The projections included in the Analysis may be subject to additional fees, taxes or other charges, depending on the subject of the Publication. The price list applicable to the services provided by Admiral Markets is publicly available from the website of Admiral Markets.
Leveraged products (including contracts for difference) are speculative in nature and may result in losses or profit. Before you start trading, you should make sure that you understand all the risks.
On Tuesday, February 25, the euro was up at the close of trading. An active growth phase was observed at the American session. Bulls set a new weekly high by recouping their daily losses. The dollar has been under pressure for the third consecutive session amid speculation that the Fed could lower interest rates and US stock indices fell by another 3% yesterday. Reports of the continued spread of coronavirus in Italy, South Korea, as well as other European countries and the United States have had a negative impact on financial markets.
In Italy, the number of cases increased to 322 people, and the death toll is up to 10. On Sunday, South Korean authorities announced the highest, “red,” threat level amid a skyrocketing number of people infected with the novel virus. As of Wednesday, 1,146 cases of the disease were confirmed and 10 deaths had been recorded.
Today’s events (GMT+3):
16:30 Eurozone: ECB President Christine Lagarde speech.
18:00 USA: New Home Sales Change (MoM) (Jan).
18:30 USA: EIA Crude Oil Stocks Change (Feb 21).
Current situation:
An upwards movement is developing within the channel. Resistances levels are located at the 67th degree. The euro jumped up on expectations that the Fed would lower interest rates, but the regulator is unlikely to do so before July.
According to the forecast, today I am considering a fall down to the 45th degree – 1.0837. There are several reasons for this. The first is that a bearish divergence has formed between the AO indicator and the price. The second is a rebound from the upper line of the channel. The third is the scheduled speech by ECB President Christine Lagarde.
On the way to 1.0837, the level of 1.0855 will act as an intermediate resistance. Besides Lagarde’s speech, there is no important news expected today for the euro.
By OilPrice.com – You know that the oil markets have truly gone to the dogs when they are suddenly riskier than one of the world’s most volatile commodities: bitcoin.
Bitcoin and most cryptocurrencies are synonymous with extreme bouts of volatility. However, it’s crude oil that is now earning that dubious distinction after exhibiting price swings wilder than even the leading cryptocurrency.
On February 10, West Texas Intermediate (WTI) oil’s one-month realized, or historical, price volatility stood at 105.3%. In contrast, bitcoin’s historical volatility clocked in at 42.3%, its lowest reading since September, according to Skew Markets.
Historical volatility is a measure of how much commodity prices have varied in the past calculated as the standard deviation of daily price movements of the front month futures price, typically for a 30-day period. The metric is expressed as a percentage in annualized terms.
Rising Volatility
A commodity’s historical volatility, however, does not tell us anything about the direction of the price movement; rather, it tells us the degree to which a security’s price movement is deviating from the average.
It would, therefore, not be a stretch to say that crude oil’s volatility has lately exceeded that of bitcoin.
During the period under review, WTI’s historical volatility shot up from 38.7% to 119.6% by late January while S&P 500 Index‘s realized volatility increased to 15.6% during the last week of January.
In contrast, BTC’s volatility retreated from 66% to 42%–hardly surprising given that BTC tends to benefit from flight to safety trades.
That said, don’t rush to dump your gold holdings to buy some BTC just yet.
Despite its falling volatility, bitcoin remains considerably more volatile than gold, one of the commodities that has traditionally been regarded as leading safe haven assets.
Gold’s historical volatility doubled during the early part of January to 18% before sliding back to 10% during early February. In other words, gold at its most volatile has still been considerably less so than bitcoin, which proves the most popular crypto still has some way to go before claiming the safe haven mantle from the yellow metal.
Indeed, bitcoin has failed to play that role to a satisfactory degree during the latest market selloff. BTC was down nearly 5% on Monday’s stock market rout on a day the S&P 500 fell 3.5%, the biggest one-day loss by the broad-market index since August 2019. That drop was not an aberration for BTC, either, which has suffered intraday declines of more than 3% seven times so far in the first two months of the year alone.
For perspective, gold bullion was down 1.5% to about $1,650/oz though still 5.1% up over the past 30 days.
Coronavirus Mayhem
And you might have guessed right by now: the coronavirus mayhem is largely to blame for crude oil’s sharp spike in volatility.
The viral outbreak has thrown a monkey wrench into financial markets across the globe, with the crude oil market frequently finding itself whipsawed by the turn of events.
The January rally that saw oil WTI prices shoot up nearly 10% in a matter of days was triggered after Washington launched a retaliatory attack on an Iranian military base in Iraq, killing a top military commander and injecting considerable geopolitical uncertainty into the markets. Unfortunately, the rally was only to be short-lived, cut off by the first news of the coronavirus outbreak in China.
The oil market is officially now in bear territory after posting the worst day in more than a month on Monday on heightened coronavirus fears.
U.S. WTI crude dipped more than 5% at the session low to settle at $50.45 with investors worried that a subsequent slowdown in the global economy could further dent the already weakened demand for crude.
Prices, however, managed to slightly recover from the lows to settle at $51.43 per barrel–still bad enough for its worst day since Jan. 8–after Saudi Aramco CEO Amin Nasser reportedly said that the coronavirus impact will be “short term”. Nasser said that Aramco has not evacuated its staff from China.
Right now, there’s plenty of uncertainty in the oil markets with very little clarity regarding if and when the outbreak will be brought under full control.
While the Aramco chiefs expect the situation to have normalized during the second part of the year, others contend that the situation remains tenuous and the outbreak could rebound when Chinese residents return to work and school.
Monday’s heavy selloff suggests that the bears are the ones holding sway right now, while trading in oil has suddenly become a (fabulous, for some) game of volatility that makes it as exciting as crypto.
The selloff in Asian markets continues, as risk appetite struggles to find a solid footing amid the coronavirus bog. South Korea now has more than 1,100 cases, adding to the worldwide tally that has exceeded 80,000, with more confirmed cases in Europe and the Middle East. Pandemic fears are stoking the risk-off mode in the markets, with the MSCI Asia Pacific index in the red in 9 out of the last 10 sessions, while the South Korean Won is leading Asian currencies’ decline against the US Dollar.
The rout in stock markets suggests that the divergence between valuations and fundamentals need to be reconciled, especially in light of the uncertainties surrounding Covid-19’s eventual toll on the global economy and the efficacy of incoming stimulus measures. Equity investors have deemed that the gains so far this year have run its course for the time being and need stronger conviction to etch out new record highs. The pullback in risk-taking activities however should bode well for safe haven assets, creating a supportive environment for the likes of Gold and US Treasuries in the interim.
Dollar could drop further on Fed easing bets
The Dollar index (DXY) has seen a technical pullback from overbought territory, falling by about one percent since breaching the 99.9 mark last week. If the U.S. Centers for Disease Control and Prevention’s warning of a potential outbreak stateside indeed materialises, that could prompt the Greenback to surrender more of its gains of late.
Should the incoming data on consumer spending, home sales and ISMs come in below market expectations, that could prompt investors to ramp up bets that the Federal Reserve may have to lower US interest rates sooner than expected. Such dovish expectations could also lead to more Dollar softness.
Still, the DXY is expected to remain at relatively elevated levels, with other G10 currencies offering little threat to King Dollar’s throne at present, considering that the US economy is currently in a better place compared to other major, developed economies.
Gold moderates to $1640s, upside bias to remain
Despite shedding over three percent since breaching the $1689 level earlier this week, Gold is expected to remain supported above $1580 as investors continue to cling to safety while assessing the coronavirus’ impact on global economic conditions. Bullion could yet make another run towards the psychological $1700 mark, especially if the negative virus impact shows up in the hard data out of major economies over the coming months.
Demand-side risks still primary driver for Oil
Oil’s sensitivity to coronavirus-linked concerns has made for a tumultuous 2020 so far for Brent futures. Brent futures could see another sharp drop towards $50/bbl, especially if the CDC’s warning of an outbreak stateside materialises. Should OPEC+ decide to trigger more supply cuts at next week’s meeting, that may only have a limited effect on Oil prices, as demand-side concerns are expected to continue having a major sway on the commodities complex.
Disclaimer: The content in this article comprises personal opinions and should not be construed as containing personal and/or other investment advice and/or an offer of and/or solicitation for any transactions in financial instruments and/or a guarantee and/or prediction of future performance. ForexTime (FXTM), its affiliates, agents, directors, officers or employees do not guarantee the accuracy, validity, timeliness or completeness, of any information or data made available and assume no liability as to any loss arising from any investment based on the same.
The effects of Advanced Energy Industries’ recent acquisition and other factors are explained in a Raymond James report.
In a Feb. 18 research note, Pavel Molchanov, a Raymond James analyst, purported that Advanced Energy Industries Inc.’s (AEIS:NASDAQ; AEIS:BSX) acquisition of Artesyn “greatly diversified the revenue mix,” and the power solutions company is “on course for a 2020 free cash flow yield of 5%.”
Molchanov added that “above and beyond the earnings accretion and the strategic benefit of diversification, creating a top line picture that is less choppy from quarter to quarter is particularly valuable.”
Accordingly, Raymond James increased its target price on Advanced Energy to $85 per share from $78. In comparison, the stock is trading now at around $62.79 per share.
The analyst reviewed the energy firm’s financial numbers of Q4/19, the first full quarter that includes the Artesyn acquisition, Advanced Energy’s largest. Earnings per share (EPS) was $0.87, above the high end of the corporation’s $0.560.80 guidance. It also exceeded Raymond James’ $0.78 estimate and consensus’ forecast of $0.69.
Revenue of $338 million, up 119% year over year and 93% quarter over quarter (QOQ), followed the same trend. It, too, surpassed guidance of $295325 million. “While the vast majority of the revenue growth came from Artesyn, the legacy business also showed strength, exemplified by semi cap’s 30% QOQ jump, nicely accelerating from Q3/19’s 6% rebound,” Molchanov commented.
With cost synergies from the Artesyn acquisition starting to come into play, Advanced Energy’s Q4/19 sales, general and administrative expense and research and development expense were less than expected.
Molchanov noted that a “semi cap uplift is boosting Q1/20 guidance as well, despite the coronavirus uncertainty.” The company’s projected range for Q1/20 EPS is $0.401.00. This is broader than usual due to the coronavirus “disproportionately affecting the legacy Artesyn products”; there is an Artesyn facility in China.
Thus, Raymond James increased its Q1/20 EPS estimate to $0.79 from $0.70 and now forecasts the full-year 2020 EPS at 56%. The financial services firm expects EPS “growth of 68% in topline, reflecting the addition of Artesyn for a full 12 months as well as continuation of recovery in semi cap and resumption of growth in industrial,” Molchanov explained.
As for free cash flow, Raymond James projects the $49 million in 2019 to triple to $156 million this year and increase even further in 2021 to $178 million. As such, cash flow yields would be 5% in 2020 and 6% in 2021.
Raymond James has an Outperform rating on Advanced Energy Industries.
Disclosure: 1) Doresa Banning compiled this article for Streetwise Reports LLC and provides services to Streetwise Reports as an independent contractor. She or members of her household own securities of the following companies mentioned in the article: None. She or members of her household are paid by the following companies mentioned in this article: None. 2) The following companies mentioned in this article are billboard sponsors of Streetwise Reports: None. Click here for important disclosures about sponsor fees. 3) Comments and opinions expressed are those of the specific experts and not of Streetwise Reports or its officers. The information provided above is for informational purposes only and is not a recommendation to buy or sell any security. 4) The article does not constitute investment advice. Each reader is encouraged to consult with his or her individual financial professional and any action a reader takes as a result of information presented here is his or her own responsibility. By opening this page, each reader accepts and agrees to Streetwise Reports’ terms of use and full legal disclaimer. This article is not a solicitation for investment. Streetwise Reports does not render general or specific investment advice and the information on Streetwise Reports should not be considered a recommendation to buy or sell any security. Streetwise Reports does not endorse or recommend the business, products, services or securities of any company mentioned on Streetwise Reports. 5) From time to time, Streetwise Reports LLC and its directors, officers, employees or members of their families, as well as persons interviewed for articles and interviews on the site, may have a long or short position in securities mentioned. Directors, officers, employees or members of their immediate families are prohibited from making purchases and/or sales of those securities in the open market or otherwise from the time of the interview or the decision to write an article until three business days after the publication of the interview or article. The foregoing prohibition does not apply to articles that in substance only restate previously published company releases.
Disclosures from Raymond James, Advanced Energy Industries Inc., February 18, 2020
ANALYST INFORMATION
Analysts Holdings and Compensation: Equity analysts and their staffs at Raymond James are compensated based on a salary and bonus system. Several factors enter into the bonus determination, including quality and performance of research product, the analyst’s success in rating stocks versus an industry index, and support effectiveness to trading and the retail and institutional sales forces. Other factors may include but are not limited to: overall ratings from internal (other than investment banking) or external parties and the general productivity and revenue generated in covered stocks.
The analyst Pavel Molchanov, primarily responsible for the preparation of this research report, attests to the following: (1) that the views and opinions rendered in this research report reflect his or her personal views about the subject companies or issuers and (2) that no part of the research analyst’s compensation was, is, or will be directly or indirectly related to the specific recommendations or views in this research report. In addition, said analyst(s) has not received compensation from any subject company in the last 12 months.
RAYMOND JAMES RELATIONSHIP DISCLOSURES Certain affiliates of the RJ Group expect to receive or intend to seek compensation for investment banking services from all companies under research coverage within the next three months.
Raymond James & Associates, Inc. makes a market in the shares of Advanced Energy Industries, Inc.
Additional Risk and Disclosure information, as well as more information on the Raymond James rating system and suitability categories, is available here.