The EUR/USD currency pair is still dominated by a bullish sentiment. The quotes have updated the local highs again. The demand for USD has decreased significantly. Financial markets participants expect the Fed to reduce the range of key interest rates to 1.00-1.25% at the next meeting on March 18. At the moment the trading instrument is consolidating in the range of 1.10100-1.10700. The EUR can recover further. We are waiting for important statistical data today. Positions should be opened from key levels.
The Economic News Feed for 02.03.2020:
– business activity index in German manufacturing sector – 10:55 (GMT+2:00);
– ISM’s business activity index in the US manufacturing sector – 17:00 (GMT+2:00).
The indicators signal the strength of buyers: the price has fixed above 50 MA and 100 MA.
MACD histogram is in the positive zone, which gives a signal to buy EUR/USD.
The Stochastic Oscillator is in the neutral zone, the %K line is below the %D line, which indicates the development of a correction movement.
Trading recommendations
Support levels: 1.10100, 1.09600, 1.09100
Resistance levels: 1.10700, 1.11000
If the price fixes above 1.10700, expect further growth to 1.11000-1.11200.
Alternatively, the quotes could descend toward 1.09700-1.09500.
The GBP/USD currency pair
Technical indicators of the currency pair:
Prev Open: 1.28811
Open: 1.27878
% chg. over the last day: -0.13
Day’s range: 1.27830 – 1.28507
52 wk range: 1.1959 – 1.3516
Sales dominate on the GBP/USD currency pair. Sterling has set new key lows. At the moment, GBP/USD is consolidating near the mirror resistance at 1.28550. The round level 1.28000 is the nearest support. The trading instrument can decline further. Investors are waiting for important economic releases from the UK and USA. Positions should be opened from key levels.
At 11:30 (GMT+2:00) UK will publish an index of business activity in the manufacturing sector.
The indicators signal the sellers’ strength: the price has fixed below 50 MA and 100 MA.
The MACD histogram is in the negative zone, but above the signal line, which gives a weak signal to sell GBP/USD.
The Stochastic Oscillator is in the neutral zone, the %K line is below the %D line, which indicates a bearish sentiment.
Trading recommendations
Support levels: 1.28000, 1.27300
Resistance levels: 1.28550, 1.29000, 1.29400
If the price fixes below the round level of 1.28000, expect a descend toward 1.27500-1.27000.
Alternatively, the quotes could recover toward 1.29000-1.29400.
The USD/CAD currency pair
Technical indicators of the currency pair:
Prev Open: 1.33906
Open: 1.34332
% chg. over the last day: +0.11
Day’s range: 1.33334 – 1.34382
52 wk range: 1.2949 – 1.3566
USD/CAD quotes have moved down. The CAD has updated local lows. The Canadian dollar is supported by the oil price recovery after a prolonged decline. At the moment the trading instrument is consolidating. The key support and resistance levels are: 1.33350 and 1.33900, respectively. The USD/CAD currency pair has a potential for further correction. We recommend you to pay attention to the US economic reports. Positions should be opened from key levels.
The news background on the Canadian economy is calm.
Indicators do not give accurate signals: the price tests 100 MA.
The MACD histogram is in the negative zone, which indicates a bearish sentiment.
The Stochastic Oscillator is located in the oversold area, the %K line crosses the %D line. There are no signals at the moment.
Trading recommendations
Support levels: 1.33350, 1.33000, 1.32650
Resistance levels: 1.33900, 1.34350, 1.34600
If the price fixes below 1.33350, expect further correction toward 1.33000-1.32600.
Alternatively, the quotes could grow toward 1.34300-1.34600.
The USD/JPY currency pair
Technical indicators of the currency pair:
Prev Open: 109.590
Open: 107.449
% chg. over the last day: -1.38
Day’s range: 107.361 – 108.371
52 wk range: 104.45 – 113.53
The USD/JPY has stabilized after a significant drop last week. At the moment the quotes are consolidating. Local support and resistance levels are at 107.850 and 108.500, respectively. Technical correction of the trading instrument is not ruled out in the nearest future. We recommend you to pay attention to the dynamics of US government securities yield. Positions should be opened from key levels.
The news background on Japanese economy is calm.
The indicators signal the sellers’ strength: the price has fixed below 50 MA and 100 MA.
The MACD histogram is in the negative zone but above the signal line, which gives a weak signal to sell USD/JPY.
The Stochastic Oscillator is located in the overbought zone, the %K line has crossed the %D line. There are no signals at the moment.
Trading recommendations
Support levels: 107.850, 107.350, 107.000
Resistance levels: 108.500, 109.300, 109.650
If the price fixes above 108.500, expect the quotes to correct toward 109.000-109.500.
Alternatively, the quotes could decline toward 107.000.
On March 2nd, the first trading session of the spring, Brent is correcting upwards after plummeting the week before. On Monday morning, the instrument is trading at 51.25 USD with the last week’s lows being at 48.50 USD.
Another thing that supports oil prices is Saudi Arabia’s intention to cut its oil extraction by 1 million barrels per day in addition to already existing restrictions from OPEC+ agreement. The reason lies in the risks of the coronavirus outbreak and a possible decrease in global demand for energy commodities.
This week, OPEC+ is scheduled to have a meeting, where the carte has to decide on daily extraction limits. It may help the commodity market reach stability.
Nevertheless, the Chinese coronavirus remains the topical issue among market players, because its influence on the global economy and its stability is still pretty unclear.
As we can see in the H4 chart, after breaking 54.26, Brent has reached the short-term target at 49.50 and may continue the fifth descending wave towards 48.20; right now, it is moving upwards. Possibly, the pair may correct towards 53.90 and then start a new decline to reach 48.50. After that, the instrument may form a reversal pattern for another growth with the first upside target at 59.80. From the technical point of view, this scenario is confirmed by MACD Oscillator: its signal line is moving directly upwards after leaving the histogram area. The indicator is expected to grow towards 0. After the line breaks 0 to the upside, the price may boost its ascending movement.
In the H1 chart, Brent has completed the first ascending impulse with the target at 51.80. The main scenario implies that the pair may correct this impulse to reach 50.50 and then form another rising structure towards 53.90. Later, the price may resume falling to return to 50.05. From the technical point of view, this scenario is confirmed by Stochastic Oscillator: after breaking 80, its signal line is moving towards 50. If the indicator breaks the latter level, the price may fall to reach 48.50 without forming any ascending structures.
Disclaimer
Any predictions contained herein are based on the authors’ particular opinion. This analysis shall not be treated as trading advice. RoboForex shall not be held liable for the results of the trades arising from relying upon trading recommendations and reviews contained herein.
The tide dramatically turned in Equities over the last week of trading, as a massive risk-off hit global financial markets. This came from new Coronavirus information and clear signs of a widespread health threat.
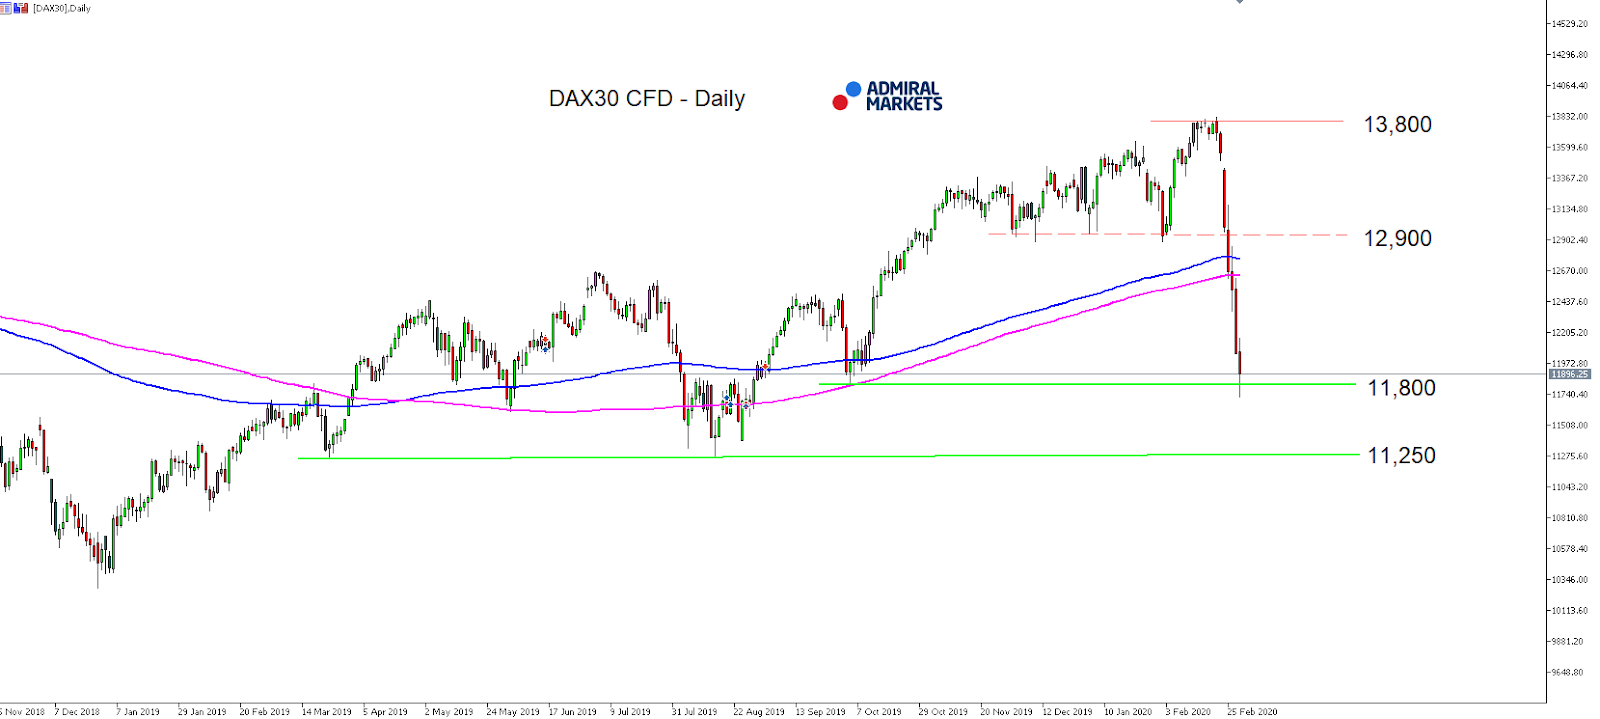
In this context, 10-year US yields hit new all-time lows and the DAX30 CFD broke below 12,000 points, technically negating the long sequence on a daily time-frame by sustainably breaking below 12,900 points, and substantially dropping below its SMA(200).
In general, we should expect volatility to stay elevated, with the overall advantage being on the short-side in the coming days, since the worst is probably yet to come after the US CDC announced that it wants to prepare the American public for the possibility that their lives will be disrupted in the as the Coronavirus spreads.
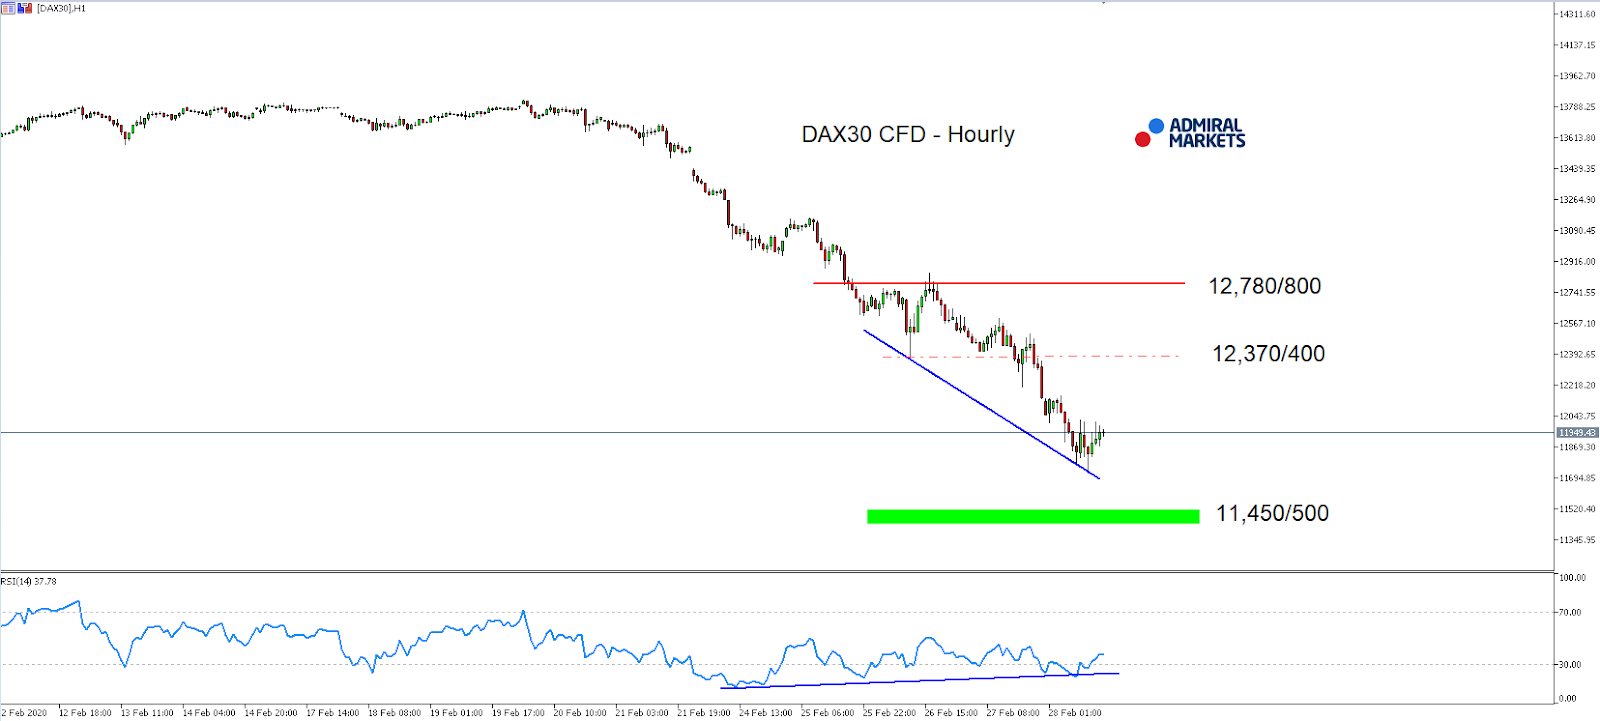
Technically, the mode is very extended on the downside, and a sharp bounce is an option, making risk-reward ratios for short engagements less attractive. That said, the bullish divergence in the RSI(14) on an hourly time-frame points to diminishing bearish momentum, which could play out if any news or rumours on bigger fiscal stimulus packages make the rounds to limit a potentially larger global economic downturn.
Still, the DAX30 CFD stays technically bearish below 12,780/800 points, finding a potential Short-trigger around 12,370/400 points:
Source: Admiral Markets MT5 with MT5-SE Add-onDAX30 CFD Hourly chart (between February 12, 2020, to February 28, 2020). Accessed: February 28, 2020, at 10:00pm GMT
Source: Admiral Markets MT5 with MT5-SE Add-on DAX30 CFD Daily chart (between November 15, 2018, to February 28, 2020). Accessed: February 28, 2020, at 10:00pm GMT – Please note: Past performance is not a reliable indicator of future results, or future performance.
In 2015, the value of the DAX30 CFD increased by 9.56%, in 2016, it increased by 6.87%, in 2017, it increased by 12.51%, in 2018, it fell by 18.26%, in 2019, it increased by 26.44% meaning that after five years, it was up by 34.2%.
Discover the world’s #1 multi-asset platform
Admiral Markets offers professional traders the ability to trade with a custom, upgraded version of MetaTrader 5, allowing you to experience trading at a significantly higher, more rewarding level. Experience benefits such as the addition of the Market Heat Map, so you can compare various currency pairs to see which ones might be lucrative investments, access real-time trading data, and so much more. Click the banner below to start your FREE download of MT5 Supreme Edition!
Disclaimer: The given data provides additional information regarding all analysis, estimates, prognosis, forecasts or other similar assessments or information (hereinafter “Analysis”) published on the website of Admiral Markets. Before making any investment decisions please pay close attention to the following:
This is a marketing communication. The analysis is published for informative purposes only and are in no way to be construed as investment advice or recommendation. It has not been prepared in accordance with legal requirements designed to promote the independence of investment research, and that it is not subject to any prohibition on dealing ahead of the dissemination of investment research.
Any investment decision is made by each client alone whereas Admiral Markets shall not be responsible for any loss or damage arising from any such decision, whether or not based on the Analysis.
Each of the Analysis is prepared by an independent analyst (Jens Klatt, Professional Trader and Analyst, hereinafter “Author”) based on the Author’s personal estimations.
To ensure that the interests of the clients would be protected and objectivity of the Analysis would not be damaged Admiral Markets has established relevant internal procedures for prevention and management of conflicts of interest.
Whilst every reasonable effort is taken to ensure that all sources of the Analysis are reliable and that all information is presented, as much as possible, in an understandable, timely, precise and complete manner, Admiral Markets does not guarantee the accuracy or completeness of any information contained within the Analysis. The presented figures refer that refer to any past performance is not a reliable indicator of future results.
The contents of the Analysis should not be construed as an express or implied promise, guarantee or implication by Admiral Markets that the client shall profit from the strategies therein or that losses in connection therewith may or shall be limited.
Any kind of previous or modeled performance of financial instruments indicated within the Publication should not be construed as an express or implied promise, guarantee or implication by Admiral Markets for any future performance. The value of the financial instrument may both increase and decrease and the preservation of the asset value is not guaranteed.
The projections included in the Analysis may be subject to additional fees, taxes or other charges, depending on the subject of the Publication. The price list applicable to the services provided by Admiral Markets is publicly available from the website of Admiral Markets.
Leveraged products (including contracts for difference) are speculative in nature and may result in losses or profit. Before you start trading, you should make sure that you understand all the risks.
By Hussein Sayed, Chief Market Strategist (Gulf & MENA), ForexTime
A new wave of policy stimulus is on the way. Central banks across the globe are re-opening their toolboxes with the BoJ announcing action to provide liquidity, the Fed projected to cut interest rates and most developed and emerging market monetary policymakers ready to act. Governments are also taking action with Italy announcing fiscal measures to mitigate the covid19 outbreak’s impact.
So far, it seems the reassurance of combined monetary and fiscal measures are calming the financial markets. After initially dropping in early Asia trade, most equity markets are recovering from last week’s steep sell-off. China’s Shenzhen is up more than 3% at the time of writing, Japan’s Nikkei is 1% higher, UK’s FTSE 100 future added 2.3% and all three major US indices are indicating a higher open.
The positive mood is also reflected in oil prices with Brent rebounding 3% after hitting the lowest level since July 2017 earlier in the day. These moves in risk assets came despite China’s manufacturing purchasing managers index falling to record lows in February.
Can central banks fight off coronavirus?
Ever since the global financial crisis, central banks have played a decisive role in restoring investors’ confidence and markets are wondering whether monetary policy will be successful once again.
In my opinion, the simple answer is no. The crisis we are currently facing is neither a financial nor a trade one. It’s a health crisis. Let’s assume the Fed cut interest rates to zero, the ECB moved deeper into negative territory and the BoJ resumed its asset purchase program. In addition, central banks became more creative with their Quantitative Easing programs. Will these measures encourage you to buy a new flat, a new car or even a new iPhone? Are you more confident in taking a vacation trip? Are you likely to consider expanding your business given the cheap liquidity? Most likely, the answer is no.
The current crisis facing the global economy is not due to a lack of cheap liquidity, but the absence of treatment to a virus that is spreading throughout the world, and no amount of monetary stimulus will return life to normal.
It’s almost impossible to know how much further risk assets may drop, but until we get evidence of the virus being contained, any upside may prove to be a dead cat bounce and the markets are likely to continue heading down.
Investors with cash may want to wait a little longer before they jump in, although markets may look attractive.
Disclaimer: The content in this article comprises personal opinions and should not be construed as containing personal and/or other investment advice and/or an offer of and/or solicitation for any transactions in financial instruments and/or a guarantee and/or prediction of future performance. ForexTime (FXTM), its affiliates, agents, directors, officers or employees do not guarantee the accuracy, validity, timeliness or completeness, of any information or data made available and assume no liability as to any loss arising from any investment based on the same.
According to the results of the last week of winter, major currencies showed mixed dynamics. Falls against the US dollar were seen with the Australian dollar (-1.82%), the New Zealand dollar (-1.61%), the Canadian dollar (-1.26%) and the British pound (-1.09%). Increases was recorded by the Japanese yen (+3.20%), the euro (+1.64%) and the Swiss franc (+1.34%).
Source: finviz
On Friday, the EURUSD pair was up at the close of trading. At the European session, the price fell to the level of 1.0951 from which it rebounded to 1.1046. The euro recovered even amidst a falling dollar index. The fall provoked the release of a statement by the representative of the US Federal Reserve Bullard. He said that if the situation with coronavirus worsens into a global pandemic, then lowering the basic interest rate levels is one option.
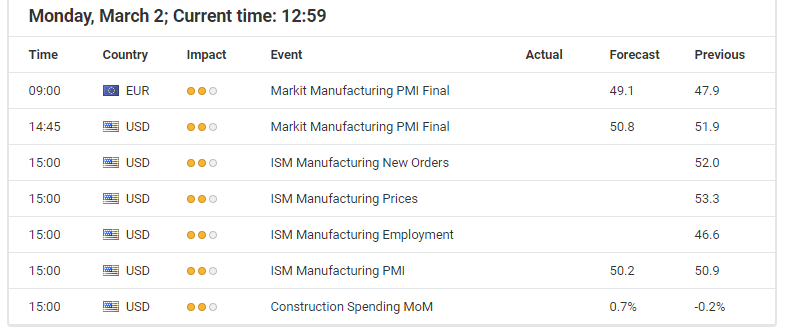
Today’s news (GMT+3):
11:30-12:30: Markit Manufacturing PMI (Feb) in Switzerland, France, Germany, the Eurozone, and the UK.
12:30 UK: Net Lending to Individuals (MoM) (Jan), M4 Money Supply (MoM) (Jan), Mortgage Approvals (Jan).
17:45 USA: Markit Manufacturing PMI (Feb).
18:00 USA: ISM Manufacturing PMI (Feb), Construction Spending (MoM) (Jan).
Current situation:
The expectations for Friday’s fall came true – the price fell to the balance line (Lb). The rebound before the weekend was not even considered. At Asian trading, the price hit U3 for the third time. A serious sign ahead of a savage correction. In addition, Asian stock indices came out in the black. Take into account one working idea today: a rollback to the 45th degree, followed by an increase up to 1.1074 and a fall to 1.0996. A double top is expected. You need to pay attention at the EURGBP cross. If it crashes, it is unlikely that the main EURUSD pair will form a reversal pattern.
A channel has been formed at three extremes. At the current hour of 09:00 (Moscow time), the lower line of the channel passes through 1.0975. The balance line (Lb) is located at 1.0989. If bears get the rate down below the channel, then we should expect the pair to fall to 1.0914. Intermediate support will be found at the 1.0953-mark.
Equities are set to continue hogging the limelight over the week ahead, as investors will be wondering if the correction in stocks may eventually give way to a bear market. Given that a fair amount of the coronavirus-related pessimism has been discounted over recent sessions, the selloff from here on out however may not imitate the same ferocious pace that we saw last week. At the time of writing, most Asian stocks are in the green while Dow Jones futures are positive.
Human toll from coronavirus outbreak to cloud economic outlook
The PMI readings from around the world are not expected to provide enough resistance to stem the tide of risk aversion in the markets. The human toll from Covid-19 is set to compound the murky global economic outlook, considering that new countries have reported their first coronavirus deaths over the weekend.
With Gold now making its way back towards the psychologically-important $1600 level, the risk-off theme is expected to remain dominant over investor sentiment, until the coronavirus outbreak can show material signs of stabilising.
Resilient US data could help restore US Dollar
The Dollar index has weakened below the 98 psychological level, as investors drastically shifted their expectations for the number of Fed rate cuts in 2020. The Fed funds futures now price in three 25-basis point cuts to US interest rates by the end of the year. Still, given the menu of February US data due out this week, from the ISM manufacturing figures later today to Friday’s non-farm payrolls data, a resilient showing in any of these economic indicators could prompt the Dollar index to recover some of its recent losses.
Disclaimer: The content in this article comprises personal opinions and should not be construed as containing personal and/or other investment advice and/or an offer of and/or solicitation for any transactions in financial instruments and/or a guarantee and/or prediction of future performance. ForexTime (FXTM), its affiliates, agents, directors, officers or employees do not guarantee the accuracy, validity, timeliness or completeness, of any information or data made available and assume no liability as to any loss arising from any investment based on the same.
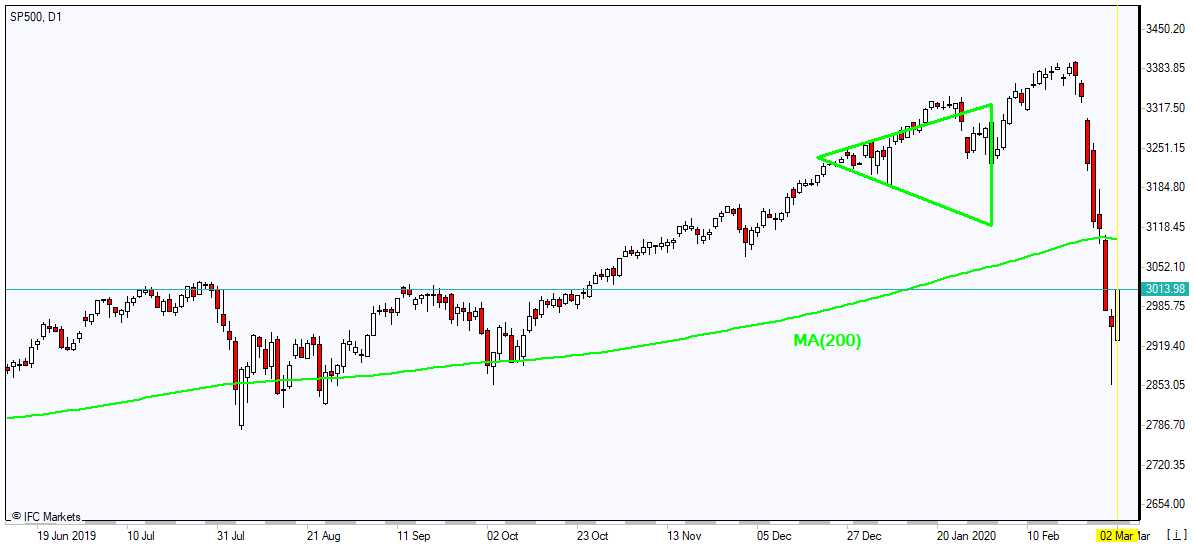
US stock market ended mixed on Friday amid reports of rise in new coronavirus infections. All three main US stock indexes ended in correction territory last week, defined as a decline of at least 10%, but not more than 20%, from a recent peak. The S&P 500 lost 0.8% to 2954.22, falling 11.6% for the week. Dow Jones industrial slumped 1.4% to 25409.36. The Nasdaq however ended marginally higher gaining 0.01% to 8567.37. The dollar weakening slowed as Federal Reserve Chairman Jerome Powell commented the central bank was “closely monitoring” the coronavirus epidemic. The live dollar index data show the ICE US Dollar index, a measure of the dollar’s strength against a basket of six rival currencies, fell 0.3% to 98.06 and is lower currently. Futures on stock indexes point to higher openings today.
DAX 30 led European indexes retreat
European stocks ended sharply lower on Friday in correction territory entered the previous day. EUR/USD slowed its climbing on Friday while GBP/USD accelerated its decline with both pairs higher currently. The Stoxx Europe 600 Index lost 3.8%. The DAX 30 dropped 3.9% to 11890.35 Friday. France’s CAC 40 fell 3.4% and UK’s FTSE 100 slumped 3.2% to 6580.61.
Shanghai Composite leads Asian indexes rebound
Asian stock indices are mixed today. Nikkei rose 1.0% to 20834.29 as yen resumed its slide against the dollar after the Bank of Japan issued a statement assuring that “appropriate” actions will be taken to prop Japan’s economy. China’s markets are rising despite a bigger than expected plunge in Caixin Manufacturing PMI: the Shanghai Composite Index is up 3.2% while Hong Kong’s Hang Seng Index is 0.5% higher. Australia’s All Ordinaries Index lost 0.8% with Australian dollar’s climb against the greenback resuming.
Brent futures prices recovery resumed today. Prices fell on Friday: Brent for April settlement dropped 3.2% to $50.52 a barrel Friday, plunging 14% for the week.
Gold rebounds as Dollar weakens
Gold prices are recovering today after sharp decline Friday. Spot gold dropped 4.0% to $1578.34 on Friday.
Note: This overview has an informative and tutorial character and is published for free. All the data, included in the overview, are received from public sources, recognized as more or less reliable. Moreover, there is no guarantee that the indicated information is full and precise. Overviews are not updated. The whole information in each overview, including opinion, indicators, charts and anything else, is provided only for familiarization purposes and is not financial advice or а recommendation. The whole text and its any part, as well as the charts cannot be considered as an offer to make a deal with any asset. IFC Markets and its employees under any circumstances are not liable for any action taken by someone else during or after reading the overview.
Last year’s performance by Glencore International is summarized in a BMO Capital Markets report.
In a Feb. 18 research note, BMO Capital Markets analyst Edward Sterck reported that Glencore International Plc’s (GLEN:LSE) H2/19 results were “better than expected” and its dividend was “significantly higher than our forecast.”
Sterck reviewed the operational and financial results from full-year 2019.
The highlight was the 15% EBITDA beat. EBITDA came in at US$11.6 billion versus BMO’s US$10.8 billion estimate and exceeded consensus’ expectation as well, though to a lesser degree. The EBITDA beat “was led by a much stronger-than-expected performance from the copper division on lower unit costs,” noted Sterck.
The best performing divisions in 2019 were copper and coal, Sterck pointed out. Copper and coal EBITDA were US$3 billion and US$3.6 billion, 17% and 16% higher than BMO’s forecasts, respectively. Marketing EBITDA was US$2.6 billion, and zinc EBITDA was US$1.8 billion, both in line.
The year’s underperformers were nickel and ferroalloys, indicated Sterck, which missed BMO’s projections by 6% and 39%, respectively.
At year-end, Glencore’s net debt was US$17.6 billion, around the amount BMO expected.
Sterck pointed out that another of Glencore’s 2019 achievements was increasing its 2020 dividend based on its solid financial performance. This year’s dividend is US$0.20 per share, more than double BMO’s estimate of US$0.08 per share “but in line with the 2019 payout.”
Also in 2020, production guidance remains unchanged, however, the company expects lower unit costs in copper and coal. As for debt, Glencore estimated it to be US$1415 billion at year-end.
BMO has a Market Perform rating and a £2.50 per share on Glencore. The company’s stock is currently trading at around £1.97 per share.
Disclosure: 1) Doresa Banning compiled this article for Streetwise Reports LLC and provides services to Streetwise Reports as an independent contractor. She or members of her household own securities of the following companies mentioned in the article: None. She or members of her household are paid by the following companies mentioned in this article: None. 2) The following companies mentioned in this article are billboard sponsors of Streetwise Reports: None. Click here for important disclosures about sponsor fees. 3) Comments and opinions expressed are those of the specific experts and not of Streetwise Reports or its officers. The information provided above is for informational purposes only and is not a recommendation to buy or sell any security. 4) The article does not constitute investment advice. Each reader is encouraged to consult with his or her individual financial professional and any action a reader takes as a result of information presented here is his or her own responsibility. By opening this page, each reader accepts and agrees to Streetwise Reports’ terms of use and full legal disclaimer. This article is not a solicitation for investment. Streetwise Reports does not render general or specific investment advice and the information on Streetwise Reports should not be considered a recommendation to buy or sell any security. Streetwise Reports does not endorse or recommend the business, products, services or securities of any company mentioned on Streetwise Reports. 5) From time to time, Streetwise Reports LLC and its directors, officers, employees or members of their families, as well as persons interviewed for articles and interviews on the site, may have a long or short position in securities mentioned. Directors, officers, employees or members of their immediate families are prohibited from making purchases and/or sales of those securities in the open market or otherwise from the time of the interview or the decision to write an article until three business days after the publication of the interview or article. The foregoing prohibition does not apply to articles that in substance only restate previously published company releases. As of the date of this article, officers and/or employees of Streetwise Reports LLC (including members of their household) own securities of ?????, a company mentioned in this article.
Disclosures from BMO Capital Markets, Glencore, February 18, 2020
IMPORTANT DISCLOSURES
Analyst’s Certification I, Edward Sterck, hereby certify that the views expressed in this report accurately reflect our personal views about the subject securities or issuers. I also certify that no part of our compensation was, is, or will be, directly or indirectly, related to the specific recommendations or views expressed in this report.
Analysts who prepared this report are compensated based upon (among other factors) the overall profitability of BMO Capital Markets and their affiliates, which includes the overall profitability of investment banking services. Compensation for research is based on effectiveness in generating new ideas and in communication of ideas to clients, performance of recommendations, accuracy of earnings estimates, and service to clients.
Analysts employed by BMO Nesbitt Burns Inc. and/or BMO Capital Markets Limited are not registered as research analysts with FINRA. These analysts may not be associated persons of BMO Capital Markets Corp. and therefore may not be subject to the FINRA Rule 2241 restrictions on communications with a subject company, public appearances and trading securities held by a research analyst account.
Company Specific Disclosures Disclosure 2: BMO Capital Markets has provided investment banking services with respect to Glencore within the past 12 months. Disclosure 4: BMO Capital Markets or an affiliate has received compensation for investment banking services from Glencore within the past 12 months. Disclosure 5: BMO Capital Markets or an affiliate received compensation for products or services other than investment banking services within the past 12 months from Glencore. Disclosure 6A: Glencore is a client (or was a client) of BMO Nesbitt Burns Inc., BMO Capital Markets Corp., BMO Capital Markets Limited or an affiliate within the past 12 months: A) Investment Banking Services Disclosure 6C: Glencore is a client (or was a client) of BMO Nesbitt Burns Inc., BMO Capital Markets Corp., BMO Capital Markets Limited or an affiliate within the past 12 months: C) Non-Securities Related Services. Disclosure 9C: BMO Capital Markets makes a market in Glencore in Europe.
For Important Disclosures on the stocks discussed in this report, please click here.
This week – March 1 through March 7- central banks from 6 countries or jurisdictions are scheduled to decide on monetary policy: Australia, Malaysia, Poland, Moldova, Canada and Sri Lanka.
Following table includes the name of the country, the date of the next policy decision, the current policy rate, the result of the last policy decision, the change in the policy rate year to date, and the rate one year ago.
The table is updated when the latest decisions are announced and can always accessed by clicking on This Week.
Money manager Adrian Day reviews recent results from four senior gold companies in light of recent market conditions stemming from coronavirus concerns.
With a higher gold price (in the fourth quarter) than in the same quarter a year ago, results have been generally positive. But last week’s jump in the gold price on concerns about coronavirus have taken many gold stocks to short-term overvalued levels and made them vulnerable to any easing of concerns.
Royal Gold Inc. (RGLD:NASDAQ; RGL:TSX, US$109.09) reported strong production and revenues, the latter up 27% to a new record, though results were somewhat below expectations. (Royalty companies talk of “production,” and the metric often used is “gold equivalent ounces”or GEOstranslating value of various resource royalty streams to gold equivalence.)
There were several positive items in the quarter. The strike at Andacollo ended, with operations resuming in early December, though it was down for most of the quarter. The blockade at Penasquito, which caused a suspension of operations, ended in mid-October, though again, it was out for half of the quarter. Mount Milligan, the company’s largest revenue source, saw improved production on the same quarter a year ago, and particularly higher copper shipments, which helped Royal. And Rainy River had a good quarter operationally.
Troubled assets have good quarter, but what’s the long term?
Mount Milligan’s operator, Centerra Gold Inc. (CG:TSX; CADGF:OTCPK), has announced a complete review of the mine, which will see lower reserves and a shorter mine life. Last year saw a partial shutdown of the mine due to a lack of water. When the mine review was announced in the fall, it caused Royal’s stock price to drop from the high $130s, and it continued to slide almost nonstop until last week and the good results. No date has been announced for release of the mine review, and Royal’s stock will be sensitive to this study.
New Gold Inc. (NGD:TSX; NGD:NYSE.MKT) released an optimization study on Rainy River, reducing the reserves and mine life. The plan envisions a smaller, higher-grade open pit through to 2025 and, concurrently from 2022, selective underground operations to 2027, though with the possibility of extending the mine life beyond. Royal anticipates it will increase its depletion rate but it is not expecting to take an impairment, though it clearly reduces the revenue stream the company had been expecting.
Royal’s next major revenue source will come from the new Khoemacau copper mine in Botswana, with Royal receiving a silver byproduct stream. Royal has made its first two payments, totaling $88 million, over the past few months. It will pay a total of $212 million for 80% of the silver, with a further $53 million for the final 20% at the operator’s option. First shipments are scheduled for mid-2021, and the initial mine life is expected to be 21 years. This will help diversify Royal’s asset base, reducing the
importance of Mount Milligan, though it will also reduce the approximately three-quarters of revenues from currently come from gold, and add some (albeit modest) political risk.
Mount Milligan still the key in near term
Royal paid down its debt again this past quarter, though only modestly. It currently has around $1 billion of capital available, including $865 million on its revolver. The quarter was William Heissenbuttel’s first as president and CEO, though he has been with the company in senior positions since 2016. This follows the retirement of longtime CEO Tony Jenson, as mentioned earlier.
The stock was arguably overvalued last summer, as we mentioned, so the bad news on Mount Milligan hit the stock hard. Valuations are now reasonable compared with the company’s peers, and discount some reduction in revenue from Mount Milligan. The stock is by no means undervalued, however, and vulnerable to another hit if the study is worse than expected. The longer the wait for the study, arguably the less will be the impact on Royal, since Khoemacau will be closer to production. After $7 was tacked on to the stock price in the last four days, we would wait for a retracement to buy. There is no rush.
Yamana’s Slow Turnaround Continues
Yamana Gold Inc. (YRI:TSX; AUY:NYSE; YAU:LSE, US$4.66) reported reasonably strong operations in the latest quarter, with costs under control, though guidance for this year is soft. The balance sheet, though significantly improved over the past year, is still not the strongest, with net debt of over $800 million.
The company has capital requirements over the next three years of $53 million, which it is anticipated will add 1.5 million to reserves. One would normally expect that amount to be funded comfortably from cash flow, but Yamana said it will fund this from further asset sales and from more equity raises (of flow-through funding). It is also stepping up exploration efforts, looking for tier-one assets in mining-friendly jurisdictions.
Looking ahead, it has a couple of large assets that are not fully reflected in the share price. The Agua Rica deposit in Argentina, a joint-venture with Newmont Goldcorp Corp. (NEM:NYSE) and Glencore International Plc (GLEN:LSE), is one of the longest-life, lowest-capital copper projects in the world. A feasibility is expected by early 2021. Malartic underground has generated some very high-grade exploration results, but Yamana has said it won’t proceed unless the royalty ownerOsisko Gold Royalties Ltd. (OR:TSX; OR:NYSE)makes concessions.
Yamana’s turn-around continues, though there is further to go yet, particularly on strengthening the balance sheet. The valuation is reasonable compared with peers. We continue to hold.
Top Assets Perform for Wheaton
Wheaton Precious Metals Corp. (WPM:TSX; WPM:NYSE, US$32.90) surpassed expectations in its recent results, with strong performance from its major asset, the Salobo mine in Brazil, partly offset by the shutdown as Penasquito for half the quarter. It generated 706,900GEOs, with over 400,000 of this from gold and most of the rest from silver and palladium. This year should produce similar, though the total production should increase slightly, up to a five-year average production of 750,000 GEOs.
The stock jumped from under $29 in the last week on the better-than-expected results, particularly from Salobo, which is Wheaton’s largest revenue source. Arguably it is now ahead of itself relative to its peers, particularly given modest anticipated growth in the coming year. Since we are bullish on the metals in the company year, we are holding, but want to see a pullback before buying.
Newmont Maintains Guidance Despite Reserve Cuts
Newmont Goldcorp Corp. (NEM:NYSE, US$49.43) also reported a strong quarter, beating analyst expectations, with generally strong operations. It has already raised $1.4 billion in promised asset sales following the acquisition of Goldcorp. Improvements at many underperforming Goldcorp mines are underway, and costs remain low. The five-year production and cost guidance remained unchanged, while a dividend hike, to $1 a share, was announced.
The year-end reserve study cut reserves at several Goldcorp mines, including Eleonore, while downgrading reserves to resources, at others. The move was not unexpected. The new Nevada joint venture with Barrick Gold Corp. (ABX:TSX; GOLD:NYSE) also saw lower reserves for Newmont, but meaningfully higher grades from the Barrick mines.
As the world’s largest gold miner, Newmont will benefit from renewed interest in gold. We are holding.
Adrian Day, London-born and a graduate of the London School of Economics, heads the money management firm Adrian Day Asset Management, where he manages discretionary accounts in both global and resource areas. Day is also sub-adviser to the EuroPacific Gold Fund (EPGFX). His latest book is “Investing in Resources: How to Profit from the Outsized Potential and Avoid the Risks.”
Disclosure: 1) Adrian Day: I, or members of my immediate household or family, own securities of the following companies mentioned in this article: Royal Gold. I personally am, or members of my immediate household or family are, paid by the following companies mentioned in this article: None. My company has a financial relationship with the following companies mentioned in this article: None. Funds controlled by Adrian Day Asset Management hold shares of the following companies mentioned in this article: Royal Gold, Yamana Gold, Wheaton Precious Metals and Newmont Goldcorp. I determined which companies would be included in this article based on my research and understanding of the sector. 2) The following companies mentioned in this article are billboard sponsors of Streetwise Reports: None. Click here for important disclosures about sponsor fees. The information provided above is for informational purposes only and is not a recommendation to buy or sell any security. 3) Statements and opinions expressed are the opinions of the author and not of Streetwise Reports or its officers. The author is wholly responsible for the validity of the statements. The author was not paid by Streetwise Reports for this article. Streetwise Reports was not paid by the author to publish or syndicate this article. Streetwise Reports requires contributing authors to disclose any shareholdings in, or economic relationships with, companies that they write about. Streetwise Reports relies upon the authors to accurately provide this information and Streetwise Reports has no means of verifying its accuracy. 4) This article does not constitute investment advice. Each reader is encouraged to consult with his or her individual financial professional and any action a reader takes as a result of information presented here is his or her own responsibility. By opening this page, each reader accepts and agrees to Streetwise Reports’ terms of use and full legal disclaimer. This article is not a solicitation for investment. Streetwise Reports does not render general or specific investment advice and the information on Streetwise Reports should not be considered a recommendation to buy or sell any security. Streetwise Reports does not endorse or recommend the business, products, services or securities of any company mentioned on Streetwise Reports. 5) From time to time, Streetwise Reports and its directors, officers, employees or members of their families, as well as persons interviewed for articles and interviews on the site, may have a long or short position in securities mentioned. Directors, officers, employees or members of their immediate families are prohibited from making purchases and/or sales of those securities in the open market or otherwise from the time of the interview or the decision to write an article until three business days after the publication of the interview or article. The foregoing prohibition does not apply to articles that in substance only restate previously published company releases. As of the date of this article, officers and/or employees of Streetwise Reports LLC (including members of their household) own securities of Newmont Goldcorp, companies mentioned in this article.