A member sent me a lovely email tonight. Many of you did, in fact, so thank you.
One member shared a video with me that I just watched and hands down, everyone should take the 41 minutes of this fascinating video on trader’s mindsets and ways to trade. Be sure to listen to the end because every point is crucial for your trading success and mindset.
If you are looking for a trading strategy that is simple to follow part-time, low-risk, and can avoid market crashes through risk management and profit during bear markets, you can have my trades sent to you in real-time here.
If you are stuck at home without work or income, then you should think about the Trading As Your Business program so you can earn a living from any computer anywhere in the world as I do.
I hope you were able to get a few gold nuggets from the video above as I did.
Note: This overview has an informative and tutorial character and is published for free. All the data, included in the overview, are received from public sources, recognized as more or less reliable. Moreover, there is no guarantee that the indicated information is full and precise. Overviews are not updated. The whole information in each overview, including opinion, indicators, charts and anything else, is provided only for familiarization purposes and is not financial advice or а recommendation. The whole text and its any part, as well as the charts cannot be considered as an offer to make a deal with any asset. IFC Markets and its employees under any circumstances are not liable for any action taken by someone else during or after reading the overview.
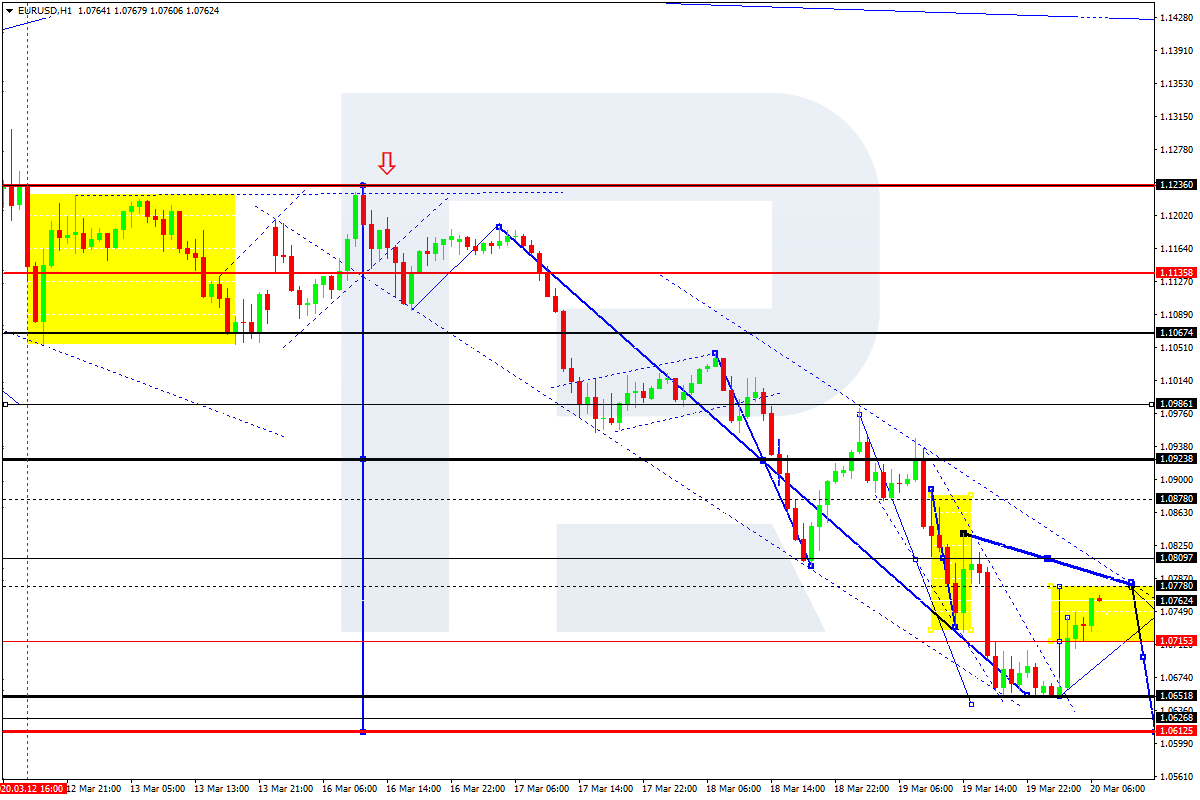
After breaking 1.0810 downwards and then forming a downside continuation pattern there, EURUSD has reached the short-term target at 1.0655; right now, it is growing towards 1.0778. Possibly, the pair may reach this level and then form a new descending structure to reach 1.0715. If later the price breaks this level to the downside, the market may continue trading inside the downtrend towards 1.0612. However, if the instrument breaks 1.0780, it may start a new correction with the target at 1.0922.
GBPUSD, “Great Britain Pound vs US Dollar”
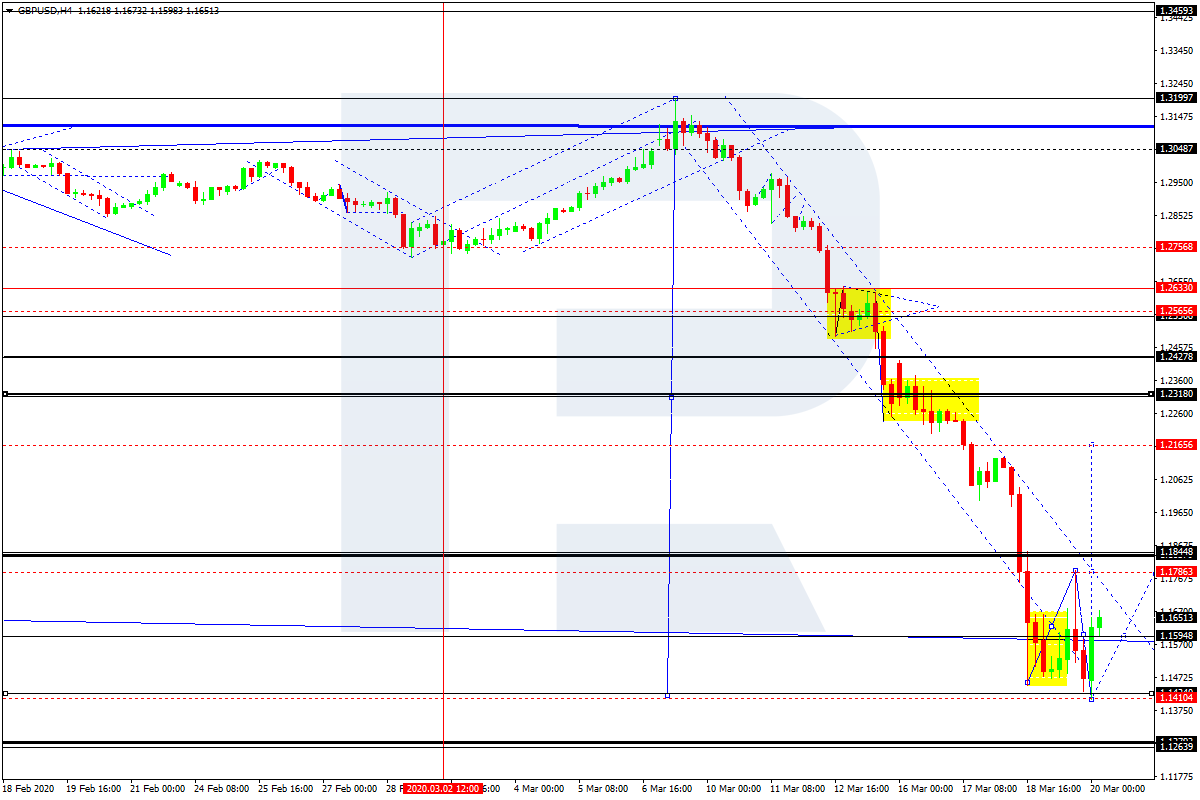
GBPUSD is consolidating around 1.1595. If later the price breaks this range to the downside at 1.1444, the market may resume trading inside the downtrend to reach 1.1264; if to the upside at 1.1786 – start a new correction with the target at 1.2166.
USDCHF, “US Dollar vs Swiss Franc”
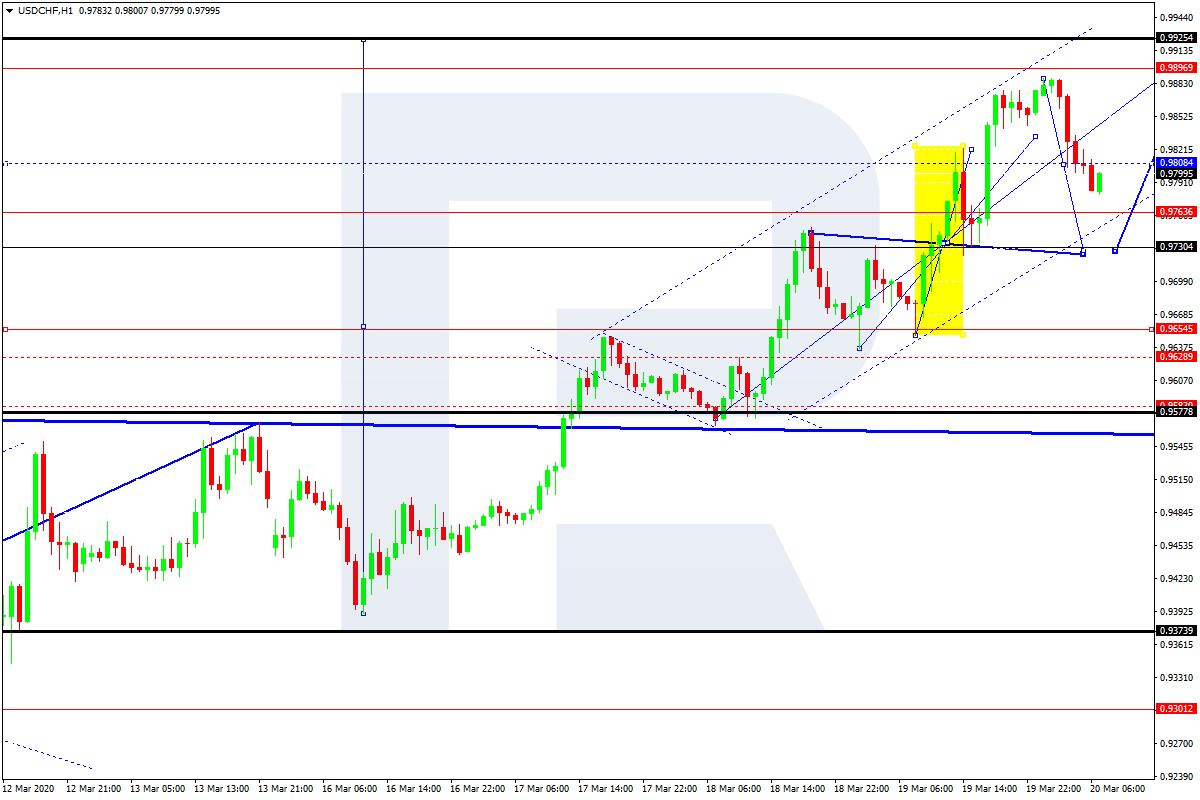
After breaking 0.9730 and forming an upside continuation pattern there, USDCHF has completed the ascending structure with the short-term target at 0.9890; right now, it is falling to test 0.9730 from above. Later, the market may start a new growth towards 0.9925.
USDJPY, “US Dollar vs Japanese Yen”
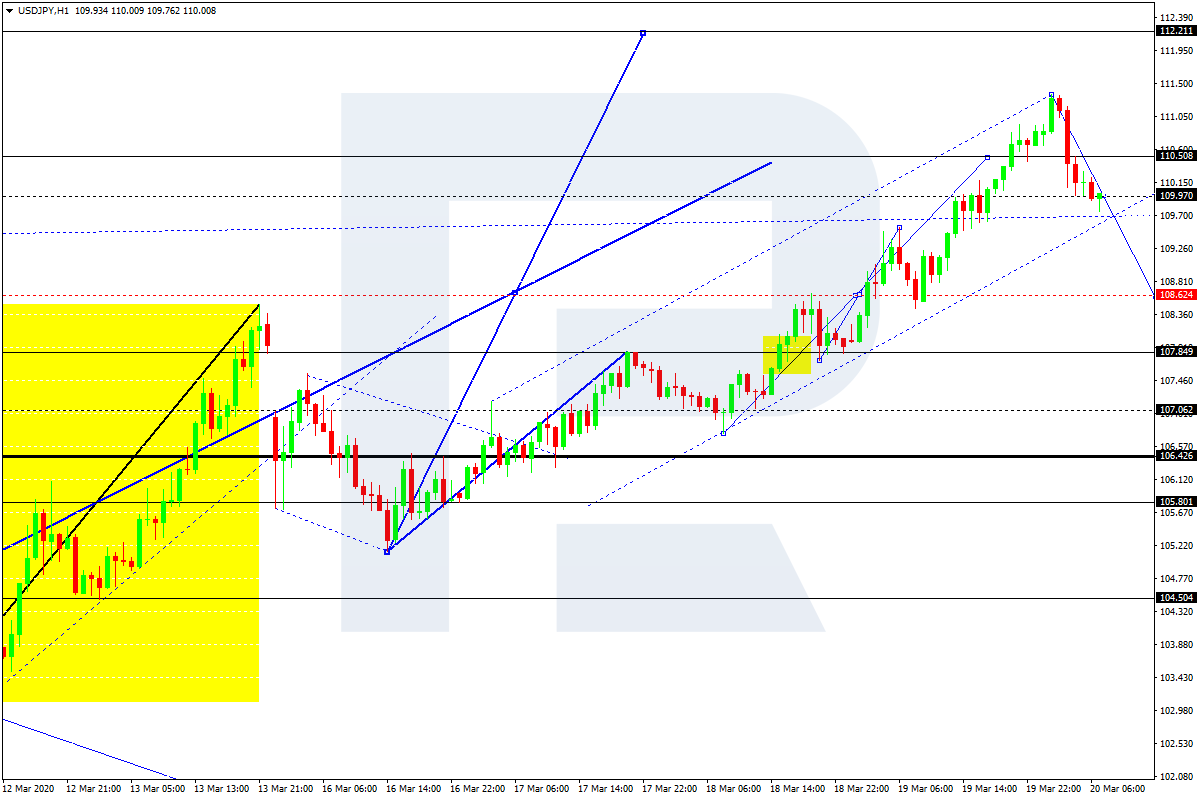
USDJPY has finished the ascending structure at 111.26, thus extending the third ascending wave. Today, the pair may correct to reach 108.63 and then resume growing with the target at 112.21.
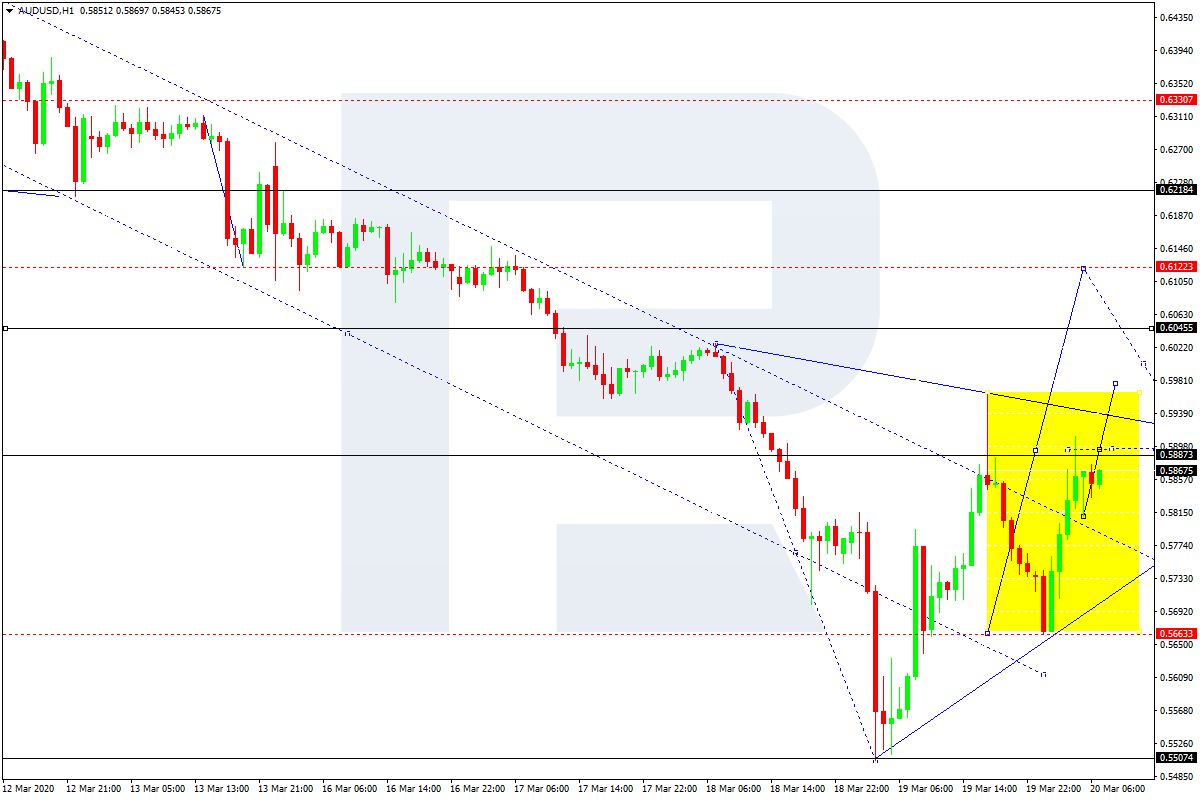
AUDUSD, “Australian Dollar vs US Dollar”
After finishing the ascending structure at 0.5945, AUDUSD has completed the correction towards 0.5666; right now, it is forming the second ascending impulse to reach 0.6122. After that, the instrument may resume trading inside the downtrend towards 0.5888 and the start a new growth with the target at 0.6333.
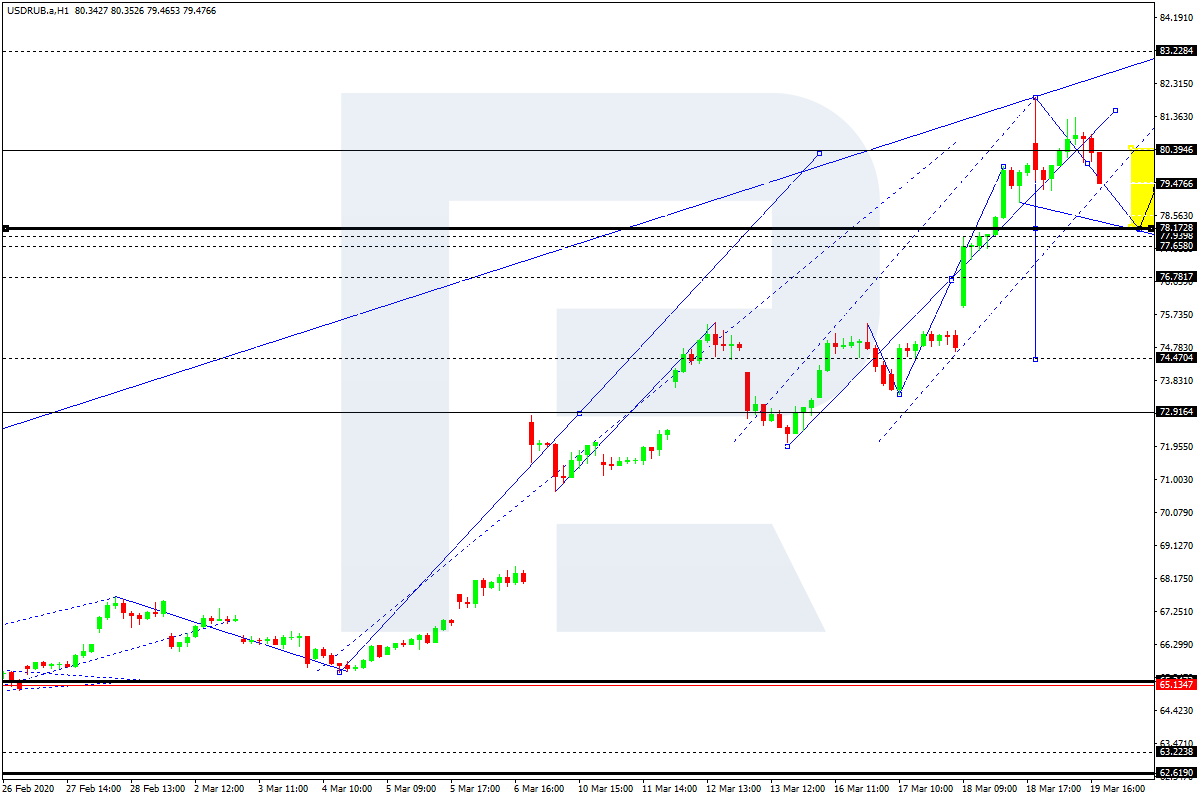
USDRUB, “US Dollar vs Russian Ruble”
USDRUB is forming the first descending impulse towards 78.18. Possibly, the pair may reach this level and then grow towards 80.40, thus forming a new consolidation range above 78.18. Later, the market may form one more ascending structure to reach 83.22 and then resume trading downwards to break 78.00. After that, the instrument may continue falling with the target at 72.90.
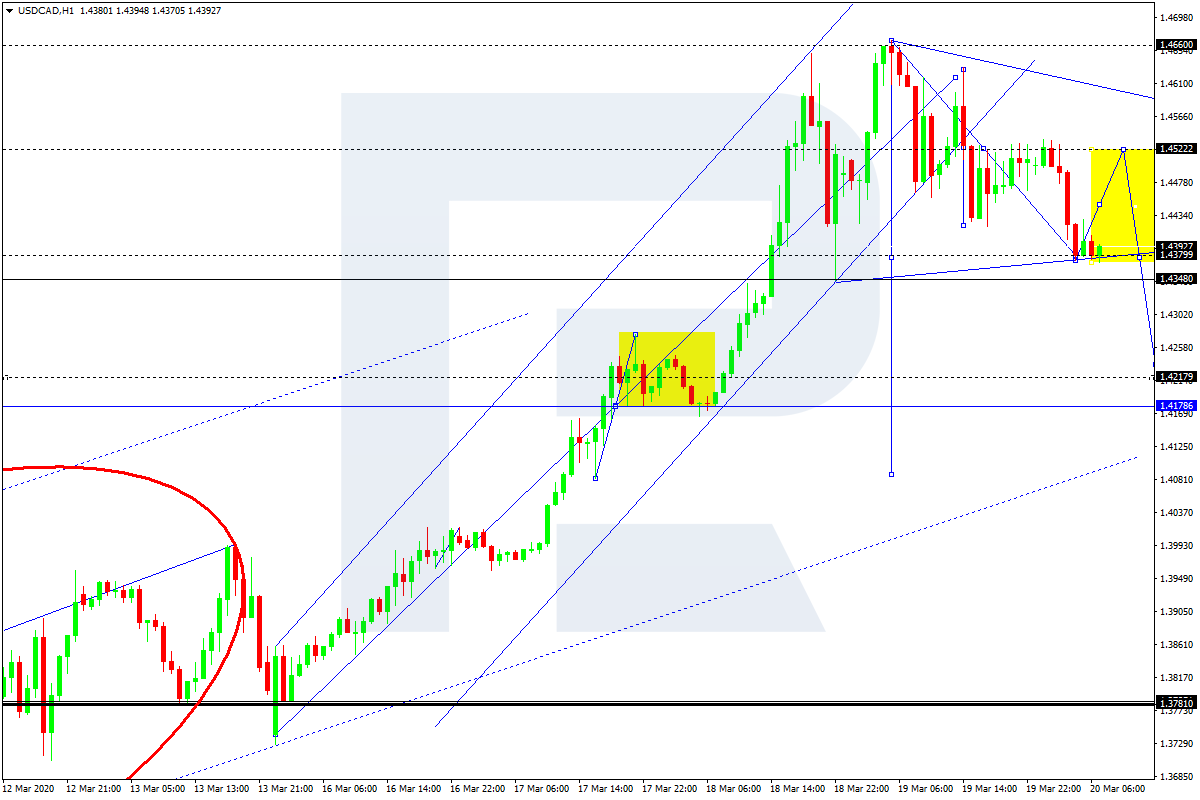
USDCAD, “US Dollar vs Canadian Dollar”
After completing the first descending impulse at 1.4380, USDCAD is forming a new consolidation range. Possibly, the pair may correct towards 1.4522 and then resume trading downwards to break 1.4370. Later, the market may continue falling with the short-term target at 1.4220.
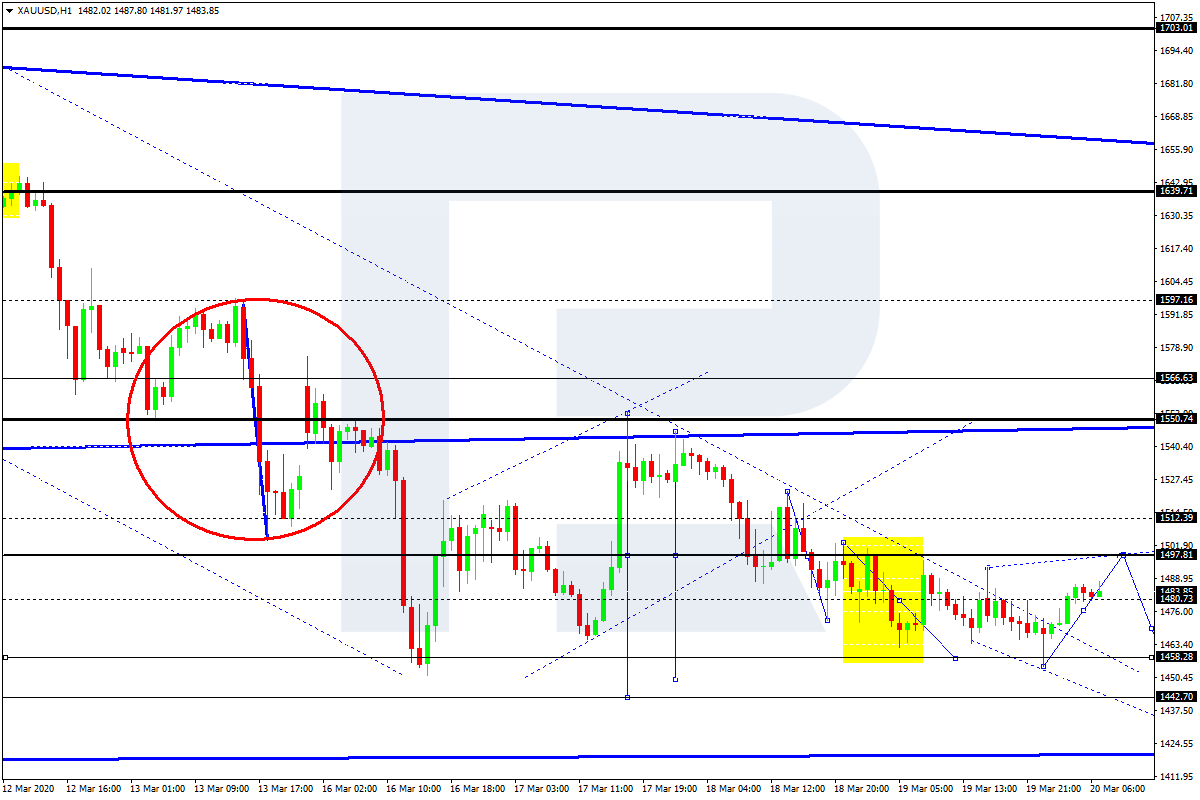
XAUUSD, “Gold vs US Dollar”
Gold has completed the descending structure at 1456.80; right now, it is growing towards 1497.82. After that, the instrument may form a new descending structure with the target at 1442.70.
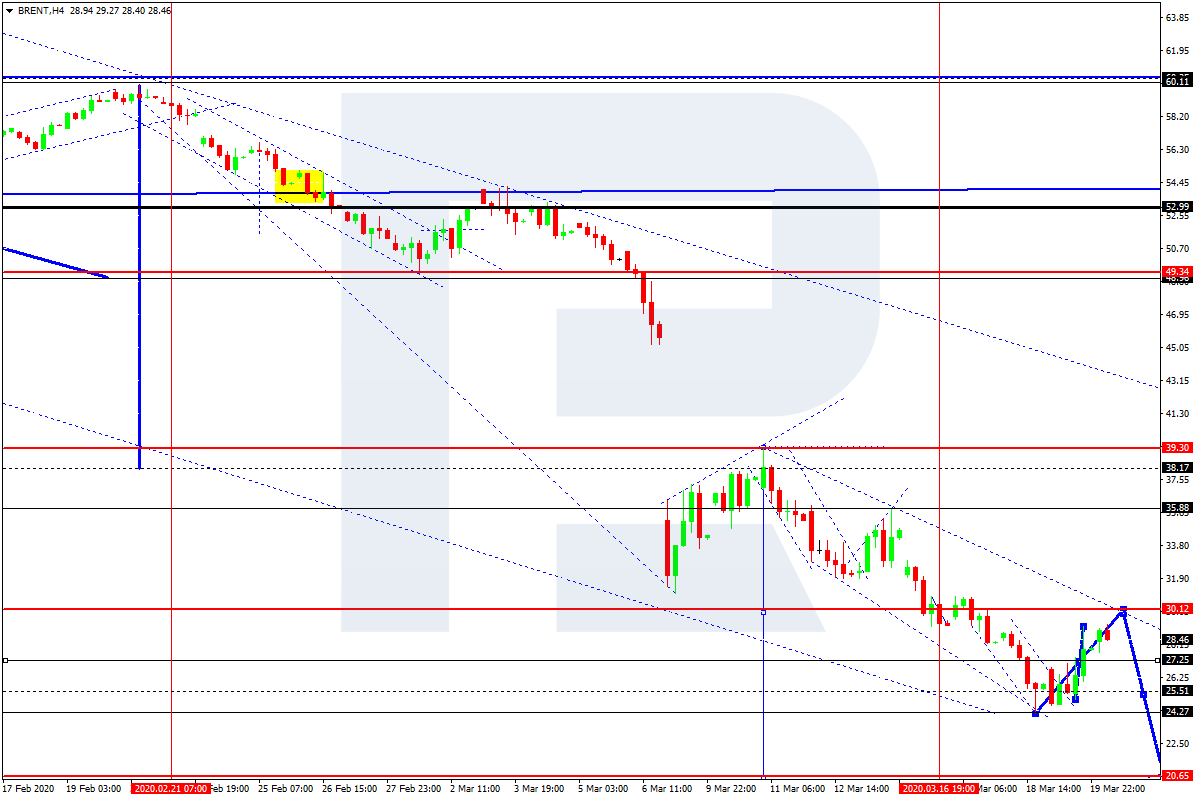
BRENT
Brent is growing towards 30.12. Possibly, the pair may reach this level and then form a new descending structure towards 27.25, thus forming a new consolidation range between them. If later the price breaks this range to the upside at 30.20, the market may resume trading upwards to reach 39.30; if to the downside at 27.00 – start a new decline with the target at 20.70.
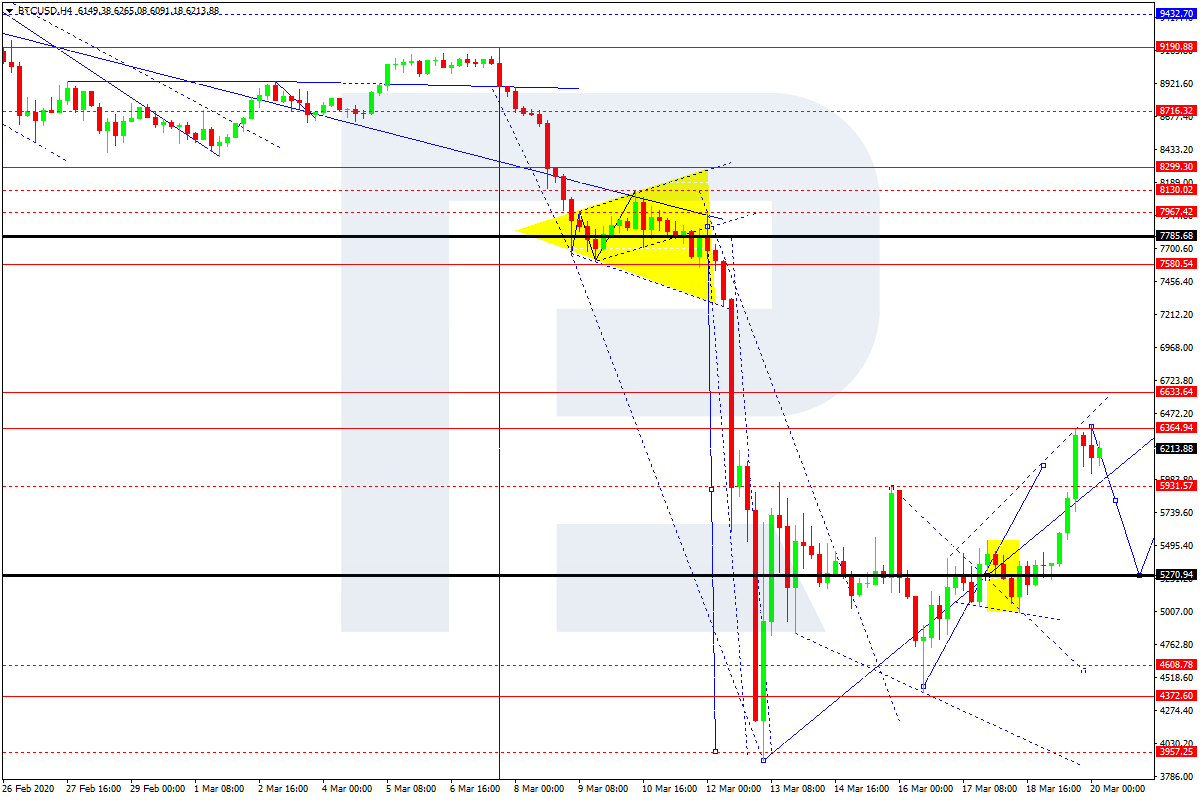
BTCUSD, “Bitcoin vs US Dollar”
BTCUSD has finished the ascending structure at 6300.00, which may be considered as the third wave inside the ascending impulse. The main scenario implies that the instrument may correct towards 5300.00 and then resume trading upwards with the first target at 6600.00.
Attention! Forecasts presented in this section only reflect the author’s private opinion and should not be considered as guidance for trading. RoboForex LP bears no responsibility for trading results based on trading recommendations described in these analytical reviews.
The EUR/USD currency pair has stabilized after a significant drop. The sentiments of financial market participants improved slightly amid the global support measures taken by the central banks. At the moment EUR/USD quotes are consolidating. The key support and resistance levels are 1.06550 and 1.08200, respectively. Technical correction is not ruled out in the nearest future. We recommend opening positions from key levels.
At 16:00 (GMT+2:00) data on the existing home sales in US will be published.
Indicators do not give accurate signals: the price tests 50 MA, which is currently a dynamic resistance.
Histogram of MACD started to rise, which indicates a possible correction of the EUR/USD currency pair.
The Stochastic Oscillator is located in the overbought zone, the %K line crossed the %D line. There are no signals at the moment.
Trading recommendations
Support levels: 1.06550, 1.06000
Resistance levels: 1.08200, 1.09550, 1.10600.
If the price fixes above 1.08200, expect the qutoes to correct toward 1.09000-1.09700
Alternatively, the quotes could descend toward the round 1.06000.
The GBP/USD currency pair
Technical indicators of the currency pair:
Prev Open: 1.15803
Open: 1.14620
% chg. over the last day: -1.04
Day’s range: 1.14096 – 1.18765
52 wk range: 1.1466 – 1.3516
GBP/USD quotes went up after a significant collapse. Pound has updated local highs. At the moment the trading instrument is testing the round level 1.19000. The mark 1.16600 is the nearest support. The GBP/USD currency pair has a potential for further correction. We recommend you to monitor the current information about the spread of the virus COVID-19. Open positions from key levels.
The news background on the UK economy is calm.
Indicators do not give accurate signals: the price has crossed 50 MA and 100 MA.
MACD has moved to the positive zone, which indicates the correction of the currency pair GBP/USD.
The Stochastic Oscillator is located in the overbought zone, the %K line crossed the %D line. There are no signals at the moment.
Trading recommendations
Support levels: 1.16600, 1.14500
Resistance levels: 1.19000, 1.21350
If the price fixes above the round level of 1.19000, expect a correction toward 1.19000.
Alternatively, the quotes could descend toward 1.15000-1.14000.
The USD/CAD currency pair
Technical indicators of the currency pair:
Prev Open: 1.45086
Open: 1.45003
% chg. over the last day: -0.06
Day’s range: 1.42074 – 1.45359
52 wk range: 1.2949 – 1.4668
The USD/CAD currency pair shows a correction movement after a prolonged rally. The quotes have updated the local lows. The CAD is supported by the “black gold” price recovery. At the moment the trading instrument is testing the level of 1.41700. The round level 1.44000 is already a “mirror” resistance. The USD/CAD currency pair has a potential for further decline. Open positions from key levels.
At 14:30 (GMT+2:00) Canada will publish a report on retail sales.
Indicators do not give accurate signals: the price has crossed 100 MA.
MACD histogram is in the negative zone, which indicates further correction of USD/CAD quotes.
The Stochastic Oscillator is located in the oversold area, the %K line has crossed the %D line. There are no signals at the moment.
Trading recommendations
Support levels: 1.41700, 1.40150, 1.38750
Resistance levels: 1.44000, 1.46600
If the price fixes below 1.41700, expect a correction toward 1.40200-1.39000.
Alternatively, the quotes could grow toward 1.45000-1.46000.
The USD/JPY currency pair
Technical indicators of the currency pair:
Prev Open: 108.042
Open: 110.888
% chg. over the last day: +2.16
Day’s range: 109.329 – 111.359
52 wk range: 101.19 – 112.41
USD/JPY currency pair shows a pronounced upward trend. The quotes have renewed the local highs. Demand for safe haven currencies has weakened. At the moment the trading instrument is testing the “mirror” support level 109.500. The mark 111.300 is the nearest resistance. USD/JPY quotes have potential for further growth. We recommend you to pay attention to the dynamics of the US government securities yield. Open positions from key levels.
The Economic News Feed for 20.03.2020 is calm.
The indicators signal the power of buyers: the price has fixed above 50 MA and 100 MA.
The MACD histogram is in the positive zone, but below the signal line, which gives a weak signal to buy USD/JPY.
The Stochastic Oscillator is in the neutral zone, the %K line is above the %D line, which indicates a bullish sentiment.
Trading recommendations
Support levels: 109.500, 108.500, 107.850.
Resistance levels: 111.300, 112.000
If the price fixes above 111.300, expect further growth.
Alternatively, the quotes could descend toward 108.500-107.500.
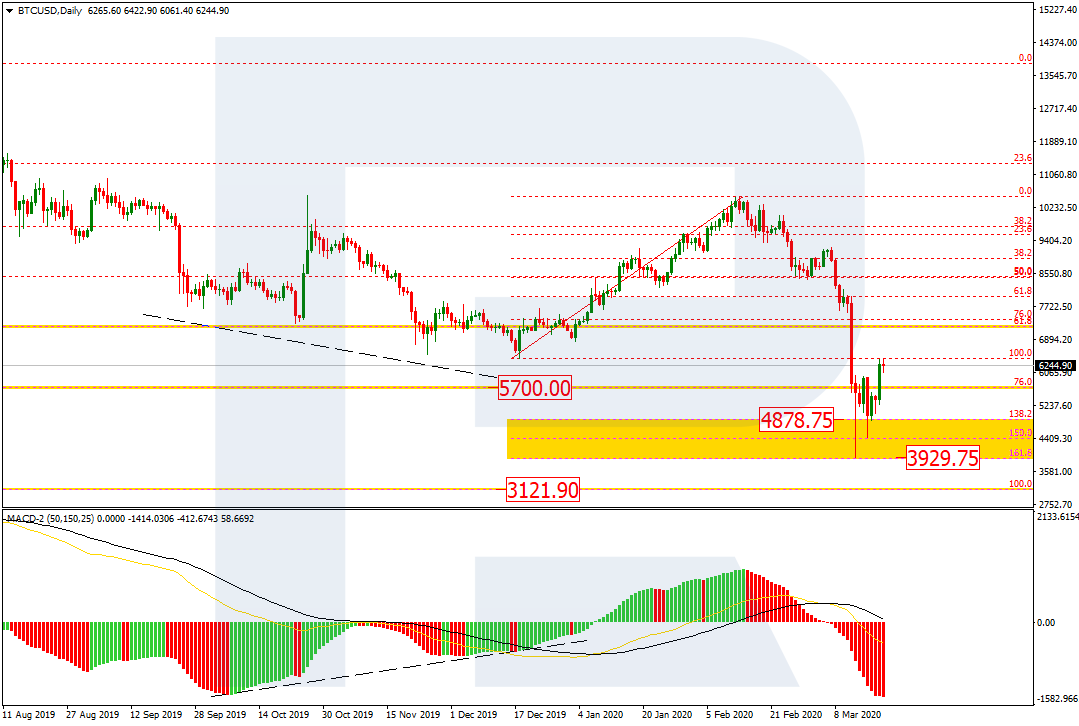
As we can see in the daily chart, after reaching the post-correctional extension area between 138.2% and 161.8% fibo at 4780.75 and 3929.75 respectively, BTCUSD has started a new rising correction. After completing the pullback, the instrument may resume falling towards the long-term fractal low at 3121.90.
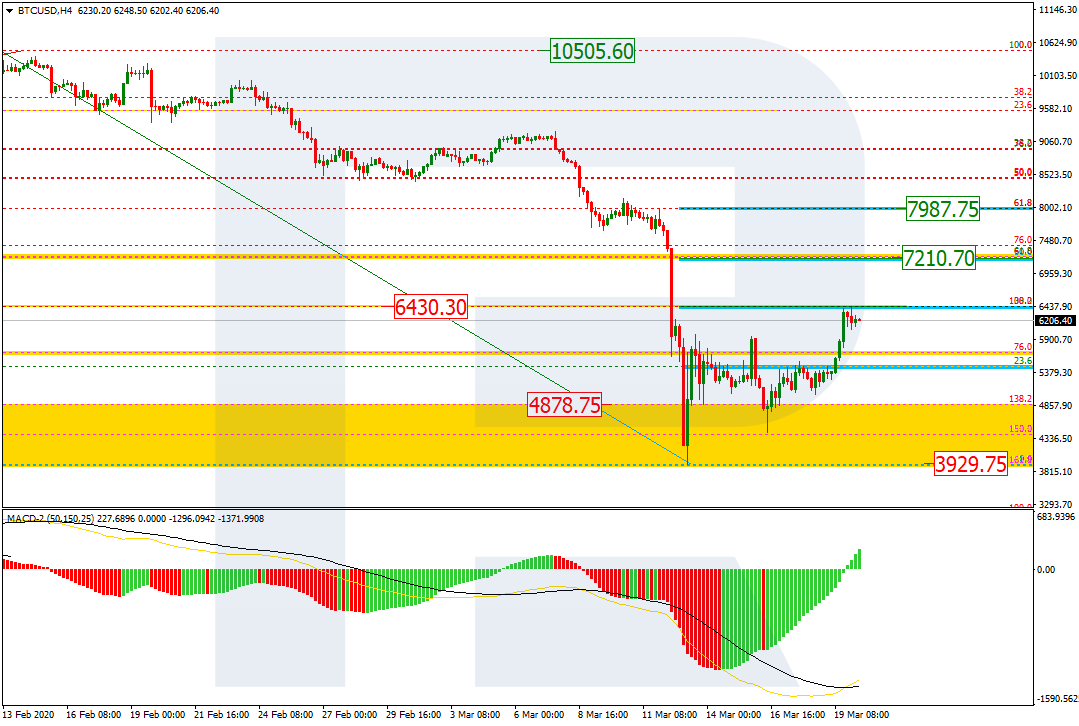
The H4 chart shows more detailed structure of the current correction. The pair has already reached 38.2% fibo and may yet continue growing towards 50.0% and 61.8% fibo at 7210.70 7987.75 respectively.
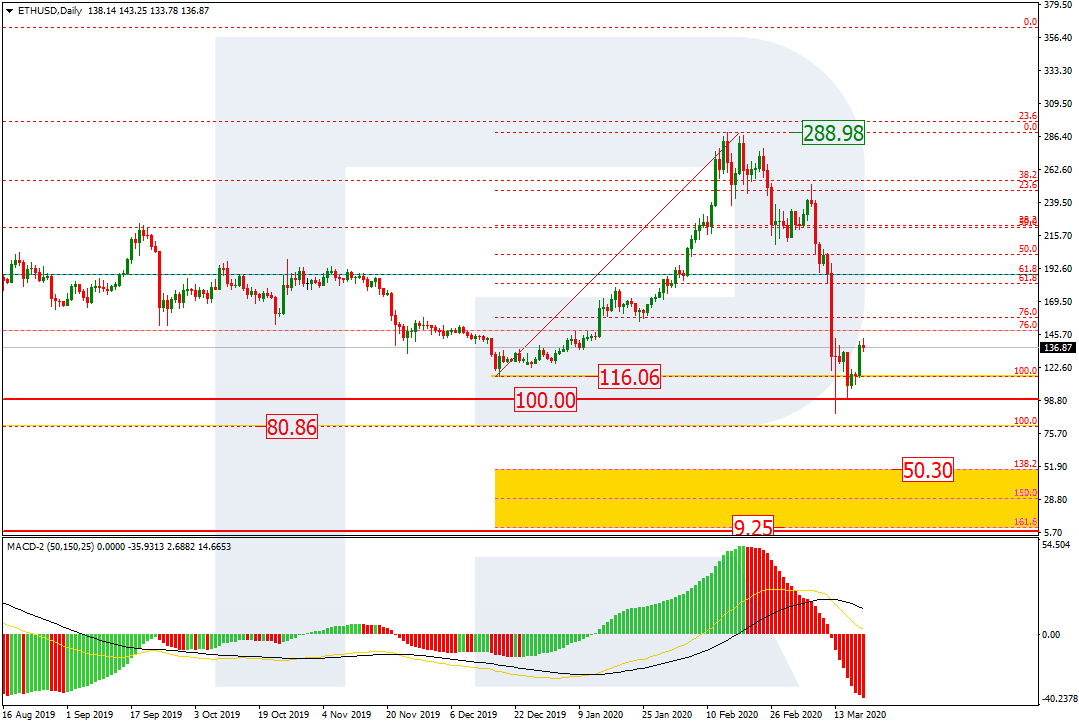
ETHUSD, “Ethereum vs. US Dollar”
As we can see in the daily chart, after breaking the low at 116.06, the pair is rebounding from the psychologically important level at 100.00. At the same time, we should note that the current growth is just a rising correction. After finishing this pullback, ETHUSD may resume falling towards the long-term low at 80.86, as well as the post-correctional extension area between 138.2% and 161.8% fibo at 50.30 and 9.25 respectively.
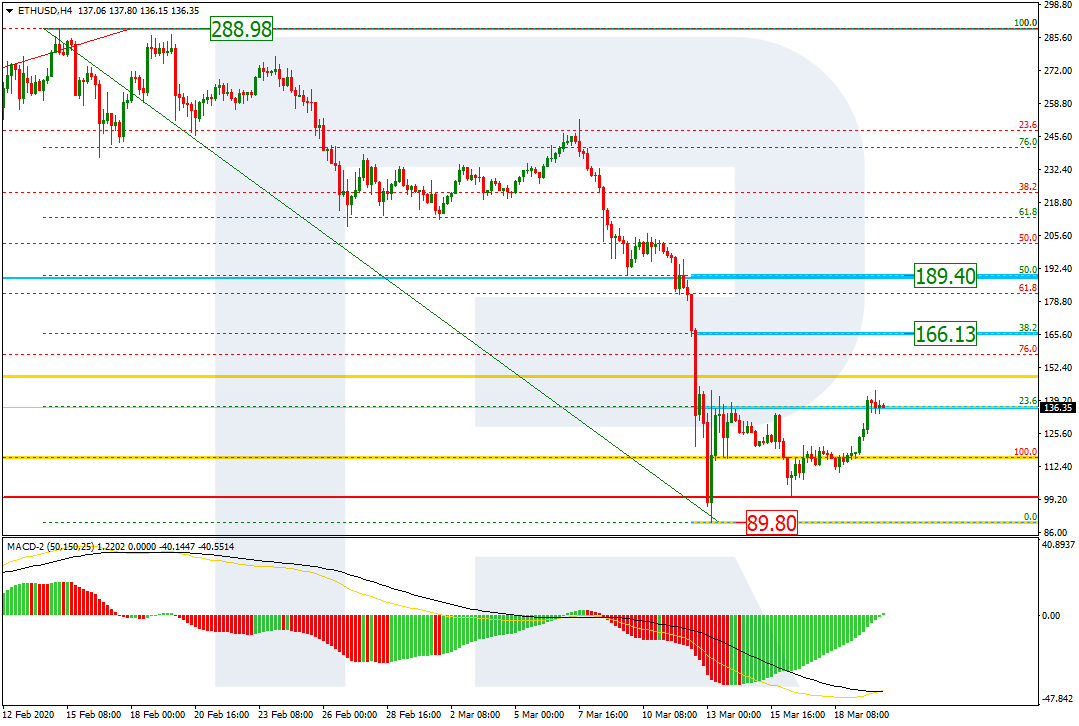
In the H4 chart, the pair is correcting; it has already reached 23.6% fibo. In the future, the price may reach 38.2% and 50.0% fibo at 166.13 and 189.40. The support is the low at 89.80.
Attention! Forecasts presented in this section only reflect the author’s private opinion and should not be considered as guidance for trading. RoboForex LP bears no responsibility for trading results based on trading recommendations described in these analytical reviews.
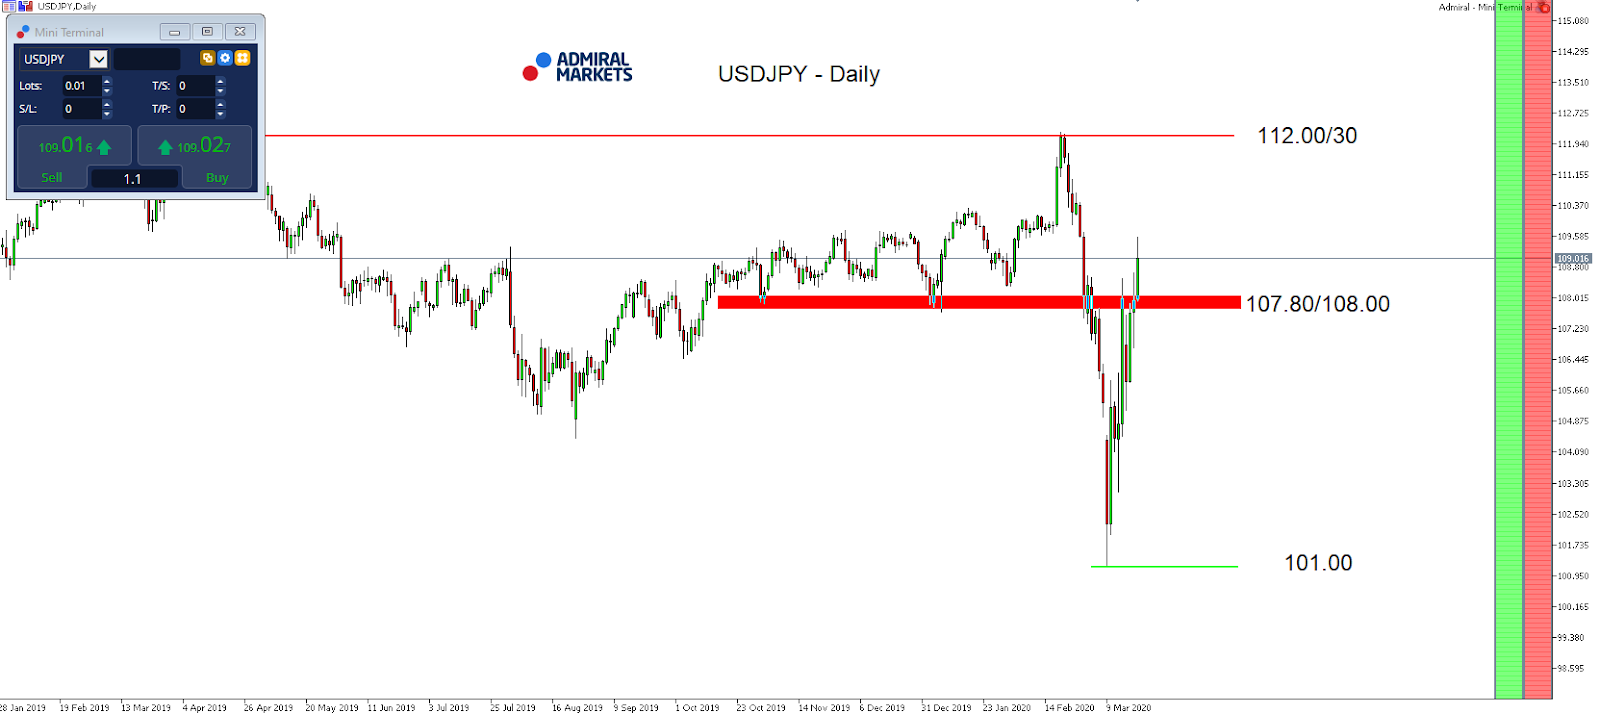
Volatility in forex markets and US yields remained dramatic over the last few days, and thus also in the highly yield-sensitive USD/JPY.
Interestingly enough, and despite the fear among market participants keeping selling pressure on Equities high, the USD/JPY saw a re-test of the region around 108.50/109.00.
While one explanation comes from the sharp bounce in US-Treasury yields back above 1.00%, in addition to the massive USD shortage and re-installation of swap lines with global central banks from the Fed on March 15, may have added to the demand in the currency pair.
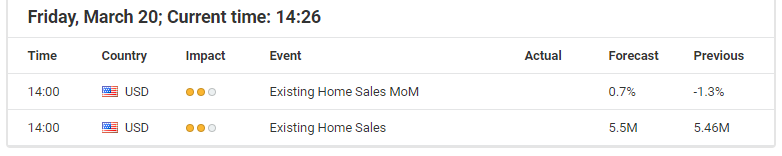
Still, taking a step back, we expect volatility to continue to stay very high, seeing US yields under further pressure, and thus we favour the Short-side in the USD/JPY, with a potential driver being today’s Existing Home Sales numbers which are publish at 2pm GMT.
Any print that is significantly below markets expectation at 0.7% (MoM) would point to signs of significant negative impact from the Coronavirus pandemic on the US economy, and US yields could drop lower into the weekly close alongside the USD/JPY, making a test of the region around 105.00/30 into the weekly close an option.
On the other hand, we remain very cautious in regards to overly optimistic USD/JPY Short engagements. This is because not only do we expect further strong USD demand given the USD shortage, and usage of the re-installed swap lines of the Fed from the BoJ.
Source: Admiral Markets MT5 with MT5-SE Add-on USD/JPY Daily chart (between January 29, 2019, to March 19, 2020). Accessed: March 19, 2020, at 10:00pm GMT – Please note: Past performance is not a reliable indicator of future results, or future performance.
In 2015, the value of USDJPY increased by 0.5%, in 2016, it fell by 2.8%, in 2017, it fell by 3.6%, in 2018, it fell by 2.7%, in 2019, it fell by 0.85%, meaning that after five years, it was down by 9.2%.
Discover the world’s #1 multi-asset platform
Admiral Markets offers professional traders the ability to trade with a custom, upgraded version of MetaTrader 5, allowing you to experience trading at a significantly higher, more rewarding level. Experience benefits such as the addition of the Market Heat Map, so you can compare various currency pairs to see which ones might be lucrative investments, access real-time trading data, and so much more. Click the banner below to start your FREE download of MT5 Supreme Edition!
Disclaimer: The given data provides additional information regarding all analysis, estimates, prognosis, forecasts or other similar assessments or information (hereinafter “Analysis”) published on the website of Admiral Markets. Before making any investment decisions please pay close attention to the following:
This is a marketing communication. The analysis is published for informative purposes only and are in no way to be construed as investment advice or recommendation. It has not been prepared in accordance with legal requirements designed to promote the independence of investment research, and that it is not subject to any prohibition on dealing ahead of the dissemination of investment research.
Any investment decision is made by each client alone whereas Admiral Markets shall not be responsible for any loss or damage arising from any such decision, whether or not based on the Analysis.
Each of the Analysis is prepared by an independent analyst (Jens Klatt, Professional Trader and Analyst, hereinafter “Author”) based on the Author’s personal estimations.
To ensure that the interests of the clients would be protected and objectivity of the Analysis would not be damaged Admiral Markets has established relevant internal procedures for prevention and management of conflicts of interest.
Whilst every reasonable effort is taken to ensure that all sources of the Analysis are reliable and that all information is presented, as much as possible, in an understandable, timely, precise and complete manner, Admiral Markets does not guarantee the accuracy or completeness of any information contained within the Analysis. The presented figures refer that refer to any past performance is not a reliable indicator of future results.
The contents of the Analysis should not be construed as an express or implied promise, guarantee or implication by Admiral Markets that the client shall profit from the strategies therein or that losses in connection therewith may or shall be limited.
Any kind of previous or modeled performance of financial instruments indicated within the Publication should not be construed as an express or implied promise, guarantee or implication by Admiral Markets for any future performance. The value of the financial instrument may both increase and decrease and the preservation of the asset value is not guaranteed.
The projections included in the Analysis may be subject to additional fees, taxes or other charges, depending on the subject of the Publication. The price list applicable to the services provided by Admiral Markets is publicly available from the website of Admiral Markets.
Leveraged products (including contracts for difference) are speculative in nature and may result in losses or profit. Before you start trading, you should make sure that you understand all the risks.
Crude oil prices finally caught a bid after falling to $20 a barrel.
If the upside continues, we expect oil prices to test the 28.00 level of resistance. We estimate price action to remain range-bound within the 28 – 20 handle.
However, there is a risk that prices could slip below this level due to the downside pressure.
But, given the hidden bearish divergence, we expect a reversal in the near term.
On Thursday, March 19, trading on the euro was down 3% at the close. The ongoing new coronavirus pandemic has caused the markets to collapse. Investors rush towards the US dollar because it was used as the financing currency. Now they are buying it back.
The Bank of England held an unscheduled meeting, where it decided lowered its base interest rate by 15 bp to 0.1% from 0.25%. The regulator also increased the volume of the government bond repurchase program by £200bn. GBP, to £645bn. GBP.
The Reserve Bank of Australia (RBA) also lowered its interest rate for the second time by 25 bp, to a record low of 0.25% per annum. Also, the Central Banks of Indonesia, the Philippines, Brazil and Taiwan lowered their rates. Amid a strengthening dollar, an easing in monetary policy has put pressure on all major currencies.
Today’s events (GMT+3):
12:00 Eurozone: Current Account n.s.a (Jan).
12:30 UK: Public Sector Net Borrowing (Feb).
15:30 Canada: Retail Sales (MoM) (Jan).
17:00 USA Existing Home Sales (MoM) (Feb).
20:00 USA: Baker Hughes US Oil Rig Count.
Current situation:
The expectations made according to the forecast were fully justified. The price has fallen below 1.0802. With increased volatility, the Gann price ranges lost. Levels have all been well tested, but it’s tough to say which ones have become important. Yesterday, the price stopped at the 90th, 225th and 270th degrees. In the previous fall, other degrees worked.
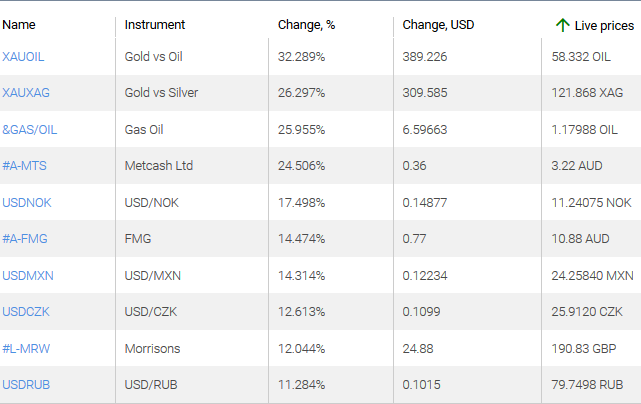
Today, major currencies are trading in the black against the US dollar. The growth leaders are AUD and NZD. Prices are rising against the backdrop of rising oil prices and positive on stock exchanges.
Crosses with the euro are all in the red. The EURUSD pair rebounded 130 points from a low of 1.0653. The balance line (Lb) passes through the 1.0841 mark. The stochastic is located in the “sell zone”. This is considered a strong signal, according to the trend. There is no “bullish” divergence. Given the above factors, it will be more correct to consider the further weakening of the euro. According to the forecast, I am waiting for a fall from the Lb to 1.0600. It’s already scary to go into shorts, so it’s better to sit outside the market, especially given that this is the last day of the week.
Coronavirus continues to conquer the world outside of China. Scientists are struggling to invent a cure for it. The Central Bank and governments have already taken measures, but they are not enough to stop the panic in the markets.