A darker mood awaits Oil markets after WTI Crude collapsed to its lowest level since December 1998 below $11.
Over the past few months, the story defining Oil’s painful depreciation revolved around the coronavirus chaos, demand destruction and oversupply concerns. Rising fears over fuel storage facilities being overwhelmed by the excessive supply are compounding to Oil’s woes and offered investors another reason to attack the already battered commodity. With economic growth in the world’s largest energy consumer decelerating, the grim outlook for Oil is growing grimmer by the day. At this point in time, it is difficult to pinpoint a possible floor for WTI Crude and this continues to be reflected in the bearish price action.
WTI Crude has depreciated 7% today and more than 80% since the start of 2020. Prices are heavily bearish on the daily timeframe with the technical and fundamentals well aligned. Sustained weakness below $15 could open the doors towards $10 and potentially lower.
Alternatively, a breakout above $15 may trigger a technical rebound back towards $29 before bears re-enter the scene.
Disclaimer: The content in this article comprises personal opinions and should not be construed as containing personal and/or other investment advice and/or an offer of and/or solicitation for any transactions in financial instruments and/or a guarantee and/or prediction of future performance. ForexTime (FXTM), its affiliates, agents, directors, officers or employees do not guarantee the accuracy, validity, timeliness or completeness, of any information or data made available and assume no liability as to any loss arising from any investment based on the same.
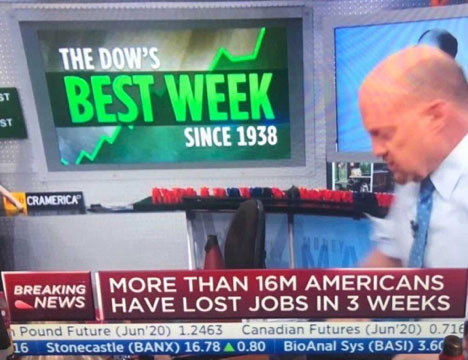
Investment demand for physical gold and silver is unrelenting. Buying activity actually picked up slightly last week as paper gold and silver prices drifted sideways to lower.
Once again, anyone simply watching the gold price on CNBC would be shocked to know just how many people are buying gold.
The Fed, and the cabal of Wall Street Banks it represents, are undoubtedly relieved to have metals prices under control. But they have a serious problem and it is bigger than the gold market.
The disconnect between virtually all paper asset prices and real-world fundamentals has never been greater.
The screen capture below pretty well sums it up:
The ponies at the Federal Reserve performed their one trick. They printed $4 trillion and handed it to Wall Street bankers. They galloped in to buy everything bankers needed to sell, including junk bonds, other corporate debt, and stocks.
Despite the rules against outright equity purchases, there can be little doubt the Fed’s largesse is behind the frenzied buying in the stock markets in recent weeks.
There may be rules, but nobody is watching as to whether or not they get broken. The Fed is not required to provide the details of its exploits to anyone. It never submits to an audit.
Nobody in Washington even wants to know exactly where the Fed’s trillions go anymore. The rest of us, however, can make a pretty good guess just by watching CNBC.
When the troubled assets the Fed is so feverishly buying right now go bad, we won’t hear about that either. The important thing, from Chairman Jerome Powell’s point of view, is that he answered the call from Wall Street elites who needed someplace to dump a whole lot of garbage fast.
Our dollars will buy less because trillions of them were printed to buy this waste. That’s how bankers’ losses are socialized and how the Federal government grows far faster than the rate of overt taxation year after year.
It’s the world’s biggest racket.
The trouble is that Americans can see what is happening. Congress deliberated on sending $1,200 to most, though certainly not all, citizens.
Meanwhile Jerome Powell rushed 10 times that overall stimulus amount through for the banks, untroubled by the need for public debate.
Large and well-connected corporations, like Boeing, are getting a disproportionate share of the free money passed through Congress. That makes plenty of people angry. Many of us know how undeserving these corporate charity cases are.
Boeing remains under criminal investigation for lying about the safety of its newest airliner. People died when some of these jets crashed. This company plowed tens of billions into buying back huge quantities of shares, including boatloads of stock from the same company executives who devised and launched the share buyback program.
The airline manufacturer was wholly unprepared for the rainy day which is now upon us. Hundreds of thousands of honest businesses may fail in the economic collapse now underway. Boeing, however, will not be counted among the bankrupt.
It’s fundamentally unfair, and it is on full display.
Washington, Wall Street, and the Fed are replaying what they did during the 2008 Financial Crisis, only on a much larger scale. People remember those unpopular bailouts for the “too big to jail” banks.
Public anger and a collapse in confidence is a serious problem for the elites running this rigged game.
This brings us back to the cracks which are starting to form in the paper metals markets. Bullion banks could lose control over prices, and it wouldn’t take much given investors’ current level of unease.
The scheme to sell ever larger amounts of paper metal in order to cap prices is getting untenable. The number of investors smelling trouble and standing for delivery of physical bars is rising dramatically.
It’s worth pointing out here that a loss of control doesn’t have to mean paper prices going skyward. It could just as easily mean the prices of paper contracts start reflecting their intrinsic value, which is somewhere closer to zero. That’s what will happen if there are defaults on the exchanges.
Bankers, including Jerome Powell at the Fed, definitely do not want to see demand for physical bars overwhelm the paper exchanges. It’s just the sort of challenge central planners run into when they disconnect markets from reality.
The Money Metals News Service provides market news and crisp commentary for investors following the precious metals markets.
The decrease in beef production in the United States is due to the closure of a significant number of slaughterhouses and meat processing plants due to the coronavirus pandemic. In particular, JBS USA and the National Beef Packing Company ceased operations. Earlier, LCATTLE quotes fell to a minimum since May 2006. It could also affect the sentiments of manufacturers. Note that the demand for American beef in the world market remains quite high. From the beginning of 2020 up to April 9, US exports increased by 12% compared to the same period in 2019. China and Asian countries are the main buyers.
Right now the world is facing the worst economic downturn since the Great Depression and many people across the world are going through extremely hard times.
But we also need to try and focus on the compelling positives there are now to create, build and safeguard money to reach our financial goals for ourselves and our loved ones.
The message from Nigel Green, founder and CEO of deVere Group, one of the world’s largest independent financial advisory organisations comes as the International Monetary Fund (IMF) projects global growth in 2020 to fall to -3 per cent. This is a downgrade of 6.3 percentage points from January 2020, clearly a significant downward revision within a very short time period.
Nigel Green comments: “The world has changed considerably in the first quarter of 2020. Coronavirus has sparked a truly global crisis like no other, with a horrifyingly high and tragic number of human lives lost.
“It has also been a monstrous source of economic upheaval and uncertainty for households, businesses and governments.
“But in these most unusual of times, it’s essential to seek the positives and there are increasingly significant reasons within the market to be cheerful.
“Looking beyond the gloom, many investors are using these to create, build and safeguard their money right now.”
He continues: “I believe that there are three main investment reasons to be cheerful.
“First, the market is cheap by historic standards and this represents a major, perhaps once-in-a-generation chance to buy top quality equities at lower prices to bolster investment portfolios. History shows that stock markets always go up over time.
“Second the worldwide loosening of monetary and fiscal policies. This will serve as a bridge for economies until the crisis passes and will go a long way to boost both supply and demand across all sectors. In turn, this will lead to more investment, increased confidence, and longer-term job and wealth creation.
“Third, pent-up demand will hit the global economy when lockdowns are lifted. Many people have not lost their jobs or suffered reduced incomes and have saved money during the lockdown. We can expect demand in sectors such as autos, travel, hospitality and entertainment to be strong.”
Whilst some investors appear to have not only locked down themselves, but also their financial strategies, increasingly both retail and institutional investors are “rightly looking beyond only the dark picture,” says Mr Green.
The deVere CEO concludes. “No economy – developed or emerging – has been spared this downturn, the worst since The Great Depression. The uncertain economic landscape is impacting on people’s lives and livelihoods.
“However, I also would urge investors to mitigate risks to their money and help create and grow wealth by looking towards the undeniable and compelling positive areas amid this tragic and unprecedented global situation.”
About:
deVere Group is one of the world’s largest independent advisors of specialist global financial solutions to international, local mass affluent, and high-net-worth clients. It has a network of more than 70 offices across the world, over 80,000 clients and $12bn under advisement.
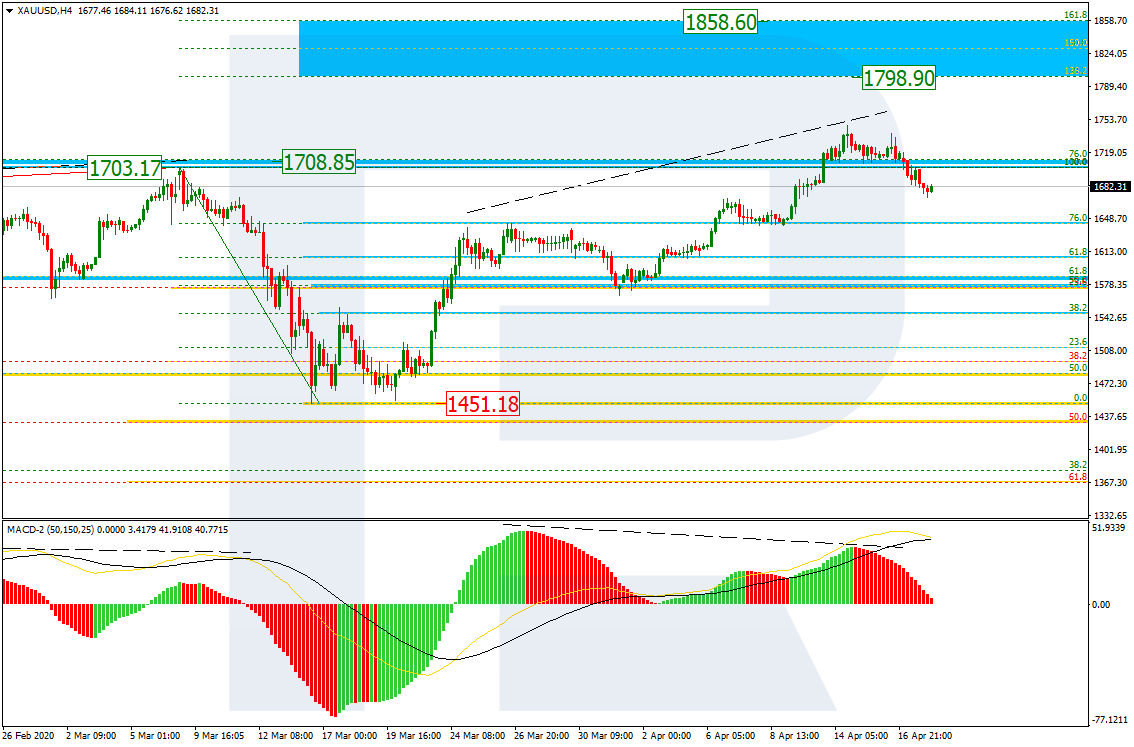
As we can see in the H4 chart, after updating its previous high, the ascending wave has reached 76.0% fibo. XAUUSD might have continued its growth to reach the post-correctional extension area between 138.2% and 161.8% fibo at 1798.90 and 1858.60 respectively, but there was a divergence on MACD to indicate a тку pullback to the downside. The support remains at the low at 1451.18.
In the H1 chart, the divergence made the pair reverse and start a new decline, which has already reached 23.6% fibo. The next downside targets are 38.2% and 50.0% fibo at 1634.40 and 1599.50 respectively. The resistance is the local high at 1747.77.
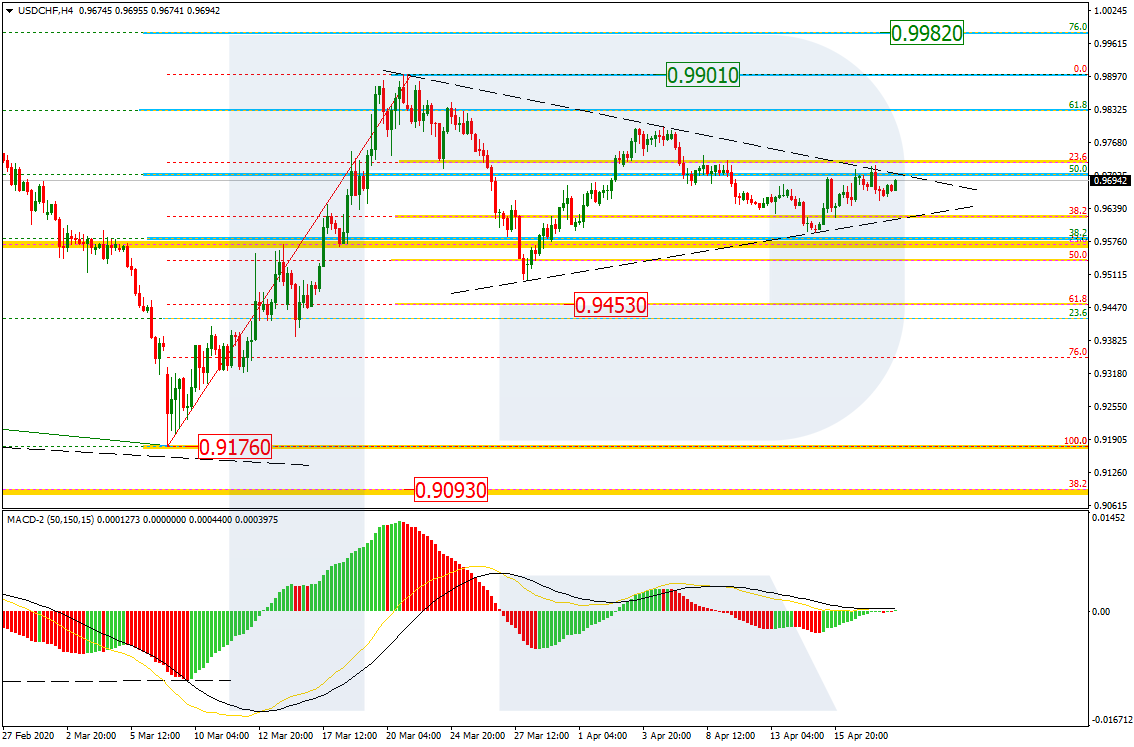
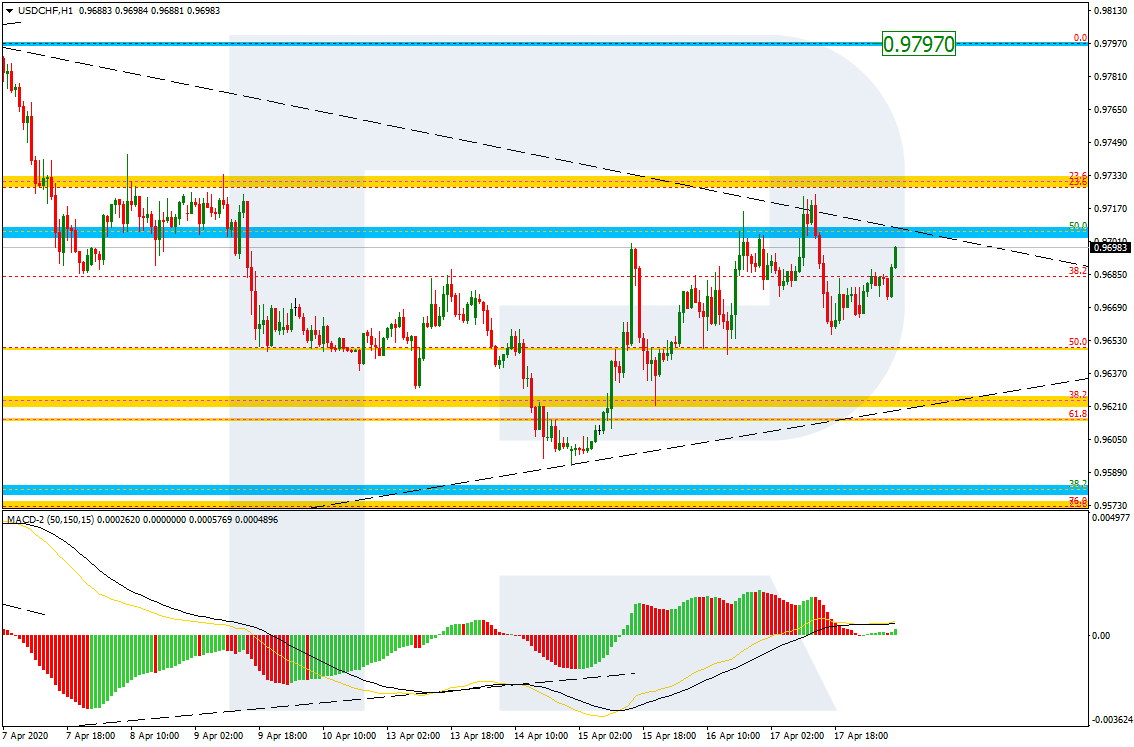
USDCHF, “US Dollar vs Swiss Franc”
As we can see in the H4 chart, the pair continues correcting inside a Triangle pattern. However, the pattern has become so narrow that it can be broken very soon, most likely to the upside. In this case, the price may resume growing to reach its previous high at 0.9901 and then mid-term 76.0% fibo at 0.9982. At the same time, one shouldn’t exclude the possibility that the pattern may be broken to the downside. After that, USDCHF may fall towards 61.8% fibo at 0.9453.
In the H1 chart, the divergence made the pair stop its pullback at 61.8% fibo and start a new growth, which is currently testing the resistance. In case it breaks the level, the instrument may continue trading upwards to reach local high at 0.9797.
Attention! Forecasts presented in this section only reflect the author’s private opinion and should not be considered as guidance for trading. RoboForex LP bears no responsibility for trading results based on trading recommendations described in these analytical reviews.
EURUSD is forming a wide consolidation range around 1.0850. After rebounding from the upside border of the range at 1.0890 and forming another descending impulse towards 1.0858, the price is correcting. Possibly, the pair may grow towards 1.0870 and then move downwards to reach 1.0825. After that, the instrument may start another growth towards 1.0858, thus continuing the consolidation range. If later the price breaks this range to the upside, the market may resume growing to reach 1.0900; if to the downside – form a new descending structure with the target at 1.0750.
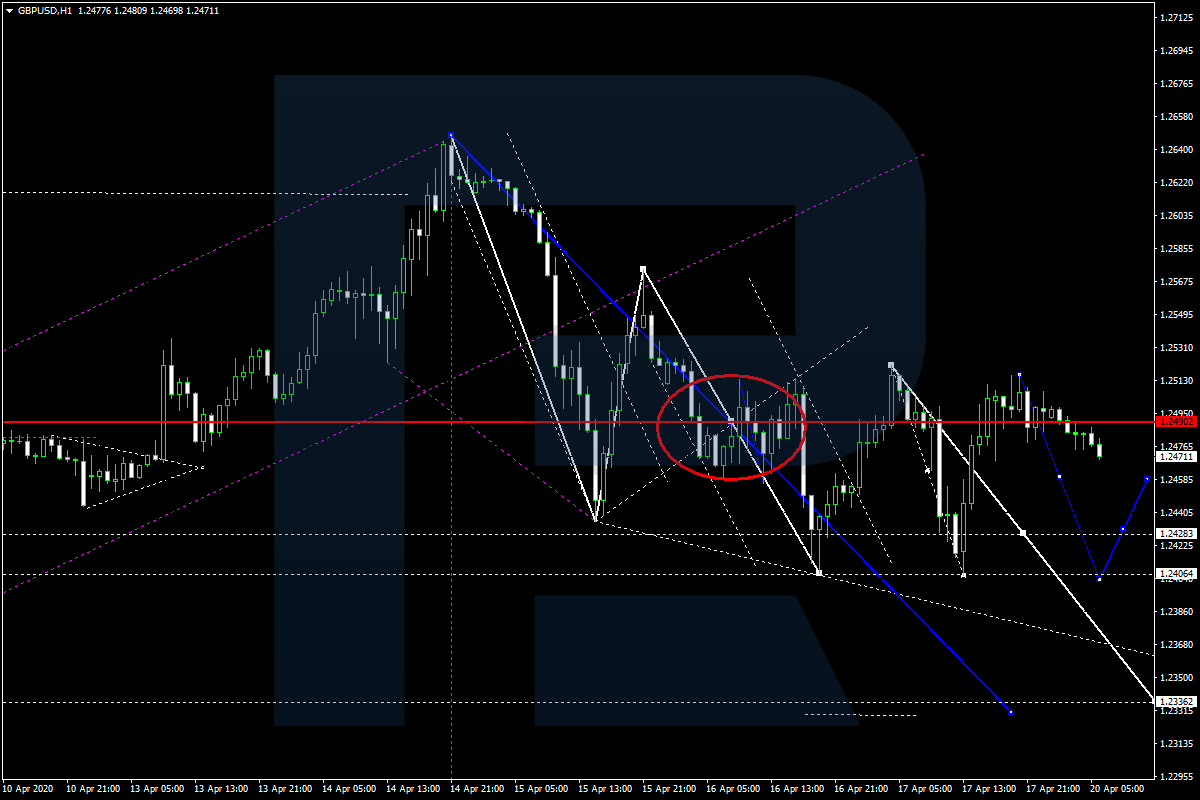
GBPUSD, “Great Britain Pound vs US Dollar”
GBPUSD is consolidating around 1.2490. Possibly, the pair may break 1.2460 to the downside and form a new descending impulse to break 1.2400. After that, the instrument may continue trading downwards with the first target at 1.2340.
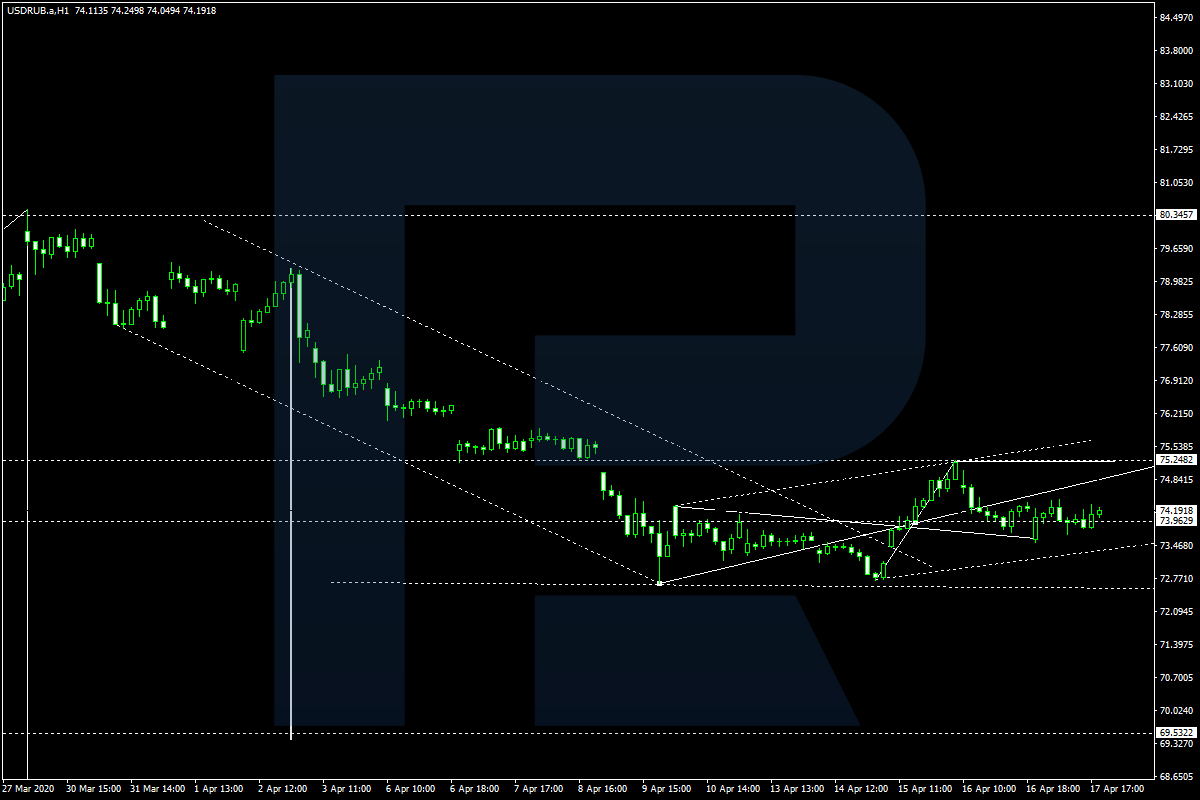
USDRUB, “US Dollar vs Russian Ruble”
USDRUB is still consolidating around 73.90 without any particular direction. According to the main scenario, the price is expected to grow towards 75.25 and then resume trading downwards to break 73.15. Later, the market may continue falling with the short-term target at 70.50.
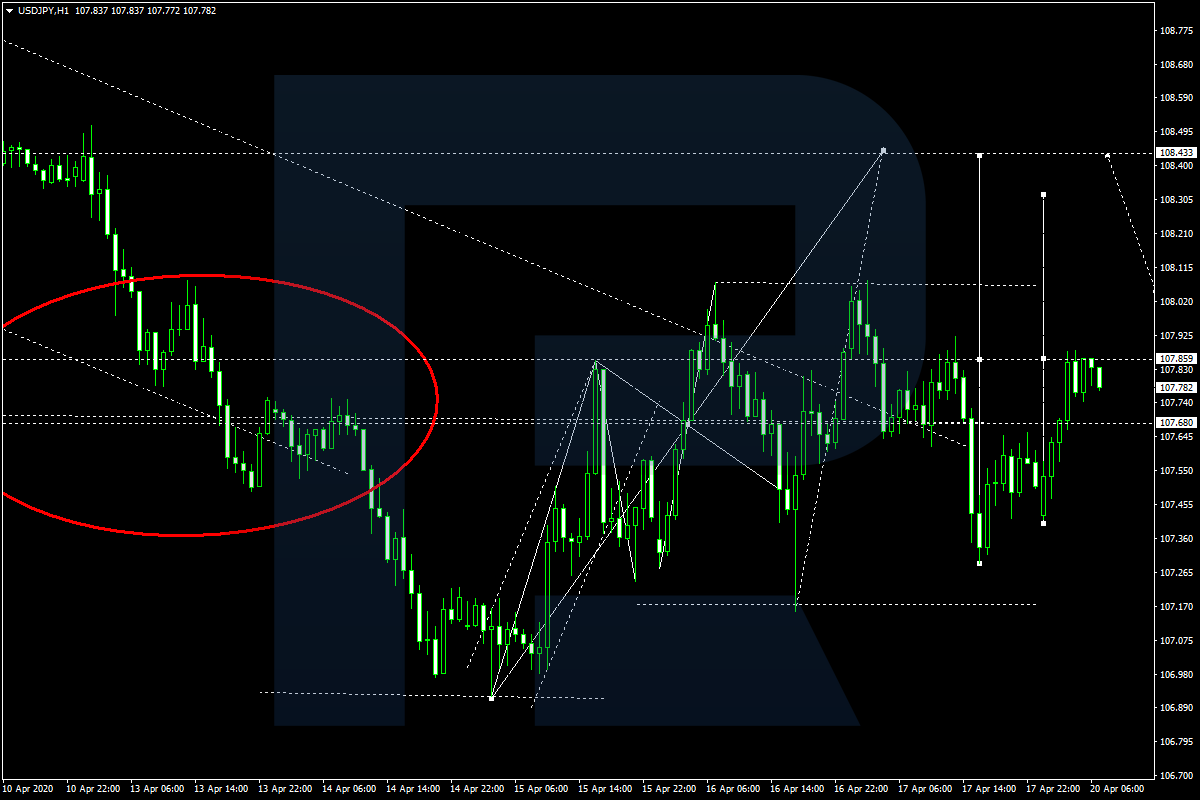
USDJPY, “US Dollar vs Japanese Yen”
USDJPY is consolidating around 107.70. Possibly, today the pair may break 107.86 to the upside grow with the short-term target at 108.31. After that, the instrument may form a new descending structure to return to 107.86 and then start another growth with the first target at 108.44.
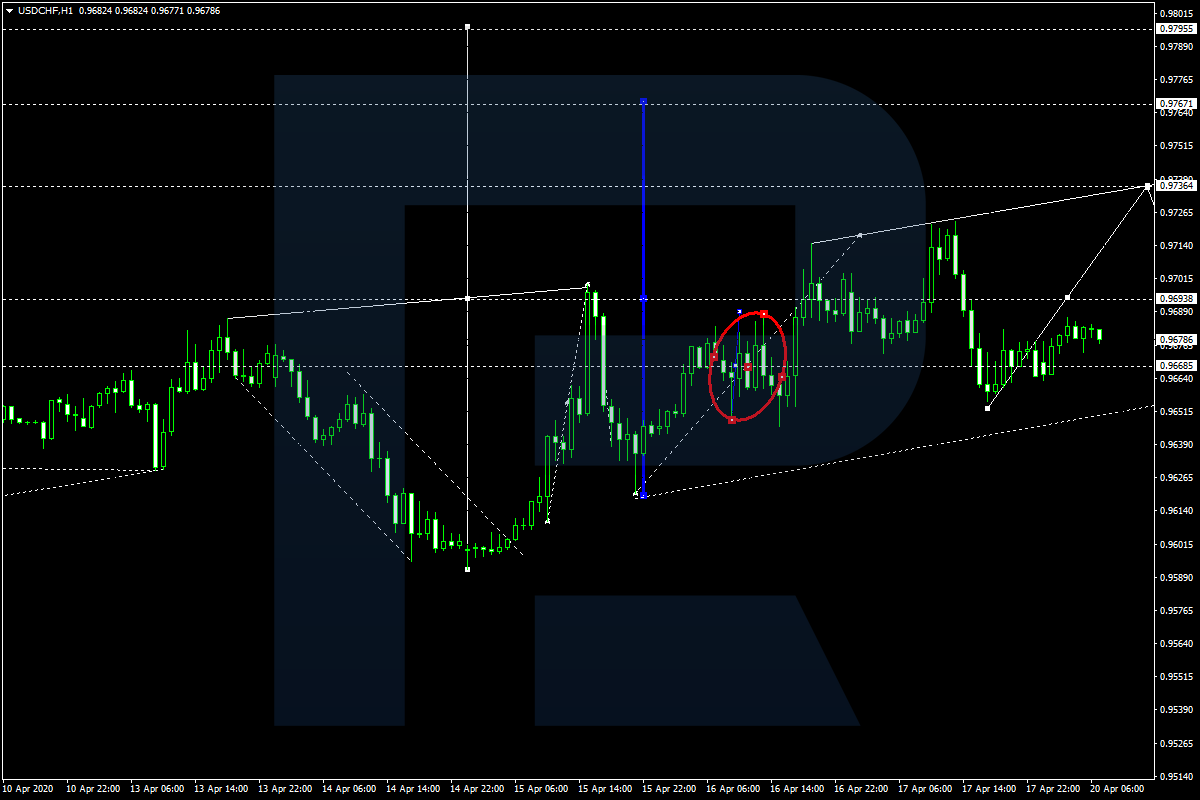
USDCHF, “US Dollar vs Swiss Franc”
USDCHF is consolidating around 0.9668. If later the price breaks this range to the downside at 0.9650, the market may resume trading downwards to reach 0.9633; if to the upside at 0.9690 – start a new growth with the short-term target at 0.9736.
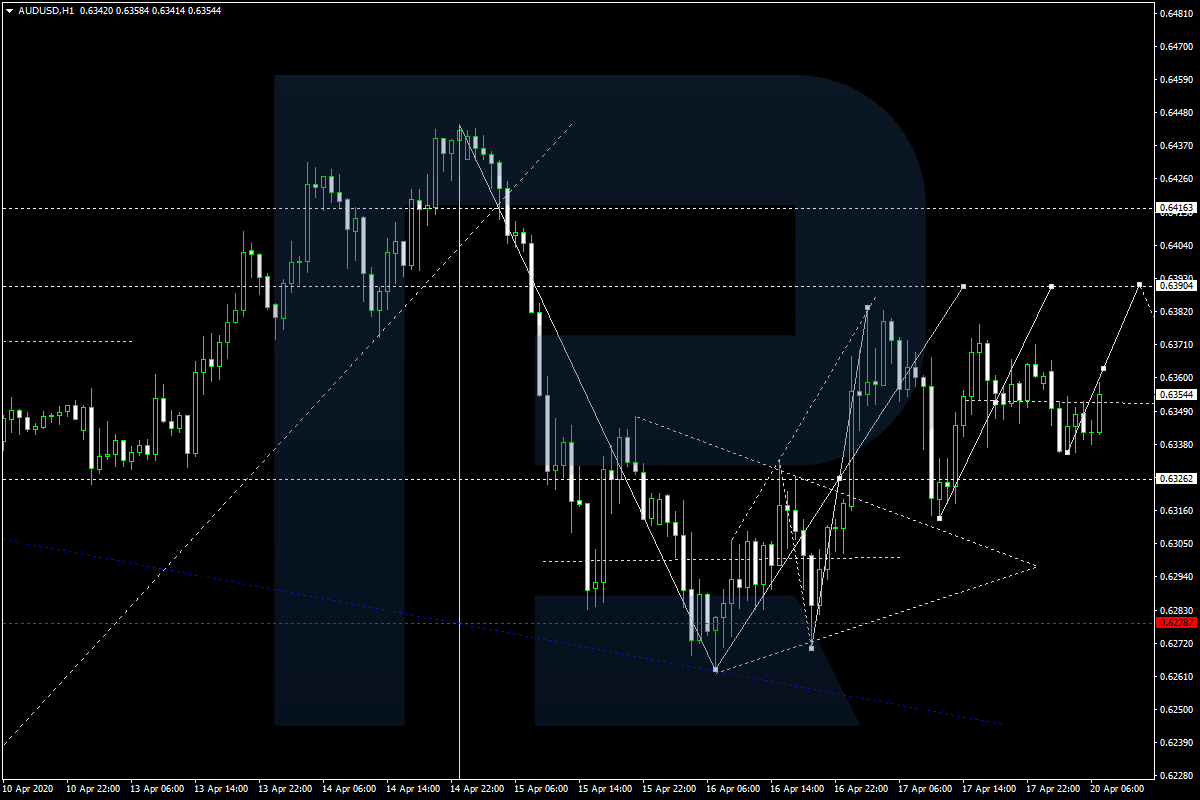
AUDUSD, “Australian Dollar vs US Dollar”
AUDUSD is still consolidating around 0.6330. Today, the pair may form one more ascending structure to break 0.6360 and then continue growing towards 0.6390. Later, the market may resume trading downwards with the target at 0.6330.
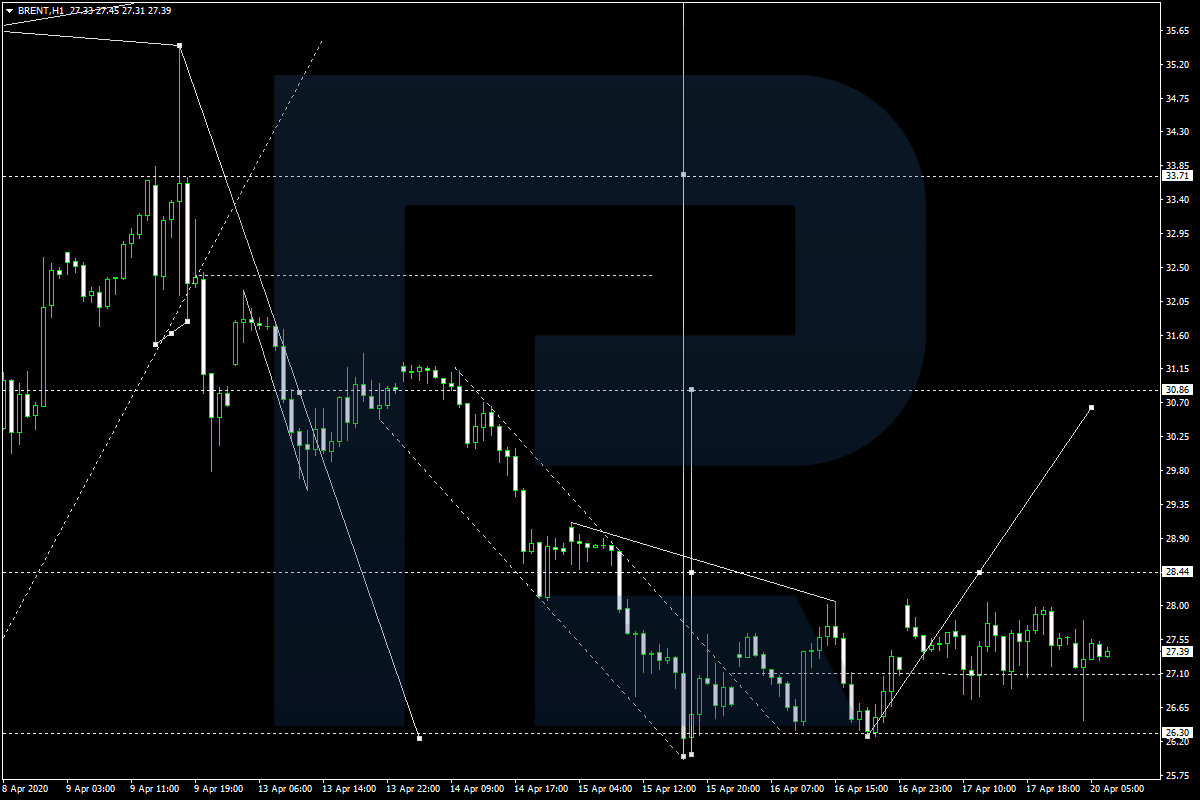
BRENT
Brent is consolidating around 27.00 without any particular direction. Possibly, today the pair may grow towards 28.44. If later the price breaks this level, the market may continue growing with the first target at 30.86. After that, the instrument may correct to reach 28.50..
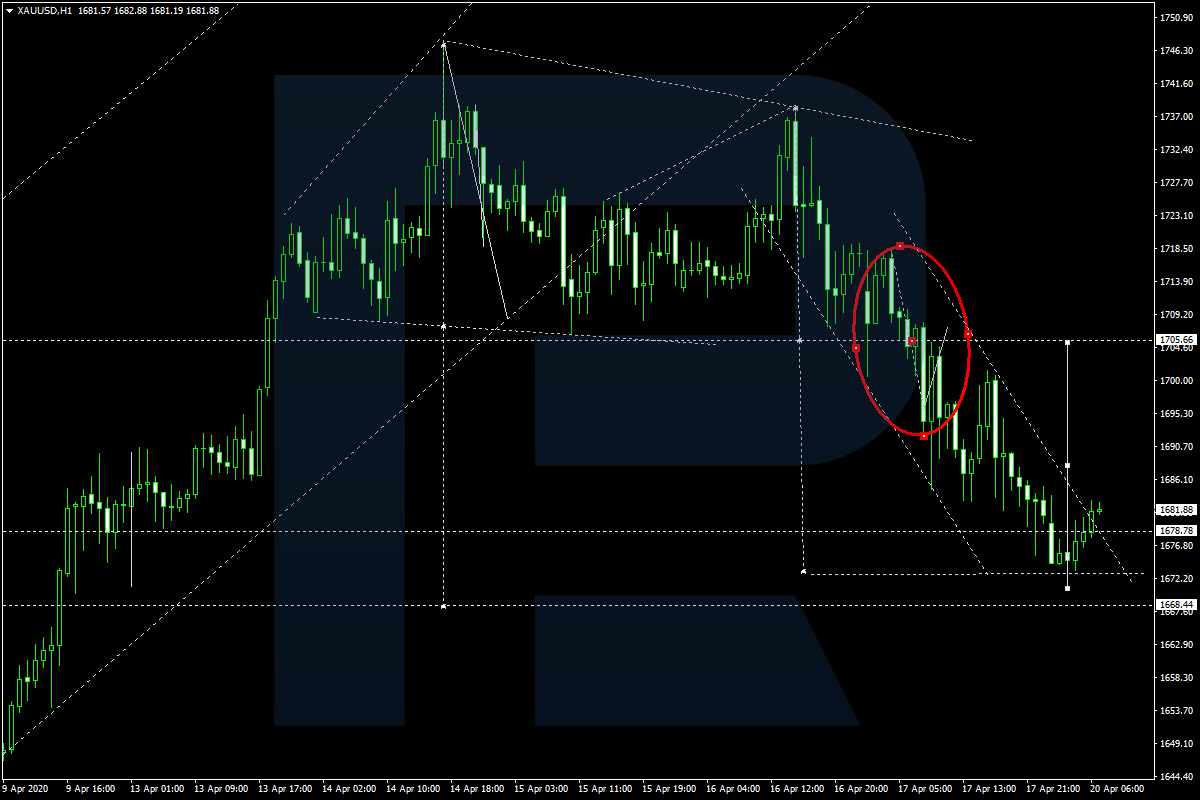
XAUUSD, “Gold vs US Dollar”
After completing the third descending wave at 1671.00, Gold has broken the channel of this wave. Possibly, the pair may correct to the upside and test 1705.25 from below. After that, the instrument may resume trading downwards with the target at 1668.00 at least.
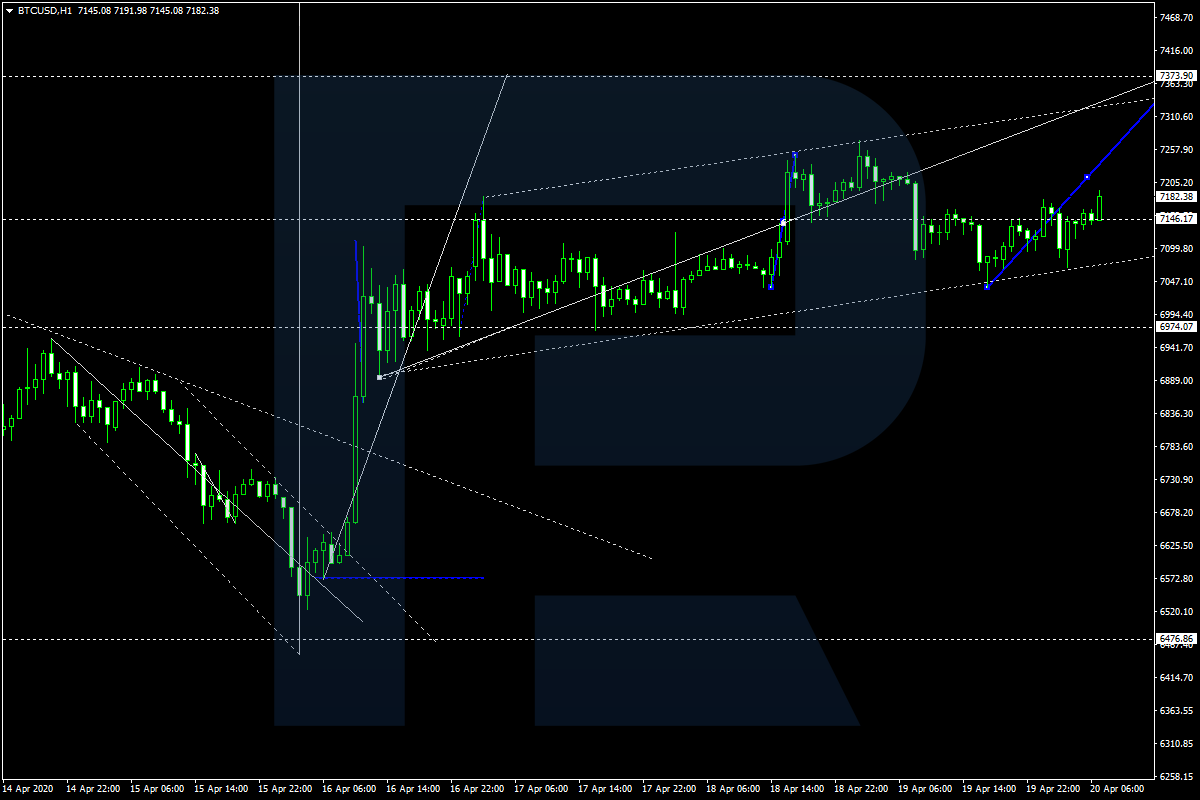
BTCUSD, “Bitcoin vs US Dollar”
BTCUSD continues growing towards 7300.00. Possibly, the pair may reach this level and then start a new correction towards 7000.00. Later, the market may form one more ascending structure with the short-term target at 7500.00.
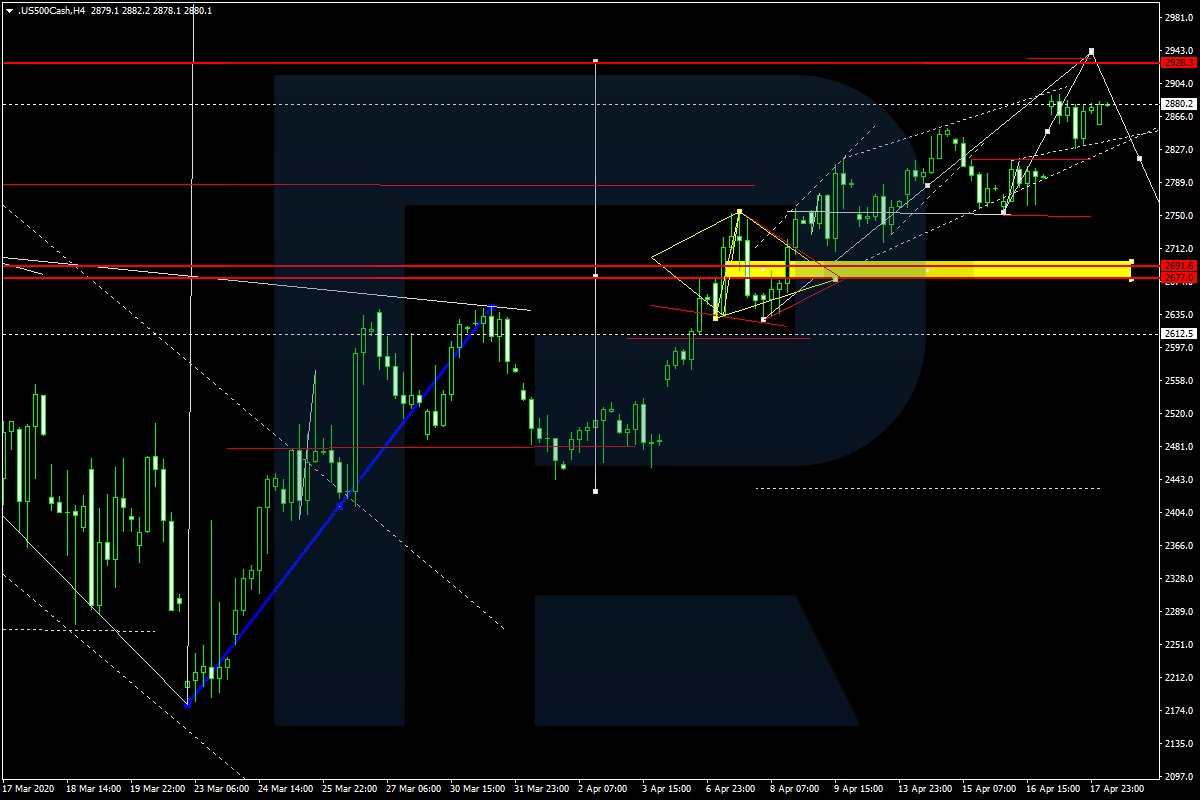
S&P 500
S&P 500 is moving upwards. Possibly, today the par may break 2880.2 and then continue growing to reach 2940.5. Later, the market may start another correction with the target at 2700.7.
Attention! Forecasts presented in this section only reflect the author’s private opinion and should not be considered as guidance for trading. RoboForex LP bears no responsibility for trading results based on trading recommendations described in these analytical reviews.
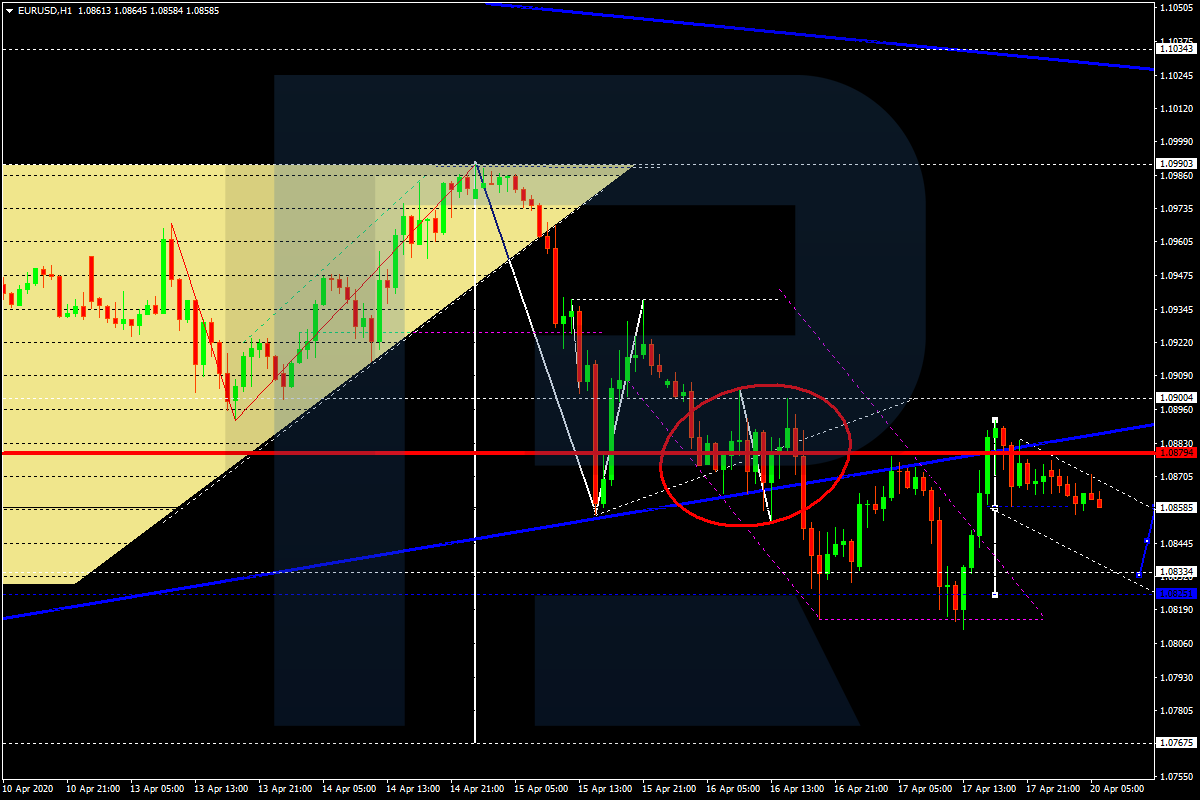
On Monday, April 20th, the major currency pair is slightly falling not far from 1.0868. the coronavirus pandemic and its consequences remain the key trigger for all global financial markets, including both American and European economies.
According to the CFTC (Commodity Futures Trading Commission), earlier hedge funds increased their long positions in the Euro; at the moment, their volume is the biggest over the previous five weeks. The USD can be failed by the rhetoric of US President Donald Trump, who intends to re-open the country’s economy. The plan for relaunching the American economic system, which the White House is currently preparing, implies four weeks of canceled social distancing that significantly hurts both consumers and businesses. However, the country’s states that want to re-open their facilities must show a downward trajectory of coronavirus cases on their territories for at least two weeks in a row. So far, 29 states have qualified, but the numbers may change quickly.
There won’t be a lot of numbers important for EUR/USD this week. The ones that are worth paying attention to are related to the US real estate market: they may show how deep consumers demand and purchasing power plummeted.
In the H4 chart, EUR/USD is moving below 1.0877. in the short-term, the pair is expected to continue trading inside the downtrend towards 1.0750; this movement may be considered as the fifth descending wave. After reaching this level, the price may start a new correction to return to 1.0900. From the technical point of view, this scenario is confirmed by MACD Oscillator: its signal line is moving below 0. Considering that the market may yet continue downtrend, the line also expected to continue moving downwards.
As we can see in the H1 chart, the pair is forming the first descending impulse towards 1.0825. Possibly, today the price may reach this level and then start another correction towards 1.0860. After that, the instrument may form a new descending wave with the short-term target at 1.0785. From the technical point of view, this scenario is confirmed by Stochastic Oscillator: its signal line is moving below 50 and may continue falling to reach 20, thus indicating that the pair may reach the target of the first descending impulse. Later, the line may reverse and move towards 80.
Disclaimer
Any predictions contained herein are based on the authors’ particular opinion. This analysis shall not be treated as trading advice. RoboForex shall not be held liable for the results of the trades arising from relying upon trading recommendations and reviews contained herein.
After the COVID-19 earthquake and a historical contraction, China is rebounding, whereas advanced economies face a depression-like plunge. The consequent tsunami is about to hit Southeast Asia.
As the total number of confirmed cases may exceed 3 million and deaths will surpass 200,000 in a matter of days, the U.S. and Europe account for more than 80% % of both. What was an epidemic in China at the turn of January and February grew into a pandemic in the 1st quarter, thanks to the belated mobilizations in Europe and the US.
As I predicted in a mid-March briefing (TMT, March 23), what is about to follow is the great coronavirus contraction. Its economic impact will be comparable to the 1930s Great Depression. With more data available today, we have a better idea what’s about to happen, despite extraordinary uncertainty.
No country in Southeast Asia will be immune to the impact.
COVID-19 impact on Southeast Asia
In the coming months, emerging and developing economies will seek to cope with the coming economic tsunami. With weaker healthcare systems, the poorest economies, particularly oil and commodity exporters, will take the heaviest hit.
In January, the confirmed cases in the emerging ASEAN economies varied from presumably none in Indonesia to more than 30 in Thailand.
After the 1st quarter, most saw the cases increase by 10, 100, even 1,000 times. And by mid-April, the largest case counts are in the Philippines, Indonesia and Malaysia (5,100-5,700), Thailand and Vietnam (Figure 1).
Figure 1Cumulative confirmed cases in ASEAN-5
Source: WHO data, Difference Group
Size matters. The bigger the country, the greater the potential for broad COVID-19 spread. However, aggregate figures must also be seen relative to the population size (total cases/1m pop). In this view, the COVID-19 impact has been hardest in Malaysia (164), followed by the Philippines, Thailand (40-60), Indonesia and Vietnam (3-23).
To put these numbers in context, let’s recall that in Singapore (1,024) they are almost 10-fold relative to Malaysia; and in the US, twice as high as in Singapore. On the other hand, wealthier economies, such as the US and Singapore, benefit from more advanced healthcare systems.
Another caveat involves the term “confirmed” cases. The more countries test, the accurately the cases will reflect the actual impact. In this view, Malaysia, Vietnam and Thailand have used significantly more tests than the Philippines and Indonesia. Although recently the Philippine test capacity has been improving significantly.
In part, the difference is a matter of population size. The bigger the country (Indonesia, Philippines), the harder it is to test broadly. In part, it is due to the level of economic development. Upper-middle income countries (Malaysia, Thailand) tend to test more than lower-middle-income nations. Yet there are exceptions (Vietnam).
Economic impact on Southeast Asia
As the outbreak has spread, the disruption of supply chains and temporary plant shutdowns, coupled with a sudden full stop in global demand, weigh heavily on those ASEAN economies that still hope to rely mainly on export-led growth.
As Vietnam, as well as Singapore and Malaysia, have discovered, two years of trade wars and a few months of a global pandemic can undermine a decade of export recovery. In turn, those countries that depend on both tourism and exports (Vietnam, Singapore, Malaysia) must now cope with longer-term economic malaise.
In emerging economies, healthcare systems lack adequate capacity against the pandemic. If these countries had not implemented quarantines and lockdowns, they would suffer disproportionately from new virus clusters and new virus waves in the future. If they implement quarantines and lockdowns that are not adequately enforced, the net effect will be the same. And when these countries successfully execute effective quarantines, these will severely penalize their economies as domestic consumption and the businesses will take a severe hit.
So, the new baseline scenario is that Indonesia, Philippines and Vietnam will all suffer a severe growth contraction in the 2nd quarter that will cast a long shadow over the year. In Indonesia, the contraction will mean a plunge from 5.0% in 2019 to 0.5% in 2020; in the Philippines, the comparable figures are currently seen as 5.9% and 0.6%, respectively.
Better positioned initially, Vietnam’s GDP growth will fall from 7.0% to 2.7%, if it can minimize the virus impact at home. Philippines could have been better positioned against the crisis, but that advantage was largely lost with the spring 2019 budget debacle (compare my column on TMT, Jan 28, 2019).
Assuming a relatively strong rebound scenario, ASEAN economies could have a V-shaped rebound by 2021, when Indonesia and Philippines could perform better than Vietnam (Figure 2).
Figure 2Expected coronavirus contraction in ASEAN-5
Source: IMF data, Difference Group
However, he current baseline scenario may still prove too optimistic. The challenges in the West could linger over the 3rd quarter, while the devastation in emerging and developing economies could spill over the latter half of the year, with adverse feedback effects. A new virus wave could follow in the fall. Imported infections could accelerate toward fall 2020 and spring 2021.
And as the heavily-indebted advanced economies are now taking record-volumes of new debt to support their economies, they could face new debt crises, which would spill over to poorer countries, through trade, investment, and finance. The resulting financial tightening might undermine current progress in many countries – and so on.
Should any of these scenarios materialize, the kind of strong and broad rebound that many international observers currently expect (or rather, hope) would deteriorate into a weaker and slower, longer-term process.
We can all hope for the best, but it would be very naïve not to prepare for worse.
About the Author:
Dr. Dan Steinbock is an internationally recognized strategist of the multipolar world and the founder of Difference Group. He has served at the India, China and America Institute (USA), Shanghai Institutes for International Studies (China) and the EU Center (Singapore). For more, see https://www.differencegroup.net
A version of the commentary was published by The Manila Times on Apr 20, 2020
Falling producer prices in Germany bearish for EURUSD
Producer prices fell in Germany in March: the producer price index fell 0.8% after 0.4% declined in February, when a 0.7% drop was expected. This is bearish for EURUSD.
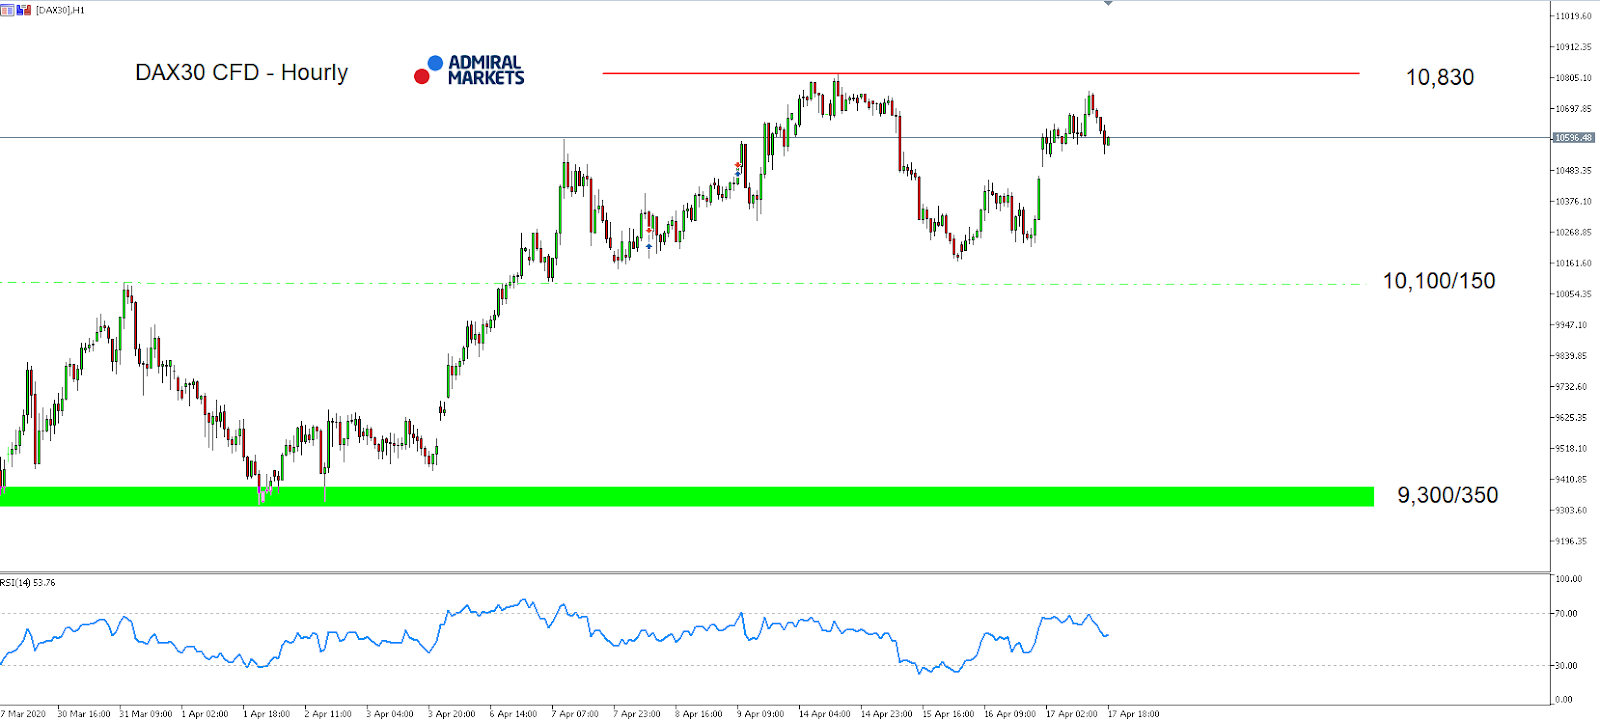
The DAX30 had a solid weekly close, avoiding a drop below 10,000 points. The reason for the gains on Friday was the news that Gilead Sciences is making progress in finding a treatment for Coronavirus patient, reporting that a Chicago hospital treating coronavirus patients with Remdesivir in a trial were recovering rapidly from severe symptoms.
As a secondary driver, there was the market’s hope of a soon coming re-opening of the US economy, fuelled by US president Trump in a Thursday evening speech which put pressure on state governors to end their lockdowns.
In our opinion, traders should be really careful in regard to the sustainability of this move, since “vaccine speculation” could quickly turn out to be a false hope, resulting in a sharp decline in Equities.
However, in the short-term, we technically stay positive as long as the German index holds above 10,300 points, with 10,830 and 11,000 points as targets on the upside.
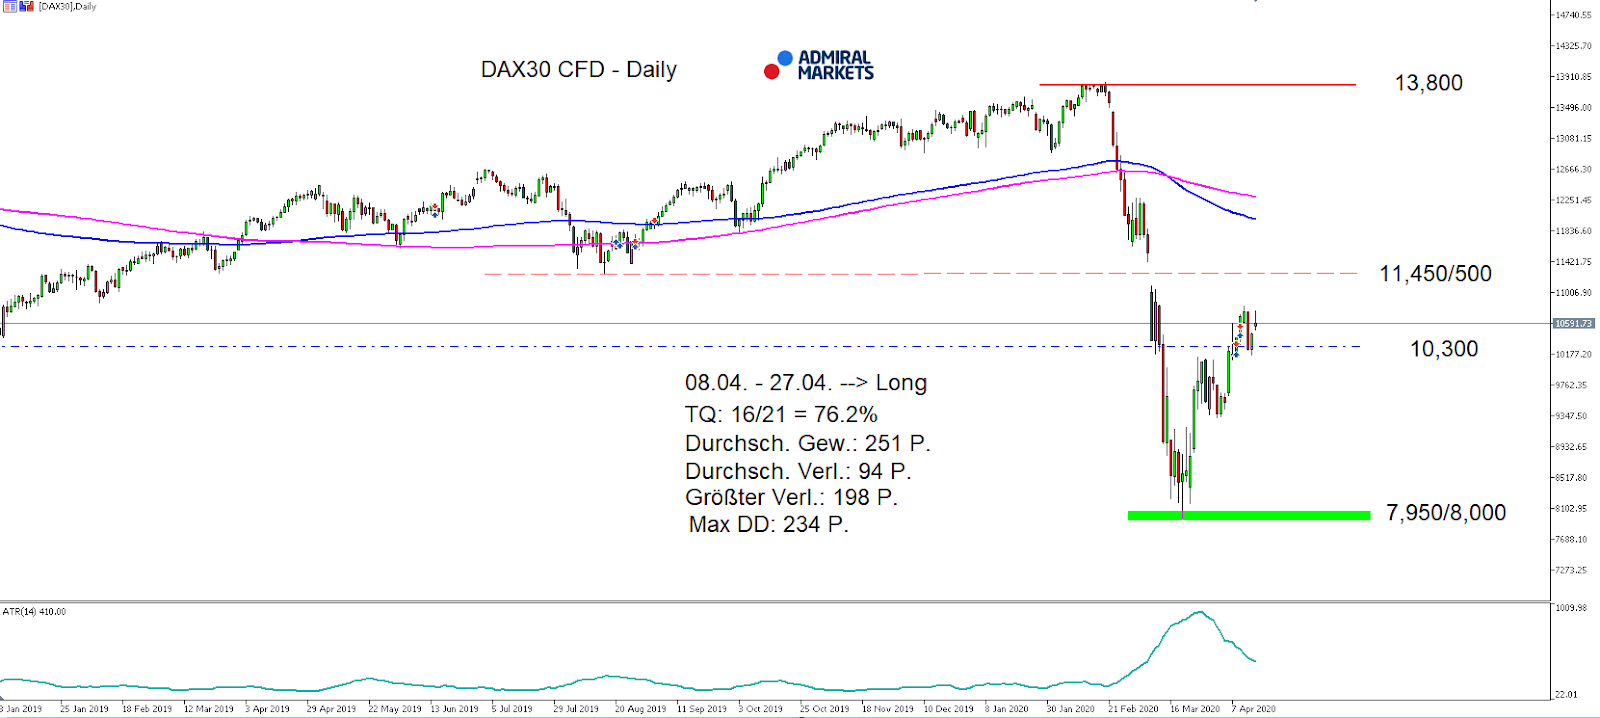
This technical picture also fits into the bullish seasonal window for the DAX30 CFD: between April 8 – 27, the DAX, in 16 of the last 21 years, has gained an average of 250 points while, in the remaining five years, dropping by only 95 points, with a max drawdown of 230 points.
Still, we remain cautious and should we get to see a drop back below 10,300 points, the picture darkens, leaves room for a deep correction and drop back below 10,000 points:
Source: Admiral Markets MT5 with MT5-SE Add-on DAX30 CFD Hourly chart (between March 27, 2020, to April 17, 2020). Accessed: April 17, 2020, at 10:00pm GMT
Source: Admiral Markets MT5 with MT5-SE Add-on DAX30 CFD Daily chart (between January 3, 2019, to April 17, 2020). Accessed: April 17, 2020, at 10:00pm GMT – Please note: Past performance is not a reliable indicator of future results, or future performance.
In 2015, the value of the DAX30 CFD increased by 9.56%, in 2016, it increased by 6.87%, in 2017, it increased by 12.51%, in 2018, it fell by 18.26%, in 2019, it increased by 26.44% meaning that after five years, it was up by 34.2%.
Discover the world’s #1 multi-asset platform
Admiral Markets offers professional traders the ability to trade with a custom, upgraded version of MetaTrader 5, allowing you to experience trading at a significantly higher, more rewarding level. Experience benefits such as the addition of the Market Heat Map, so you can compare various currency pairs to see which ones might be lucrative investments, access real-time trading data, and so much more. Click the banner below to start your FREE download of MT5 Supreme Edition!
Disclaimer: The given data provides additional information regarding all analysis, estimates, prognosis, forecasts or other similar assessments or information (hereinafter “Analysis”) published on the website of Admiral Markets. Before making any investment decisions please pay close attention to the following:
This is a marketing communication. The analysis is published for informative purposes only and are in no way to be construed as investment advice or recommendation. It has not been prepared in accordance with legal requirements designed to promote the independence of investment research, and that it is not subject to any prohibition on dealing ahead of the dissemination of investment research.
Any investment decision is made by each client alone whereas Admiral Markets shall not be responsible for any loss or damage arising from any such decision, whether or not based on the Analysis.
Each of the Analysis is prepared by an independent analyst (Jens Klatt, Professional Trader and Analyst, hereinafter “Author”) based on the Author’s personal estimations.
To ensure that the interests of the clients would be protected and objectivity of the Analysis would not be damaged Admiral Markets has established relevant internal procedures for prevention and management of conflicts of interest.
Whilst every reasonable effort is taken to ensure that all sources of the Analysis are reliable and that all information is presented, as much as possible, in an understandable, timely, precise and complete manner, Admiral Markets does not guarantee the accuracy or completeness of any information contained within the Analysis. The presented figures refer that refer to any past performance is not a reliable indicator of future results.
The contents of the Analysis should not be construed as an express or implied promise, guarantee or implication by Admiral Markets that the client shall profit from the strategies therein or that losses in connection therewith may or shall be limited.
Any kind of previous or modeled performance of financial instruments indicated within the Publication should not be construed as an express or implied promise, guarantee or implication by Admiral Markets for any future performance. The value of the financial instrument may both increase and decrease and the preservation of the asset value is not guaranteed.
The projections included in the Analysis may be subject to additional fees, taxes or other charges, depending on the subject of the Publication. The price list applicable to the services provided by Admiral Markets is publicly available from the website of Admiral Markets.
Leveraged products (including contracts for difference) are speculative in nature and may result in losses or profit. Before you start trading, you should make sure that you understand all the risks.