The sell-off on global stock markets will ease as liquidity measures are rolled out – and some investors will make a fortune from the volatility – affirms the CEO of one of the world’s largest independent financial advisory organizations.
Nigel Green, the chief executive and founder of deVere Group, is speaking out after coronavirus fears triggered the largest one-day fall on many global indices – including the FTSE and the Dow Jones – since the “Black Monday” market crash in 1987.
Mr Green comments: “Global markets were thrown into turmoil Thursday as fear gripped investors over the jump in confirmed coronavirus cases and as governments around the world introduced measures to try and halt the spread, which contributed to the panic.
“All assets – even safe-haven ones such as gold and Treasuries – were being shed in order to shore up cash reserves to meet margin requirements.
“This was a temporary phenomenon.
“Whilst some volatility will remain as no-one can truly know where the bottom is due to the unpredictability of this public health crisis, the global sell-off will ease as central banks roll-out liquidity measures.”
This prediction was also made earlier in the week by the deVere CEO who noted: “Markets are looking for good reason to return to being bullish – which has been their default position for an unusually long time – and actions being taken by central banks could provide just that in days to come.”
He added: “We expect global stock markets to have recovered significantly before the year-end.”
On Friday Asia-Pacific markets staged sharp recoveries, European and U.S. ones are expected to follow suit.
Mr Green observes: “The coronavirus is an unprecedented public health crisis, with many tragic consequences that cannot and should not be underestimated or dismissed.
“It has spooked the markets to historic levels.
“Yet many investors will use the temporary volatility as important buying opportunities, with some set to make a fortune from the turbulence.
“Fluctuations can cause panic-selling and mispricing. Sought-after stocks can then become cheaper, meaning investors can top up their portfolios and/or take advantage of lower entry points. This all typically results in better returns.
“A sensible fund manager will assist investors to seek out the opportunities that turbulence creates and mitigate potential risks as and when they are presented.”
The deVere CEO concludes: “As ever in times of market volatility, many investors will be using the fall-out of the coronavirus outbreak as a chance to generate and build wealth.”
About:
deVere Group is one of the world’s largest independent advisors of specialist global financial solutions to international, local mass affluent, and high-net-worth clients. It has a network of more than 70 offices across the world, over 80,000 clients and $12bn under advisement.
On Thursday, March 12, trading on the euro ended up down. After ECB President Christine Lagarde’s speech, the EURUSD pair fell to 1.1056. Following the meeting, the ECB decided to leave the refinancing rate unchanged at 0.0%. The deposit rate remained at the previous level of -0.5%. The regulator increased its plans for the purchase of government bonds by 120bn. EUR (by the end of the year – not monthly). The press release confirmed that the QE program will work for as long as necessary, and will end shortly before the next rate increase
By the close of the day, the price recovered to 1.1226. Growth was accompanied by a collapse in stock indices. The S&P index fell by almost 10%. During the American session, stock indices looked to gain a boost from the US Federal Reserve announcement, which allocated $1.5 trillion USD to increase liquidity in the financial markets. None of these measures did enough to calm investors.
Today’s news (GMT+3):
15:30 USA: Import Price Index (YoY) (Feb).
17:00 USA: Michigan Consumer Sentiment Index (Mar).
21:00 USA: Baker Hughes US Oil Rig Count.
Current situation:
The EURUSD pair had been floating around within the zone located above the line D4. The collapse of stock indices helped the single currency to make its way out of this zone. At the time of writing, the euro is worth 1.1205.
The coronavirus pandemic continues to gather pace. A significant increase in the number of cases in developed countries serves only to provoke governments to take reactive measures to limit the movement of people and to close various public institutions. Mortality from the total number of infected increased to 3.6%. In Italy, the figure stands at 6.6%. Investors fear a serious recession in the global economy.
Asian stocks traded in the red zone today. Futures on the S&P500 and DJIA rose by 3.9%. It can be assumed that the peak of the “panic” has passed, and European indices will open with growth. On the back of Christine Lagarde’s speech, we can expect the pair to fall back to 1.1120, around the 90th degree.
By TheTechnicalTraders – Has the selloff ended? When will it end? What will the bottom look like and am I at risk of taking further losses? What should I do?
Do you want to take a guess at how many of our friends and family members are calling us over the past week or so asking these questions? Personally, I get bombarded with dozens of emails every day from friends and other family members asking “where’s the bottom? What should I do?”.
This post is going to help you understand the structure of the markets and what is really happening. Price always attempts to seek out new price highs or new price lows. In this case, we are seeking out new price lows with a downside price rotation. Price structure, which is normally discussed in Elliot Wave structures is the process of setting up new higher high or lower low waves as price rotates in a defined wave structure. Keep in mind the broader wave structure that is currently unfolding.
Over the past 16+ months, we’ve suggested that the price rotation in 2018 was a Wave 4 downside price rotation of a Wave C upside price structure. If our analysis is correct, the last rally we just experienced (ending near February 1, 2020) was the end of a Wave 5 upside price move that completed the Wave C upside price structure. This would indicate a very real possibility that the current downside price trend is a Wave 4 downside price move.
Be sure to opt-in to our free market trend signals newsletter before closing this page so you don’t miss our next special report!
For readers that are not familiar with the Elliot Wave process/structure, each major wave (1 through 5 or A through C) can consist of various types of minor wave structures (as you can see from the middle chart in the example above. The major wave 1 could consist of a 5 wave minor wave structure (as shown). The major wave 2 could consist of a 3 wave minor wave structure (as shown) or even a downside 5 wave structure.
Going even further, each of these minor wave structure could consist of even smaller price wave structures. These types of price rotations often populate in 1, 3, 5, 7, 9, 13 and 21 wave structures. Unlocking the major wave count and minor wave count can help us unlock swing trading and day trading opportunities.
So, to put into context what we are attempting to convey to you is that we believe the peak in early February 2020 was the end of a major wave 3 and the start of a major wave 4 (to the downside). Because the upside price wave 3 originated after the 2009-10 price bottom, we believe true support in the markets is likely the midpoint of the 2018 price rotation range or near the low price levels of 2018. These price levels represent a very clear support level and low price target level that continues to follow the price structure rules of Fibonacci and Elliot Wave. If the 2018 lows are breached and the markets continue to push lower, then we fall back to the 2016 price lows and midpoint level.
Weekly YM Chart – DOW JONES
This Weekly YM chart highlights the two lower MAGENTA lines that we believe represent clear price support for the Dow Jones (24,000 & 21,450). At this point, the YM has already moved below the 24,000 level and closed trading on Monday, March 9, near 23,900. Although this price level has breached the 24,000 level, we do not consider “support” a hard level (like concrete). It is like water in many cases and it matters what price does when it reaches this level. If price finds support near this level, it will begin to bottom out and potentially trade sideways before attempting to move higher. If not, the price may stall near this 24,000 level before breaking down to the 21,450 level (or lower).
We do believe the INDU/YM will put in a bottom before the ES and NQ do. Thus, we believe support will be found in the INDU/YM well before support is found in the other major US stock market indexes.
SPY Weekly Chart – S&P 500
This SPY Weekly chart highlights the same setup with the two MAGENTA lines we’ve drawn. The first level of support for SPY is $261~$262. We believe this midpoint of 2018 high to the low trading range will offer a fairly strong support level for the SPY to attempt to set up a price bottom. Below that, the $234 level (the lower range of the 2018 trading year) would provide very clear support for the SPY.
The same type of price theory and expectations are at play on this chart as with the YM chart above. The YM has already reached our first level of support, yet the SPY is still $12 away from this first support level. This would suggest the YM may begin to set up some type of price support while the SPY may continue to trail a bit lower over time.
If this first level of support does not hold, then we would be looking for the 2018 price low levels (near $234) to become the next target for support. Ultimately, the price must either continue to attempt to break previous low price points as it attempts to establish “new price lows” or, at some point, it will fail to break past lows and that is where it will find support. The midpoint, often called the “belt line” (a Japanese Candlestick term) is used by technicians for two reasons: first, it represents 50% of a defined price range and, second, Japanese Candlestick theory teaches us the BeltLine is “the center of control” or price. Once price breaks this level, then further trending may continue.
NQ Weekly Chart – NASDAQ
Lastly, this NQ Weekly chart with the three MAGENTA lines drawn on it. The top line is the 2018 price peak level. The middle line is the midpoint of the 2018 trading range. The lower line is the bottom of the 2018 trading range.
The NQ has been the high-flying sector in the US stock market for many months. You can see the massive rally that took place near the end of 2019 pushing the NQ up to nearly 10,000 before the recent correction. Compared to the YM and SPY charts, it is easy to see the NQ rallied much stronger than the others. This is why we believe the downside price move in the NQ could also be far greater in scope than the YM or SPY.
If the NQ falls to our midpoint level (near 6795), the NQ must call another -1100 points to reach this level. Whereas the YM has already reached this critical price level and the SPY is only about $12 away from that same level. Therefore, the NQ, in our opinion, could continue to trend broadly lower throughout Q1 and possibly into Q2 before finding any real support.
The low price range of 2018 puts final support for the NQ near 5,832. From current levels, if price falls to this support level, it would total an additional -2066 point decline (-26.11%). It would also represent a massive -40% selloff from the peak set in February 2020 (near 9763).
Where’s the bottom? What’s next? Our advice would be NOT to chase this selloff and NOT to attempt to bottom pick this move. We believe the Covid-19 virus event will last well past April/May 2020 and we believe both Q1 and Q2 results will be far below expectations. Therefore, we don’t believe any real bottom will setup before May, June or July of 2020 – after Q2 earnings are announced and contingent on the virus event subsiding and earnings starting to recover. Otherwise, we could be “searching for a bottom” for quite a while yet.
Still, massive price rotations are taking place in the major markets and various sectors. If you are a skilled trader and are able to manage risk properly, you should be able to identify multiple opportunities over the next 90+ days for incredible trades. We know we certainly are finding them.
As a technical analysis and trader since 1997, I have been through a few bull/bear market cycles. I believe I have a good pulse on the market and timing key turning points for short-term swing traders.
Visit my ETF Wealth Building Newsletter and if you like what I offer, and ride my coattails as I navigate these financial markets and build wealth while others lose nearly everything they own during the next financial crisis.
With COVID-19 as the leading issue affecting the markets, we want to keep a close eye on consumer sentiment.
This time around we are focusing on the world’s largest economy. But the reasons for caring about consumers apply to pretty much most of the world now that the WHO has declared COVID-19 a pandemic.
The initial concern, which drove the first drop in global capital markets, was the potential impact on supply chains for businesses. The closure of production facilities in the world’s manufacturing area – China – meant that businesses might have increased difficulty in sourcing materials.
For retailers, it meant potentially running out of products. And, for manufacturers, it meant potential production stoppages. However, shortages did not materialize, and over the last couple of weeks, most major companies in the US and Europe have issued updates on their supplies and inventory.
Business Situation vs Consumer Situation
Most businesses issued profit warnings due to foreseen writedowns they’d make during Q1 from COVID-19-related effects. But all clarified that their supply issues were in hand and they had sufficient inventory.
While it might cause some additional stress on some companies’ financials, none said they were experiencing serious difficulties.
If a company has to delay production slightly due to supply issues, it generally isn’t a major concern. After all, you still make the sale, you just make it a little later!
But if consumer sentiment deteriorates, this implies a bigger problem. This is because it means people are less willing to buy. Supply issues can be addressed with alternate sourcing or other internal measures. However, a drop in buying will have a lasting, negative impact on the business sector and the economy as a whole.
Panic into a Recession
With COVID-19 spreading through the US, many worry America will implement economic measures to fight the disease that other countries have already done. That means restricting shopping and entertainment.
This is likely to massively impact consumer sentiment, especially if it leads to panic shopping as it has in Australia, Germany, Italy among others.
People buy what they believe are emergency supplies with what little money they have, leaving aside major purchases. Once they’ve “stocked up” they don’t have any need to buy more. And with consumption failing, businesses have to reduce production.
This scenario is already being considered in the financial sector. We’re seeing mortgage rates going up despite the Fed slashing rates and bond yields falling. This is because lenders are factoring an increased risk of defaults during an upcoming economically stressful period.
What We Are Looking For
Most of the upcoming Michigan Consumer Sentiment survey was carried out ahead of the sudden drop in the stock market. Therefore, we might not see that fully reflected yet.
Current expectations are for it to remain just slightly in expansion territory at 101.2 compared to 101.0 prior. That will probably be the last increase in the upward trend since September of last year.
Projections indicate that Michigan Consumer Expectations may decrease to 89.0 from 92.1. This reflects a negative outlook for the US economy as COVID-19 was already blanketing the news at this point.
The market is likely expecting this figure to underperform, given the recent events.
French CPI isn’t usually one to trade. However, with all the noise surrounding coronavirus, this particular print might be a little more sensitive than usual.
The German CPI, on the other hand, will be one to keep a closer eye on. In case we get a negative print, and the French figures align with that result, then we could see markets falling harder.
French CPI At Better Levels Than the German Rate
The CPI in France increased to 104.55 points in February from 104.54 points in the previous month. The latest numbers are expected to stay in line with the previous readings, at 0.0%.
Interestingly, the strongest ever CPI posted by France was back in Dec 2019.
The CPI in Germany increased to 105.60 points in February from 105.20 points from the previous month. The latest numbers are expected to stay in line with the previous readings as well, at 0.4%.
At the start of the first quarter, the German economy showed signs of an improving economy compared to the last 2 years. Over that period, German indicators showed poor growth and a slowdown in economic activity overall.
Why Are Economists Alarmed?
Coronavirus will have a say in next month’s release as it is affecting most European economies and it’s likely to affect the rates going forward.
On top of that, we’ve seen the prices of oil deteriorating at an extremely alarming rate too. With crude down too, inflation will again be affected in energy terms, at least.
However, for the current estimates, economists are not and cannot rely on forward rates to calculate estimates. They need to look at existing figures. That said, all-item HICP has fallen in January from 1.4% to 1.2% on a year-on-year basis.
A major drop from 1.9% to -0.3% is expected to be seen in energy-related inflation. However, some of this will be offset by the food, alcohol and tobacco-related inflation, and particularly from unprocessed food. This is expected to increase from 2.3% to 2.7% on a year-on-year basis.
When looking at January’s CPI, this came out at -0.7% on a month-on-month basis. Growth is out of the question and the print drifts further away from the 2.0% target the ECB wants to achieve.
Will the EURO be Affected by the CPI Prints?
Well, with the ECB surprising markets, things could take a different turn. While usually, we can expect at least the German CPI to move the markets a bit, on this occasion, perhaps we won’t, despite the environment being more sensitive.
Now imagine though that the numbers come out positive for both Germany and France. Would you attempt to buy against a falling knife?
The current bearish structure on AUDUSD suggests that the cycle-degree correction might not have ended just yet. Wave c, which marks the end of the primary wave ⑤ as well, could slide further down for a fresh low below the 63c. round support (either for a false break or for an extended 5th wave).
When keeping the sharp drop in mind, a range can be expected.
Adding to that the rule of alternation (particularly for multiple degree impulse waves), the decline into intermediate wave (5) then could reinitiate following the breakout of a triangular formation.
Perhaps, this could come in as a standard or a complex zigzag too, as all we need is a longer sideways market when compared to minor wave 2.
Judging by the structure, however, it is possible than the latest decline is part of a zigzag correction. This intermediate degree alternative, of course, suggests that we’ve marked a multiyear support at the pin bar low and prices are now reversing up.
With primary wave ① completed, the current formation indicates than we’re likely to see a bounce at some level near the 63,43c. level. This is the 90% Fibonacci retracement and could be the last sign bulls can expect.
Should we see a bounce anywhere above the previous low (but not at the previous low), then this will likely shoot higher to fresh multiweek highs. The primary wave ③ will cross above ①, unless if a more complex corrective structure invalidates both scenarios analyzed here.
Crude oil prices have remained under pressure this week in response to the latest data from the Energy Information Administration.
The data showed a further rise in US crude stores. The report covering the week ending March 6th showed that US crude stores jumped by 7.7 million barrels.
This latest inventory increase came above the expected 2.3 million barrel increase and casts further concern over the global oil demand environment.
However, the report was not totally bearish. The EIA reported a 5 million barrel drop in gasoline inventories, outstripping expectations of a 2.5 million barrel drop. Distillate stockpiles were also lower by 6.4 million barrels, versus an expected drop of 1.9 million barrels.
EIA Slashes Demand Outlook
Along with the latest build in US crude stores, the EIA has also slashed its global oil demand projections.
The administration now forecasts global oil demand to decrease by 910k barrels per day over Q1 and by 6660k barrels per day over the year.
The EIA cited the global impact of the ongoing coronavirus outbreak which is threatening to push the global economy into a recession. In the US, forecasts indicate that demand will fall by 350k barrels per day over Q1, a further reduction from the prior 260k barrel per day forecast.
Russia & Saudi Arabia Clash
Crude prices have also come under pressure from the tensions between Russia and Saudi Arabia over crude production levels.
Russia refused to join OPEC in increasing its oil production cuts. In response, Saudi Arabia announced that it will now massively increase its oil production in a bid to force Russia to agree to step up production cuts or risk a further collapse in oil prices.
This latest development highlights the growing concern around the fall in oil prices. Crude prices are now down by nearly 50% since the start of the year.
Technical Perspective
The technical picture in Crude at the moment is currently best viewed on the higher timeframes where you can clearly see the extent of the collapse in prices this year.
Following the gap lower at the start of the week, price traded as low as 27.41, just ahead of testing the 26.21 2016 lows. Price has so far recovered to 33.19 last. However, while price remains below the 42.40 broken support, further downside looks likely.
EURUSD is trading rather flat with the previous session’s volatility easing. This comes ahead of today’s ECB monetary policy meeting. As investors await the ECB’s announcement of easing measures, the downside pressure on the euro could build up.
Price action is currently near the 1.1300 handle. But there is scope for a decline to 1.1200 level. In the near term, we could expect this range to hold. But a lot will depend on how investors react to the ECB meeting today.
Sterling Unmoved by BoE Rate Cut
The pound sterling did not react much, losing just 0.29% intraday. Price action briefly tested the 1.2960 level to establish resistance. Following this, GBPUSD fell to the lower support at 1.2860. The declines will only be accelerating on a break down below this level. Otherwise, we expect GBPUSD to move sideways within the said levels.
Will Crude Oil Resume Declines?
Oil prices are reversing the gains from Tuesday as prices remain weak. This comes amid developing fundamentals especially with talks between Russia and Saudi Arabia.
The Stochastics oscillator remains somewhat poised to the downside. This will potentially form a bearish flat pattern on the oil charts. The support level at 28.00 will be critical in this scenario. For now, the upside is capped at 35.00.
Can XAUUSD Close Below the 1655 Handle?
Gold prices attempted a rally earlier on Wednesday only to give up those gains. But price action is trading below the 1655 handle for the moment. A convincing close below this level is required, for now, to create the downside bias. The next support is at 1631 handle.
We expect gold prices to remain muted in the run-up to the ECB meeting. The direction in the prices could likely be set following the outcome of the monetary policy meeting.
By OilPrice.com – If it’s not green, it’s not millennial–and that’s a big problem for a company like Uber, or Lyft. Millennials love ride-sharing, but they don’t appreciate the CO2 footprint that comes with it.
The immediate problem for Uber is this: The next-generation of ride-sharing is already here–born out of massive millennial demand. It’s green through and through, and it’s set to command some serious market share.
Millennials are driving a new mega-trend: impact-investing. Facedrive, the first ride-sharing company that lets you plant a tree while you drive, and choose exactly what kind of footprint you want to leave behind, is leading this new trend.
“It’s not just that millennials, and younger generations in general, are increasingly opting out of the expenses and hassles of owning and parking a car,” Facedrive CEO Sayan Navaratnam told Oilprice.com in a recent interview. “It’s phenomenally bigger than that: Millennials demand more conveniences, and they demand that they be green. We are giving them that before anyone else does.”
This Trend Is Already Mega
The biggest disruption in the world right now–outside of the coronavirus–is that major hedge funds are giving in to the pressure and moving money into things that are environmentally and socially responsible.
This is an ethics squeeze worth billions.
Jeff Bezos, the richest man on the planet, just committed a whopping $10 billion to a Global Earth Fund.
Larry Fink, the CEO of BlackRock–one of the world’s largest hedge funds, told CEOs around the world last month that climate change has become a “defining factor in companies’ long-term prospects”.
That, he said, would lead to a significant reallocation of capital–and it’s going to happen a lot sooner than anyone previously expected.
He’s far from alone.
“For the first time since WWII we sense a shift in which climate and the environment — not growth — will become the priority of governments and their citizens, as shortages of food, clean water and air become existential questions,” Saxo Bank Chief Economist Steen Jakobsen said in his latest quarterly outlook report.
Green stocks are set to eclipse the current technology monopolies, and even the world’s top oil traders are going green.
Last year alone, 479 green bonds were issued globally–a 25% increase over 2018. And 2020 is going to be a “bumper” year for green, according to Linklaters.
While this revolution in investing that is changing everything may seem sudden–it’s not. We can track its acceleration over the years and its path to becoming a mega-trend by 2019-2020.
“We’re all about grabbing onto the biggest trends in tech before they’re mega-trends. So that takes us back to 2016, when we first came up with the idea. Whenever a major new trend emerges, it’s the job of the truly innovative to step back and say ‘OK, this is an explosively great idea – so what’s wrong with it?’ When you figure that out, and you’ve got the right network and the right people behind you, you can jump in on one of the biggest trends and disrupt a massive market at exactly the right time,” Navaratnam said.
One problem for Uber was timing: This great idea emerged simultaneously with environmentally friendly investing, and both became more than passing fads but they haven’t quite kept step with one another.
It’s all about choice these days, and the disruption here is Facedrive’s offer of choice to the customer, who can seamlessly choose whether they want an EV or a hybrid, rather than a conventional car. And even if they choose conventional, they’re still making a green choice because the CO2 is being offset for them.
That’s a millennial must.
It’s also an investor must that’s attracting some huge names.
The drive for lower emissions has sparked the interest of commercial global mega-banks. Scotia Bank has already pledged over $100 billion to lower carbon emissions TD bank has also pledged billions. As larger more forward-thinking firms want to be associated with the ride-sharing company that has finally understood the market.
Nor has it gone unnoticed by celebrities, including Will Smith and Jada Pinkett Smith. Facedrive has invested in the celebrity couple’s WestBrook Global Inc., which gives them access not only to content distribution monetization on the side, but also to some 120 million additional social media followers.
The Green Ride of a Lifetime
The biggest negative impact associated with the explosive popularity of ride-hailing is pollution.
A recent study by the Union of Concerned Scientists estimates that the average (U.S.) ride-hailing trip results in 69% more pollution than whatever transportation option it displaced.
That’s a huge number, that scientists estimate is actually higher in densely populated areas. In this age of green investing, this is data that millennials find hard to swallow.
But now, they don’t have to. Now they can plant a tree every time they take a ride.
Facedrive ride-hailing offsets any CO2 emissions, and for the very first time in ride-sharing history, gives customers the choice to be even more environmentally conscious.
This is innovative, state-of-the-art, technology. FD’s in-app algorithm calculates estimated CO2 emissions for each car journey and allocates an equivalent monetary value to the local organizations to plant trees. They have partnered with Forest Ontario and have planted over 3,500 trees last year in their soft launch phase.
Facedrive allows its riders to choose between EVs, hybrids and traditional cars. It’s a choice no one’s ever given to consumers, and it means that it pleases everyone. For all those riders who are fine with the conventional, Facedrive is by no means sidelining them. They’re just offsetting the related emissions.
And it also resonates with the wallet because riders aren’t paying a premium for offsetting.
Local communities will also reap the benefits, which means that officialdom should be solidly on board.
Millennials Win Ride-Hailing Battle for Supremacy
The ride-sharing giants have been pushing for diversification with hefty bets on food and grocery delivery, scooter and bike rentals and even a proto-bank like Uber Money. Facedrive, too, is pushing diversification from the starting gate, with green delivery services.
But what the giants have ignored is environmental pressure–and that’s exactly where this battle for supremacy could be decided.
Millennial investors are nearly twice as likely to invest in companies or funds that target specific social or environmental outcomes.
And now, comes the next push, as Facedrive slides things into fifth gear by expanding into the U.S. and European markets in Q3-Q4 of 2020.
Ride-sharing has already been overwhelmingly sold to the public. That means that the next-gen, green version of this $235-billion global business doesn’t have to fork over a ton of capital to convince the market. They don’t have to pile on losses and some day hope for profitability. They just have to be green.
It’s Uber. Just better for the environment. And it’s exactly what millennials want.
Other tech companies poised to ride the ride-share boom:
Uber Technologies Inc. (NYSE: UBER)
The big story in tech last year was the Uber IPO—the ride-sharing app joined the market with a tepid showing, and it hasn’t done much business since.
It’s the cherry on top of a cake of trouble for the revolutionary tech company, which has suffered from a mountain of bad press. It’s controversial CEO Travis Kalanick was forced out over his behavior and the company’s struggle to generate revenue, but the new management hasn’t been able to do much better.
Uber keeps burning through money: in Q2 of 2019 it posted a $5 billion operating loss, linked in part to the expensive IPO.
Bears have been circling the wagons for a while, warning the Uber’s ration is unsustainable. But bulls have been quick to point out how other revolutionary tech companies like Amazon and Facebook posted losses after their IPOs, before going on to become fabulously profitable.
Plus, Uber’s losses are linked to its IPO and its rapid expansion rate: once the company solidifies its dominance of ride-sharing and makes inroads to self-driving cars, Uber’s profits are likely to prove sturdy.
Moreover, while $5 billion sounds like a lot, it pales in comparison with what other big companies have suffered through—GM posted $48 billion loss in 2009, and it’s held on despite it.
Lyft (NASDAQ:LYFT)
Lyft may be a bit overvalued, but it’s still sustainable.
Lyft went public in March for $87.24 and hit $88.60 on the first day of trading.
It’s shed over half that and has been treading water ever since. Lyft’s next earnings report is due on October 30th.
But $36 makes this a cheap stock for a ride-sharing market that’s killing taxi cabs and cutting in on car sales, too.
Right now, Lyft is valued at 4x its sales, and it’s still losing money—like Uber. But it does have over $3 billion in cash, and it is investing in micro-mobility, too, through bike-sharing startups.
General Motors (NYSE:GM) has created its own brand of electric bikes, called Ariv. The bikes were just launched this year, but have already captured the attention of the European market.
While they err on the side of pricey, coming in at $3,800 per unit, they do boast a high top speed and can travel a modest distance on a single charge.
The kicker for many, however, is that they can fold into an easily carriable pack, making them the perfect choice for a lot of commuters. Especially in big cities like London or Berlin.
Ford (NYSE:F) is taking a different approach. It’s swooped right into the scooter market, buying Spin for a clean $100 million.
Initially deployed in San Francisco back in 2017, Spin is widely considered to be a part of the Big Three of the scooter world, along with Lime and Bird.
While Ford’s buyout of Spin made headlines, it’s certainly not the first urban transportation alternative Ford’s sunk its teeth into.
In recent years, Ford also bought commuter shuttle service Chariot, Autonomic and TransLoc, aiming to ensure that it does not miss the boat as this new movement accelerates.
BAIDU (NYSE:BIDU), for its part, is taking on the automated car market. With more miles under its belt than any of its competitors in Beijing, it’s an easy choice for a number of investors.
Likewise, it has an equally large portfolio of innovative new technology…at a lower entry point than its competitors.
As the ‘Chinese Google,’ Baidu is following a similar path to its American counterpart. It began as a search engine but is quickly expanding into almost all things tech related.
From artificial intelligence to television and finance, Baidu’s ever-expanding reach is a not to be ignored. Especially for investors looking to stay on top of the new tech trends.
By. Charles Kennedy
**IMPORTANT! BY READING OUR CONTENT YOU EXPLICITLY AGREE TO THE FOLLOWING. PLEASE READ CAREFULLY**
Forward-Looking Statements
This publication contains forward-looking information which is subject to a variety of risks and uncertainties and other factors that could cause actual events or results to differ from those projected in the forward-looking statements. Forward looking statements in this publication include that the demand for ride sharing services will grow; that the demand for environmentally conscientious ride sharing services companies in particular will grow; that Facedrive will be able to fund its capital requirements in the near term and long term; and that Facedrive will be able to carry out its business plan. These forward-looking statements are subject to a variety of risks and uncertainties and other factors that could cause actual events or results to differ materially from those projected in the forward-looking information. Risks that could change or prevent these statements from coming to fruition include changing governmental laws and policies; the company’s ability to obtain and retain necessary licensing in each geographical area in which it operates; the success of the company’s expansion activities; the ability of the company to attract a sufficient number of drivers to meet the demands of customer riders; the ability of the company to attract drivers who have electric vehicles and hybrid cars; the ability of the company to keep operating costs and customer charges competitive with other ride-hailing companies; and the company’s ability to continue agreements on affordable terms with existing or new tree planting enterprises. The forward-looking information contained herein is given as of the date hereof and we assume no responsibility to update or revise such information to reflect new events or circumstances, except as required by law.
DISCLAIMERS
ADVERTISEMENT. This communication is not a recommendation to buy or sell securities. An affiliated company of Oilprice.com, Advanced Media Solutions Ltd, and their owners, managers, employees, and assigns (collectively “the Company”) has signed an agreement to be paid in shares to provide services to expand ridership and attract drivers in certain jurisdictions outside Canada and the United States. In addition, the owner of Oilprice.com has acquired additional shares of FaceDrive (TSX:FD.V) for personal investment. This compensation and share acquisition resulting in the beneficial owner of the Company having a major share position in FD.V is a major conflict with our ability to be unbiased, more specifically:
This communication is for entertainment purposes only. Never invest purely based on our communication. Therefore, this communication should be viewed as a commercial advertisement only. We have not investigated the background of the featured company. Frequently companies profiled in our alerts experience a large increase in volume and share price during the course of investor awareness marketing, which often end as soon as the investor awareness marketing ceases. The information in our communications and on our website has not been independently verified and is not guaranteed to be correct.
SHARE OWNERSHIP. The owner of Oilprice.com owns shares of this featured company and therefore has a substantial incentive to see the featured company’s stock perform well. The owner of Oilprice.com will not notify the market when it decides to buy more or sell shares of this issuer in the market. The owner of Oilprice.com will be buying and selling shares of this issuer for its own profit. This is why we stress that you conduct extensive due diligence as well as seek the advice of your financial advisor or a registered broker-dealer before investing in any securities.
NOT AN INVESTMENT ADVISOR. The Company is not registered or licensed by any governing body in any jurisdiction to give investing advice or provide investment recommendation. ALWAYS DO YOUR OWN RESEARCH and consult with a licensed investment professional before making an investment. This communication should not be used as a basis for making any investment.
RISK OF INVESTING. Investing is inherently risky. Don’t trade with money you can’t afford to lose. This is neither a solicitation nor an offer to Buy/Sell securities. No representation is being made that any stock acquisition will or is likely to achieve profits.
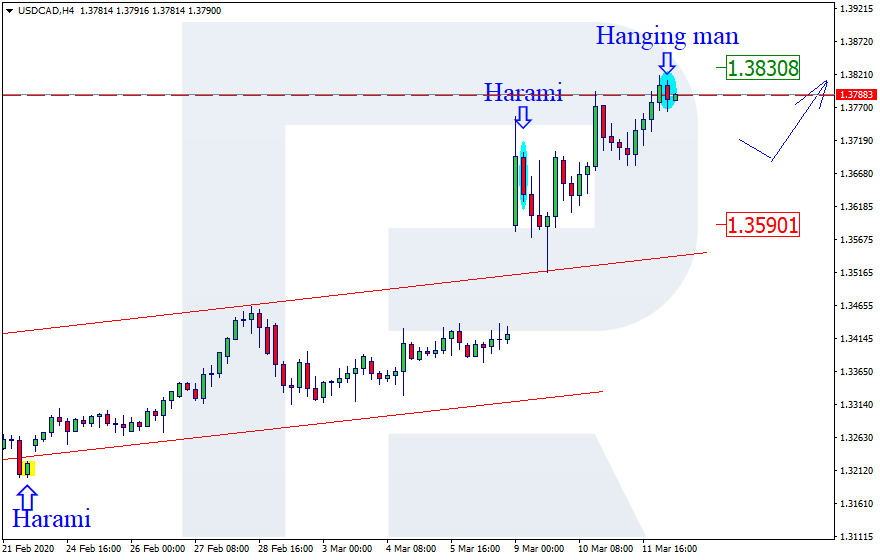
As we can see in the H4 chart, after finishing a Hanging Man pattern near the resistance level, USDCAD continues growing and updating its highs. Right now, the pair may start reversing; the downside target is at 1.3590. The current situation implies that after completing a pullback the price may resume growing towards 1.3830. At the same time, one shouldn’t exclude an opposite scenario, according to which the instrument may continue growing without forming a correction towards 1.3590.
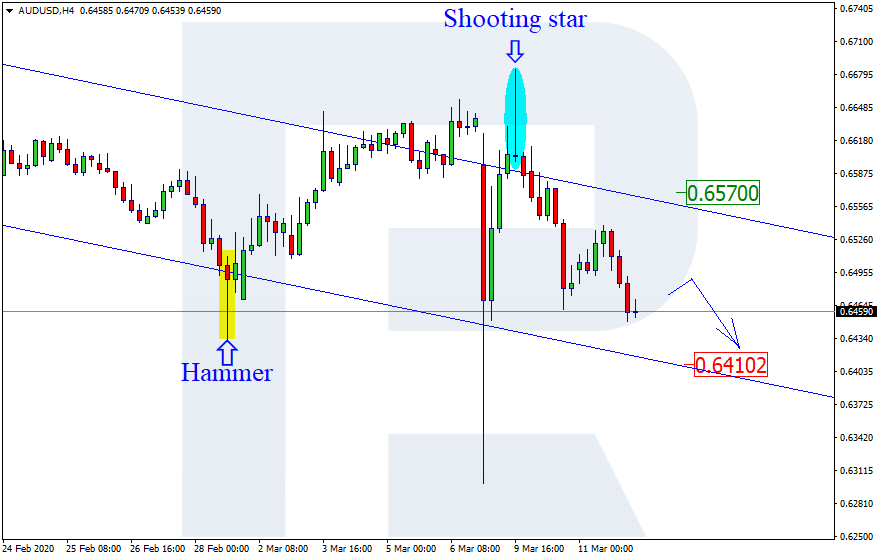
AUDUSD, “Australian Dollar vs US Dollar”
As we can see in the H4 chart, the pair continues the descending tendency. After completing a Shooting Star reversal pattern near the channel’s upside border, AUDUSD is still reversing. Later, the price may complete a correction and resume trading downwards to reach the channel’s downside border at 0.6410. Still, the instrument may choose a different scenario and continue falling without any corrections. A rebound from the current level is a less probable scenario, but it may happen. In this case, the target will be at 0.6570.
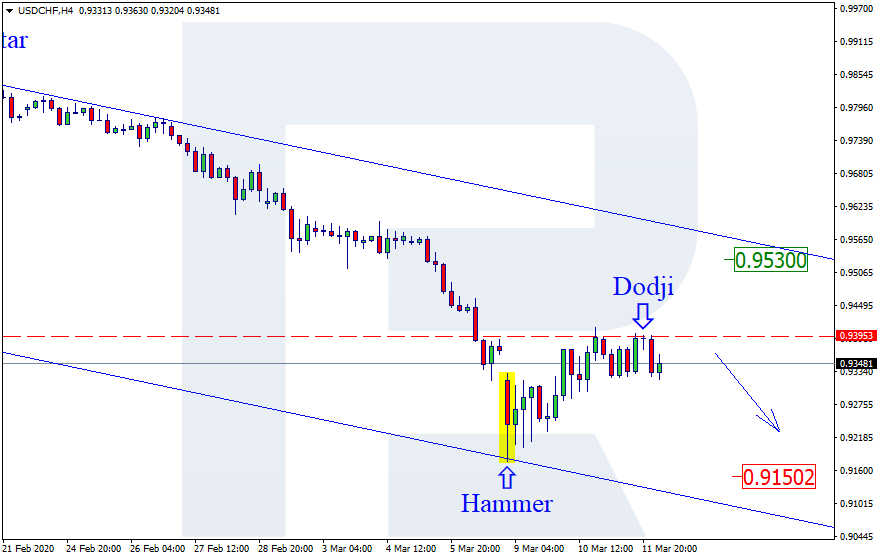
USDCHF, “US Dollar vs Swiss Franc”
As we can see in the H4 chart, the descending tendency continues. By now, USDCHF has reversed after forming a Hammer reversal pattern and formed several more reversal patterns near the resistance level, including Doji. The current situation suggests that the pair may reverse and then continue the descending tendency with the target at 0.9150. However, one shouldn’t ignore another scenario, according to which the instrument may return to 0.9530.
Attention! Forecasts presented in this section only reflect the author’s private opinion and should not be considered as guidance for trading. RoboForex LP bears no responsibility for trading results based on trading recommendations described in these analytical reviews.
 Current situation: