Author Archive for InvestMacro – Page 589

Oil Majors’ Costs Have Risen 66% Since 2011

By OilPrice.com

The oil majors reported poor earnings for the fourth quarter of last year, but many oil executives struck an optimistic tone about the road ahead. Oil prices have stabilized and the cost cutting measures implemented over the past three years should allow companies to turn a profit even though crude trades for about half of what it did back in 2014.

The collapse of oil prices forced the majors to slash spending on exploration, cut employees, defer projects, and look for efficiencies. That allowed them to successfully lower their breakeven price for oil projects. However, some of that could be temporary, with oilfield services companies now demanding higher prices for equipment and drilling jobs, in some cases upping prices by as much as 20 percent. The result could be an uptick in the cost of producing oil for the first time in a few years. Rystad Energy estimated the average shale project could see costs rise by $1.60 per barrel, rising to $36.50.

That does not seem like the end of the world. After all, those breakeven prices are still dramatically lower than what they were back in 2014. In fact, Reuters put together a series of charts depicting the fall in costs for shale production in different parts of the United States. Every major shale basin – the Eagle Ford, the Bakken, the Niobrara, and the Midland and Delaware basins in the Permian – have seen breakeven prices fall by as much as half since 2013. The slight uptick in costs expected in 2017 is a rounding error compared to the reductions over the past half-decade.

But that is just for shale drilling. The oil majors produce most of their oil outside of the shale patch, with much of their output coming from longer-lived projects in deepwater, for example. To be sure, some of the largest oil companies have made some progress in cutting costs over the past few years, but a new report casts doubt on the industry’s track record.

According to new research from Apex Consulting Ltd., the oil majors are still spending more to develop a barrel of oil equivalent than they were before the downturn in prices – in fact, much more. Apex put together a proprietary index that measures cost pressure for the “supermajors” – ExxonMobil, Royal Dutch Shell, Chevron, Eni, Total and ConocoPhillips. Dubbed the “Supermajors’ Cost Index,” Apex concludes that the supermajors spent 66 percent more on development costs in 2015 than they did in 2011, despite the widely-touted “efficiency gains” implemented during the worst of the market slump. It is important to note that this measures “development costs,” and not exploration or operational costs.

However, performances varied by company. Eni, for example, saw its development costs decline by 32 percent between 2011 and 2015, a notable achievement. Chevron and ExxonMobil also posted efficiency gains, although more modest figures than Eni. Chevron’s costs fell 6 percent and Exxon’s were down 5 percent over the five-year period.

At the other end of the spectrum is Royal Dutch Shell, which saw development costs quadruple. ConocoPhillips and BP fared only slightly better, with costs roughly doubling over the timeframe. As a whole, the development costs for the group of “supermajors” rose 66 percent to $18.39 per barrel.

After the collapse of oil prices in 2014, the cost index did decline. Oil producers squeezed their suppliers, streamlined operations, and improved drilling techniques. But costs still stood 66 percent higher than in 2011.

The index points to underlying structural increases in development costs for the broader industry.

At $18 per barrel, the cost figure would seem rather low. But it is important to note that this is just for “development costs,” which represent just over half of a company’s total cost. That figure excludes the cost of exploration as well as funding ongoing operations. So the “breakeven price” so often quoted in the media is actually quite a bit higher. BP, for example, recently admitted that its finances will not breakeven unless oil trades at roughly $60 per barrel.

The supermajors are in a tricky position. They are trying to cut back on spending in order to fix their finances and pay down the massive pile of debt that they have accumulated in the past few years. However, their reserves will decline if they fail to replace them. Exxon, for example, only replaced 67 percent of the oil it produced in 2015.

Moreover, as Apex Consulting notes, oilfield services might demand higher prices in the future as drilling activity picks up. Right now, offshore rigs are still underutilized, meaning that price inflation has yet to kick in.

In other words, the decline in costs post-2014 are, at least in part, cyclical. Costs will rise again as activity picks up unless oil producers work with their suppliers to address the underlying structural costs of oil production.

Link to original article: http://oilprice.com/Energy/Energy-General/Oil-Majors-Costs-Have-Risen-66-Since-2011.html

By Nick Cunningham of Oilprice.com


Ichimoku Cloud Analysis 02.03.2017 (GBP/USD, GOLD)

Article By RoboForex.com

GBP USD, “Great Britain Pound vs US Dollar”

GBP USD, Time Frame H4. Indicator signals: Tenkan-Sen and Kijun-Sen are still influenced by “Dead Cross” (1) and D “Dead Cross” (3). Ichimoku Cloud is heading down (2); Chinkou Lagging Span is below the chart. Short-term forecast: we can expect the price to be corrected towards W Tenkan-Sen and then continue moving downwards.

GBP USD, Time Frame H1. Indicator signals: Tenkan-Sen and Kijun-Sen are influenced by “Dead Cross” (1). Ichimoku Cloud is going down (2), Chinkou Lagging Span is below the chart, and the price is on Tenkan-Sen. Short-term forecast: we can expect resistance from Tenkan-Sen, and decline of the price.


XAU USD, “Gold vs US Dollar”

XAU USD, Time Frame H4. Indicator signals: Tenkan-Sen and Kijun-Sen intersected above Kumo Cloud and formed “Dead Cross” (1). Ichimoku Cloud is moving to the upside (2), Chinkou Lagging Span is on the chart, and the price is above Kumo. Short‑term forecast: we can expect support from W Kijun-Sen – Senkou Span B, and growth of the price.


RoboForex Analytical Department

Article By RoboForex.com

Attention!
Forecasts presented in this section only reflect the author’s private opinion and should not be considered as guidance for trading. RoboForex LP bears no responsibility for trading results based on trading recommendations described in these analytical reviews.

EUR/USD: Comments from Brainard point to Fed hike in two weeks

By GrowthAces.com

Macroeconomic overview

Fed Governor Lael Brainard said that an improving global economy and a solid U.S. recovery mean it will be “appropriate soon” for the Federal Reserve to raise U.S. interest rates, adding an important voice to the chorus of officials signaling rates may rise as soon as mid-March.

“We are closing in on full employment, inflation is moving gradually toward our target, foreign growth is on more solid footing, and risks to the outlook are as close to balanced as they have been in some time,” Brainard said. “Assuming continued progress, it will likely be appropriate soon to remove additional accommodation, continuing on a gradual path.” “After being an important constraint in the past few years, the external environment currently appears more benign than it has been for some time,” Brainard said, directly addressing the set of risks that led her to become one of the stronger advocates for delaying any rate increase until the global environment improved.

Brainard’s opinions used to be dovish, that is why her hawkish comments are very important and we think are a clear signal that the Fed will not wait until June with a hike.

Coupled with the comments of other Fed officials in recent days and looking ahead to remarks by Fed chair Janet Yellen on Friday, Brainard’s comments will likely help cement sentiment that a rate increase when the Fed meets in two weeks is now the assumed outcome.

Wednesday brought us some important macroeconomic data from the U.S.

The Commerce Department said consumer spending, which accounts for more than two-thirds of U.S. economic activity, increased 0.2% after rising 0.5%in December. The tepid gain in consumer spending added to weak housing starts, equipment spending and construction data in suggesting economic growth remained moderate early in the first quarter after slowing in the final three months of 2016.

Excluding food and energy, the so-called core PCE price index rose 0.3% in January. That was the biggest increase since January 2012 and followed a 0.1% gain in December. The core PCE price index increased 1.7% yoy after a similar gain in December. The core PCE is the Fed’s preferred inflation measure.

Rising inflation is eroding consumer spending. When adjusted for inflation, consumer spending fell 0.3% in January, the first drop since August and the biggest in three years. It increased 0.3% in December and January’s drop implies consumer spending will probably not provide a big boost to GDP in the first quarter.

Despite the softness on the demand-side of the economy, the manufacturing sector recovery is gaining steam. In a separate report on Wednesday, the Institute for Supply Management said its index of national factory activity increased to a reading of 57.7 last month, the highest since August 2014, from 56.0 in January.

Technical analysis

The situation has not changed a lot from the point of view of technical analysis. The EUR/USD remains below the negatively aligned 7-day exponential moving average, which highlights the overall bearish structure. Given hawkish comments from Brainard we think that current trend will be continued. The nearest support level is 1.0494, but we expect a stronger drop to at least 1.0451 (76.4% fibo of January rise).

EURUSD Daily Forex Signals Chart

Trading strategy

We have placed a sell order at 1.0555, encouraged by the hawkish Brainard’s speech. If the order is filled we will set the target just above January low of 1.0342.


USD/CAD: Bank of Canada keeps rates unchanged, as expected

Macroeconomic overview

The Bank of Canada acknowledged on Wednesday that fourth-quarter growth might have been stronger than anticipated, but it left interest rates unchanged at 0.50% as it focused on the “significant uncertainties” facing the economy.

In an unusually short policy statement, the central bank maintained its cautious stance. It downplayed the fourth-quarter strength by pointing to the large amount of unused capacity in the economy and saying it was looking past the recent rise in inflation as being due to temporary factors.

In contrast to the United States, subdued wage growth and hours worked in Canada also showed persistent economic slack despite recent gains in employment, the central bank said.

The statement keeps the bank’s dovish stance intact after Governor Stephen Poloz said in January that a rate cut remained on the table if the risks to the economy materialize.

Technical analysis

The USD/CAD is testing the resistance at 1.3357 (61.8% fibo of December-January drop). We think that further rise to at least 1.3450 (76.4% fibo) is likely in the coming days. But first the USD/CAD needs to clear January 20 high at 1.3387.

USDCAD Daily Forex Signals Chart

Trading strategy

In our opinion no short-term position is justified from the risk/reward perspective. We keep our bearish long-term outlook, as rising commodities prices should support the loonie.


NZD/USD: We will switch to short if 0.7100 is broken

Macroeconomic overview

The Reserve Bank of New Zealand said risks around future interest rate movements were equally weighted, but warned of uncertainty stemming from U.S. President Donald Trump’s protectionism.

The bank highlighted after its last monetary policy statement in February that its focus had shifted from the domestic economy to international events.

On the domestic front, Wheeler singled out the housing market as the greatest risk, though prices had moderated in recent months.

The RBNZ last month held the official cash rate steady at record lows of 1.75 percent and flagged it could remain there for two years or more.

Technical analysis

Long upper wick on Tuesday’s candlestick and negatively aligned 7-day exponential moving average suggest a downward move in the coming days.

NZDUSD Daily Forex Signals Chart

Trading strategy

We will switch our position to short if the NZD/USD breaks below 0.7100. This would open the way to full retracement of December-January move.


TRADING STRATEGIES SUMMARY:

(Detailed trading strategies are available only for VIP subscribers)
About the Author:

By GrowthAces.com – Daily Forex Trading Strategies


Gold Pressured By Increasing Odds of March FED Rate Hike

By Jason Hamlin, GoldStockBull.com

The gold price has corrected by roughly $25 over the past few days. This pullback has been driven by increased odds of a Fed rate hike during March. Federal Reserve officials have been making hawkish comments lately, which has been supportive of the USD index and thus bearish for precious metals. After hitting a 2017 high of $1,265 on Monday, the gold price has since dropped back to $1240 today.

On Monday the odds of a March rate hike were around 40%, but they have since increased to around 70% to 80% today. New York Fed President William Dudley told CNNMoney on Tuesday that the case for raising interest rates is growing.

“I think the case for monetary policy tightening has become a lot more compelling,”

San Francisco Federal Reserve Bank President John Williams also made hawkish comments:

“In my view, a rate increase is very much on the table for serious consideration at our March meeting. We need to gradually ease our foot off the gas in order to avoid a ‘too hot’ economy that in the end isn’t sustainable.”

Yellen speaks Friday and will give investors the best indication of where the Fed is headed going into its two-day meeting on March 14-15. While I have no crystal ball, I don’t think the FED will raise rates again during March. If they do, it will be by a maximum of 25 basis points.

The ISM manufacturing index rose more than expected this week, from a reading of 56 to 57.7. This news also contributed to the lower gold price, as improving economic fundamentals decrease investor appetite for safe haven assets and lend support to the dollar.

However, the labor market was weaker than expected with the employment index falling to 54.2, down from January’s reading of 56.1. Inflation also remains muted with the prices index falling to 68, down from the previous reading of 69. This data would suggest that a rate hike is not quite as pressing as the headline numbers might suggest.

The gold chart shows that the current pullback is nothing to be concerned about. The gold price has corrected by $30 and $25 already in 2017 and both times it was followed by a resumption of the uptrend. I think the current correction will be no different and am looking for support at $1,220 to hold. This level is significant because it was resistance in late January and support during February. The 100-day moving average is also right around this level, currently at $1,216 but rising.

gold price chart

If support at $1,220 should fail, look for support at $1,200 to hold. The $1,200 level was key support twice during 2016 and coincides roughly with the 50-day moving average.

The bottom line is that the current pullback in gold and silver prices is a normal part of any bull market cycle and should not lead investor to panic out of their positions. Last week we turned short-term bearish and warned subscibers that a pullback was likely. March and April tend to be very weak seasonal months for precious metals.

gold seasonality

Some investors view this as a cue to turn their attention elsewhere, but it is precisely during these months that the best buying opportunities can be found. So, we are actively screening a large number of mining stocks, running our valuation models, doing cross-company comparisons, contacting management about upcoming catalysts and narrowing our list of target stocks to buy on the dip.

This new bull cycle in precious metals that started in January of 2016 cannot be stopped by Federal Resereve jawboning or minor rate hikes from NIRP to ZIRP. Rates remain well below historic norms at we don’t see this changing anytime soon. There will be no modern day Volcker, because the conditions that neccesitated his aggresive rate hikes do not exist today.

We believe the gold price is headed to $2,000 within the next few years and that mining stocks will continue to offer compelling leverage. Junior mining stocks in particular are going to geneate spectacular gains for investors and our portfolio is well-positioned to take advantage of these trends. We believe that for long-term gold investors, all dips over the next several years will prove to be excellent buying opportunities.

If you would like to view the GSB portfolio, receive our newsletter, research and trade alerts, you can sign up here.

About the Author:

Jason Hamlin, GoldStockBull.com

Jason Hamlin is the founder of Gold Stock Bull and has been investing in precious metals for over 20 years. Jason spent nearly a decade in analytics for the world’s largest market research firm, before finding success investing full time. He launched Gold Stock Bull in 2005 and turned his focus from helping fortune 500 companies to helping individual investors that were struggling to achieve strong gains in the stock market.

EUR/USD: awaiting an upwards correction to 1.0570

By Gabriel Ojimadu, Alpari

Previous:

On Wednesday, the EUR/USD pair closed in the red. The last three speeches from Fed members (Harker, Kaplan and Williams) has put the question of a rate hike in March back on the agenda.

The Fed Fund futures prices at CME Group have put the probability of a rate hike this month up to 66%. A growth in US bond yields has created more demand for the dollar. The euro rate fell to 1.0514. This fall was mitigated by growth of the euro index and of German 10-year bond yields.

Market expectations:

On Wednesday, after an upwards correction to 1.0572, the rate returned to 1.0528. Looking at inter-market and technical analysis, I’m getting quite an unclear picture for Thursday.

Considering that traders are expecting the possibility of a rate hike from the Fed this month, I think one must expect the euro to weaken in keeping with the trend. Today, I’m sticking to the cycles and patterns, which are suggestive of a correction for the euro to 1.0570 by the end of the day. There’s still time before the FOMC sits down, so I’ve gone for an upwards correction.

Day’s news (GMT+3):

  • 10:00 Germany: Import Price Index (Jan);
  • 11:15 Switzerland: real retail sales (Jan);
  • 12:30 UK: PMI construction (Feb);
  • 13:00 Eurozone: CPI (Feb), CPI – core (Feb), Producer Price Index (Jan), unemployment rate (Jan);
  • 15:30 USA: Challenger job cuts (Feb);
  • 16:30 Canada: GDP (Dec); USA: initial jobless claims (Feb 24);
  • 21:00 Canada: BoC gov council member Lane’s speech.

EURUSD rate on the hourly. Source: TradingView

Intraday forecast: low: 1.0521, high: 1.0570, close: 1.0560.

My expectations of a weakening euro yesterday came off in full. The rate fell to 1.0514. The pair didn’t make it to the 112th degree as it rebounded on the back of a rise in German 10-year bond yields by 36% and growth on the euro index.

For Thursday, I’m forecasting some correctional movement to 1.0570. As I’ve written above, the picture I’m getting isn’t all that clear, but I’ve based my predictions on cycles and patterns, which point to a restoration for the euro.

I expect that the euro’s growth will begin from around 1.0521, although it could be from 1.0514. A breaking through of the trend line would show us which factors are having an influence on the dynamics of the currency pair.

Positives for the euro (+):

Fundamental:

(+) US president Donald Trump favours a weaker dollar;

(+) The threshold for acceptable US government debt of 20.1 trillion USD may be reached by March this year. This will create headaches for new US president Donald Trump. A new law on the debt ceiling will come into force on the 16th of March 2017;

(+) Greece may need less money than the IMF had planned for;

(+) François Bayrou, leader of the “Democratic Movement” party, has ruled out running for the presidency and thrown his weight behind independent candidate Emmanuel Macron;

Technical (short-term):

(+) According to data for 21/02/17, small time speculators on the Chicago Exchange have increased their long positions by 1,687 contracts and reduced short positions by 2,888 contracts;

(+) EURGBP: On the daily timeframe, the cross is in a phase of growth. The target is 0.86, after which a fall is expected;

(+) EURUSD: On the daily timeframe, between the Stochastic indicator and CCI, some bullish divergences have formed;

(+) EURUSD: The monthly Stochastic indicator (5,3,3) is looking upwards;

(+) German 10-year bond yields: 0.283% (up 36.05% for 02/03/17). In Asia, US 10-year bond yields fell by 0.24% to 2,458%;

(+) Cycles are indicating growth for the euro until the end of the day;

(-) The average line of price movements with a 120 bar window (1 week) from 06/2002 and 03/2016 point to an intraday strengthening of the euro against the dollar up until 20:15 EET;

Negatives for the euro (-):

Fundamental:

(-) The ECB has no plans to curtail its QE program. According to the minutes of the latest meeting, most members of the Governing Council don’t believe it necessary to reduce the amount of stimulus (long-term impact);

(-) According to CME Group FedWatch Tool, the probability of a rate hike in March has grown from 62.0% to 66.4%, in May from 69.0% to 71.4%, and in June from 83.5% to 84.6%;

(-) Head of the Philadelphia Fed, Patrick Harker, believes that a rate hike in March is possible;

(-) Dallas Fed president says it’s better to raise rates sooner rather than later;

(-) John Williams, head of the San Francisco Fed, says that FOMC members will give serious consideration to a rate hike this month;

(-) Political risks in Europe are growing (French elections and Brexit);

(-) Greece is unable to reach a deal with its creditors for financial assistance;

(-) Recent statistic favour the US;

Technical factors (short-term):

(-) According to data for 21/02/17, short and long positions from large speculators have increased on the Chicago exchange. Long positions have grown by 4,953 contracts to 132,216, while short positions have gone up by 12,556 contracts to 183,011. Net short positions have grown from 39,144 contracts to 50,779;

(-) US 10-year bond yields: 2.469% (up 3% from 01/03/17);

(-) EURUSD: the daily Stochastic (5,3,3) and CCI indicators are looking downwards;

(-) EURUSD: the weekly Stochastic indicators (5,3,3), AO and AC are moving downwards;

(-) Long/short ratio as of 8:12 EET: 25%/74%, lots: 7006/20361, positions: 21885/48070.

Fibonacci Retracements Analysis 02.03.2017 (EUR/USD, EUR/GBP)

Article By RoboForex.com

EUR USD, “Euro vs US Dollar”

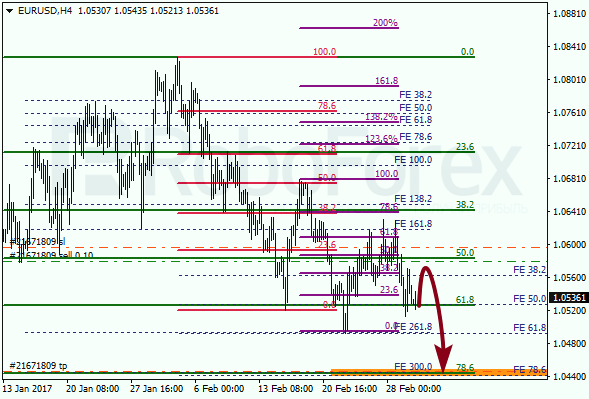
The EUR/USD pair rebounded from the correctional retracement of 61.8% twice, which means that the local ascending correction may continue. However, later the price may resume moving downwards to reach the group of fibo-levels at 1.0445 – 1.0440.

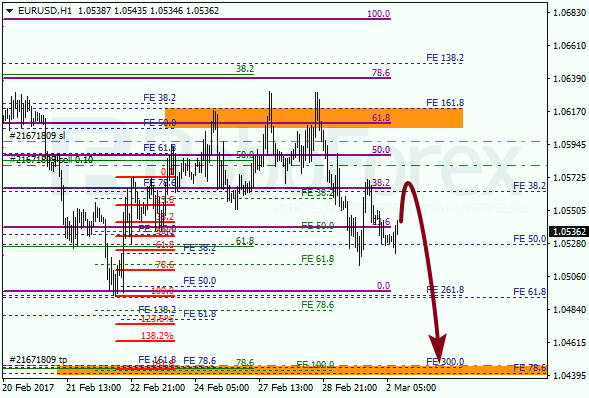
At the H1 chart, the price may again test the correctional retracement of 38.2%, which earlier provided resistance. If the pair rebounds from this level, the market may start a new descending movement towards its downside targets.


EUR GBP, “Euro vs Great Britain Pound”

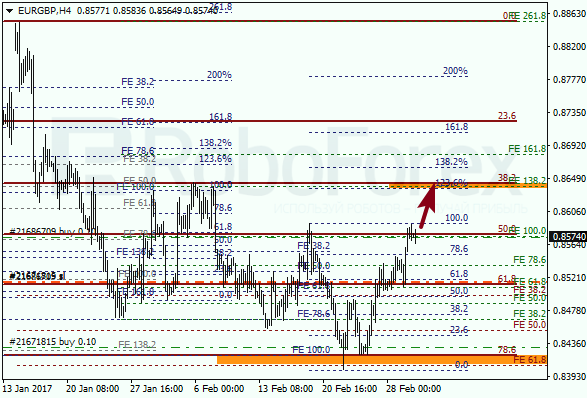
The EUR/GBP pair rebounded from the retracement of 78.6% twice and, as a result, resumed moving upwards. On Thursday, the price may continue growing to reach the group of upside fibo-levels at 0.8645 – 0.8635.

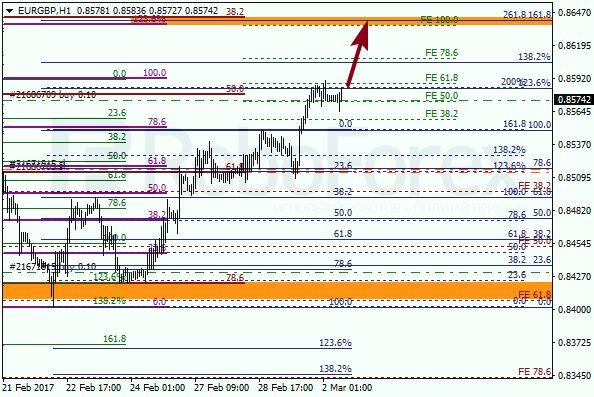
At the H1 chart, the local correction is about to complete. In the nearest future, the market may break the previous high. Consequently, later the price may reach its upside targets, which are confirmed by intraday fibo-level.


RoboForex Analytical Department

Article By RoboForex.com

Attention!
Forecasts presented in this section only reflect the author’s private opinion and should not be considered as guidance for trading. RoboForex LP bears no responsibility for trading results based on trading recommendations described in these analytical reviews.


Ichimoku Cloud Analysis 01.03.2017 (GBP/USD, GOLD)

Article By RoboForex.com

GBP USD, “Great Britain Pound vs US Dollar”

GBP USD, Time Frame H4. Indicator signals: Tenkan-Sen and Kijun-Sen are still influenced by “Dead Cross” (1) and D “Dead Cross” (3). Ichimoku Cloud is heading down (2); Chinkou Lagging Span is below the chart. Short-term forecast: we can expect resistance from D Senkou Span A, and decline of the price towards W Tenkan-Sen.

GBP USD, Time Frame H1. Indicator signals: Tenkan-Sen and Kijun-Sen intersected again below Kumo Cloud and formed “Dead Cross” (1). Ichimoku Cloud is going down (2), Chinkou Lagging Span is below the chart, and the price is on Tenkan-Sen. Short-term forecast: we can expect resistance from Kijun-Sen, and decline of the price.


XAU USD, “Gold vs US Dollar”

XAU USD, Time Frame H4. Indicator signals: Tenkan-Sen and Kijun-Sen are still influenced by “Golden Cross” (1) and D “Golden Cross”, but the lines are getting closer to each other. Ichimoku Cloud is moving to the upside (2), Chinkou Lagging Span is moving towards the chart, and the price is on D Tenkan-Sen. Short‑term forecast: we can expect support from W Kijun-Sen – Senkou Span A, and growth of the price.


RoboForex Analytical Department

Article By RoboForex.com

Attention!
Forecasts presented in this section only reflect the author’s private opinion and should not be considered as guidance for trading. RoboForex LP bears no responsibility for trading results based on trading recommendations described in these analytical reviews.

Forex Technical Analysis & Forecast 01.03.2017 (EUR/USD, GBP/USD, USD/CHF, USD/JPY, AUD/USD, USD/RUB, GOLD, BRENT)

Article By RoboForex.com

EUR USD, “Euro vs US Dollar”

The EUR/USD pair hasn’t been able to fix above 1.0600; it has rebounded from the high and right now is moving downwards. The market has broken the low of the range and almost formed the Double Top pattern. Possibly, the price may continue falling inside the downtrend to reach 1.0507. After that, the instrument may return to 1.0568.


GBP USD, “Great Britain Pound vs US Dollar”

The GBP/USD pair is trading to break 1.2388. In fact, the price may continue falling to reach 1.2297. Later, in our opinion, the market may return to 1,2388 and then start another decline with the target at 1.2067.


USD CHF, “US Dollar vs Swiss Franc”

Being under pressure, the USD/CHF pair is growing. Possibly, the price may reach 1.0168. Later, in our opinion, the market may be corrected towards 1.0067 and then continue growing inside the uptrend.


USD JPY, “US Dollar vs Japanese Yen”

Being under pressure, the USD/JPY pair is moving upwards as well. Possibly, the price may continue growing with the target at 115.30. After that, the instrument may reverse and fall inside the downtrend.


AUD USD, “Australian Dollar vs US Dollar”

The AUD/USD pair has completed the descending wave along with the correction. Possibly, today the price may continue falling inside the downtrend. The next target is at 0.7600.


USD RUB, “US Dollar vs Russian Ruble”

The USD/RUB pair is forming the fifth ascending wave. Possibly, today the price may reach 58.73. After that, the instrument may fall towards 57.64 and them continue moving upwards with the target at 61.00.


XAU USD, “Gold vs US Dollar”

Gold has formed the closest target of the correction. Possibly, today the price may grow towards 1250. Later, in our opinion, the market may form another descending structure with the target at 1238 and then resume growing to reach 1270.


BRENT

Brent is falling towards 55.30. Later, in our opinion, the market may be corrected to reach 56.35 and then start another descending movement with the target at 54.00.


RoboForex Analytical Department

Article By RoboForex.com

Attention!
Forecasts presented in this section only reflect the author’s private opinion and should not be considered as guidance for trading. RoboForex LP bears no responsibility for trading results based on trading recommendations described in these analytical reviews.


EUR/USD: weakening of the euro expected during the European session

By Gabriel Ojimadu, Alpari

Previous:

On Tuesday, trading on the EUR/USD currency pair closed down. Despite a rise in quotes to 1.0630, the rate fell to 1.0576, and then further to 1.0551 in the Asian session. The dollar rose across the board after San Francisco Fed chief John Williams commented that the FOMC would be looking very closely at the possibility of raising interest rates when they sit down later this month.

In response to his comments, US 10-year bond yields shot up. According to CME Group’s FedWatch Tool, the probability of a rate hike in March has grown from 31.0% to 62.0%, in May from 53.1% to 69%, and in June from 72.6% to 83.5%.

I’ve disregarded Donald Trump’s address to Congress as his speech provided no details or figures about his reform plans.

Market expectations:

Looking at the bigger picture, the single currency should fall against the dollar today. During the European and US sessions, I’m expecting a drop to around 1.0527. If 10-year bond yields rise above 2.43%, then we can set 1.0502 as an intraday target.

The news section for Wednesday is quite full, and each event is likely to induce some kind of correction on the market.

Day’s news:

  • 10:00 Switzerland: UBS consumption indicator (Jan);
  • 11:30 Switzerland: SVME PMI (Feb);
  • 11:55 Germany: unemployment change (Feb), Markit manufacturing PMI (Feb);
  • 12:00 Eurozone: Markit manufacturing PMI (Feb);
  • 12:30 UK: Markit manufacturing PMI (Feb), consumer credit (Jan), M4 money supply (Jan), mortgage approvals (Jan);
  • 16:00 Germany: Consumer Price Index (Feb);
  • 16:30 Canada: current account (Q4);
  • 16:30 USA: personal consumption expenditures – price index (Jan), personal spending (Jan), personal income (Jan);
  • 17:30 Canada: RBC manufacturing PMI (Feb);
  • 17:45 USA: Markit manufacturing PMI (Feb);
  • 18:00 Canada: BoC interest rate decision; USA: ISM manufacturing PMI (Feb), construction spending (Jan), ISm prices paid (feb);
  • 18:30 USA: EIA crude oil stocks change (Feb 24);
  • 21:00 USA: FOMC member Kaplan’s speech;
  • 22:00 USA: publication of Fed’s Beige Book.

EURUSD rate on the hourly. Source: TradingView

Intraday forecast: low; 1.0527, high: 1.0589 (current in Asia), close: 1.0544.

My predictions for Tuesday came off in full. Head of the San Francisco Fed, John Williams, knocked the euro down from a high of 1.0630 to 1.0570 with his comments about interest rates. In Asia, the rate fell to 1.0551. The weakening of the euro stopped at the 90th degree.

Looking at cycles and historical patterns, today, I’m expecting a fall to around 1.0527. If US 10-year bond yields rise above 2.43%, we can set the target even lower at 1.0502 (112 degrees). The most influential factors for the euro are listed below.

Positives for the euro (+):

Fundamental:

(+) US president Donald Trump favours a weaker dollar;

(+) The threshold for acceptable US government debt of 20.1 trillion USD may be reached by March this year. This will create headaches for new US president Donald Trump. A new law on the debt ceiling will come into force on the 16th of March 2017;

(+) Greece may need less money than the IMF had planned for;

(+) François Bayrou, leader of the “Democratic Movement” party, has ruled out running for the presidency and thrown his weight behind independent candidate Emmanuel Macron;

Technical (short-term):

(+) According to data for 21/02/17, small time speculators on the Chicago Exchange have increased their long positions by 1,687 contracts and reduced short positions by 2,888 contracts;

(+) On the daily timeframe, the EUR/GBP cross has started a phase of growth. The immediate target is 0.86;

(+) On the daily timeframe, between the Stochastic indicator and CCI, some bullish divergences have formed;

(+) Cycles are indicating growth for the euro from 14:00 EET;

(+) The monthly Stochastic indicator (5,3,3) has reversed upwards;

(+) German 10-year bond yields: 0.208% (up 0.97% for 01/03/17);

Negatives for the euro (-):

Fundamental:

(-) The ECB has no plans to curtail its QE program. According to the minutes of the latest meeting, most members of the Governing Council don’t believe it necessary to reduce the amount of stimulus (long-term impact);

(-) According to CME Group FedWatch Tool, the probability of a rate hike in March has grown from 31.0% to 62.0%, in May from 53.1% to 69%, and in June from 72.6% to 83.5%;

(-) Head of the Philadelphia Fed, Patrick Harker, believes that a rate hike in March is possible;

(-) Dallas Fed president says it’s better to raise rates sooner rather than later;

(-) John Williams, head of the San Francisco Fed, says that FOMC members will give serious consideration to a hike in interest rates this month;

(-) Political risks in Europe are growing (French elections and Brexit);

(-) Greece is unable to reach a deal with its creditors for financial assistance;

(-) Recent statistic favour the US;

Technical factors (short-term):

(-) According to data for 21/02/17, short and long positions from large speculators have increased on the Chicago exchange. Long positions have grown by 4,953 contracts to 132,216, while short positions have gone up by 12,556 contracts to 183,011. Net short positions have grown from 39,144 contracts to 50,779;

(-) US 10-year bond yields: 2.415% (up 2.2% on 28/02/17). In Asia, yields grew by 2.64% to 2.42%;

(-) A reversal hammer has formed on the daily timeframe;

(-) The daily Stochastic (5,3,3) and CCI indicators have reversed downwards;

(-) The weekly Stochastic indicators (5,3,3), AO and AC are moving downwards;

(-) Cycles indicate a weakening euro up to 18:00 EET

(-) The average line of price movements with a 120 bar window (1 week) from 03/2015 and 08/2003 point to an intraday weakening of the euro against the dollar up until 18:00 EET;

(-) Long/short ratio as of 7:46 EET: 33%/66%, lots: 9160/17846, positions: 27570/41421.

Next Oil Rally? Futures Say Market Is Tightening

By OilPrice.com

U.S. oil inventories are at record levels, but there are a few glimmers of hope that the glut could be starting to subside.

Storing crude oil for sale at a later date is no longer profitable, as the futures curve has flattened out in recent weeks, depriving traders of a strategy that has served them well over the past few years. The market “contango,” in which front-month oil contracts trade at a discount to oil futures six months or a year out, has all but vanished. The differential must be large enough to cover the cost of storage, and for many time spreads that is no longer the case. After three years of a steep contango, storing oil simply to take advantage of the time spreads is increasingly uneconomical.

One of the more expensive forms of storage is floating on tankers at sea, and because of the narrowing contango, floating storage is unprofitable today. Reuters reports that traders are beginning to unload crude from floating storage along the Gulf Coast. “Right now, traders aren’t incentivized (to store),” Sandy Fielden, director of oil and products research at Morningstar, told Reuters in an interview. “It won’t all stampede out of the gate, but inventory levels will come down. What will happen is that some of it will go to refineries, but a fair amount will be exported too.”

Just as the rapid rise of floating storage in 2015 and 2016 was a sign of the deepening global supply imbalance, draining tankers of stored oil is an early sign that the supply glut is receding.

So far, it is only the most expensive storage facilities that are seeing drawdowns – the U.S. on the whole has seen crude stocks swell to record highs. But oil analysts argue that the surge in crude inventories is a symptom of stepped up imports booked at the end of 2016, when OPEC members pumped out huge volumes of crude just ahead of implementation of their deal to cut production. After a few weeks of transit time, the extra supply started showing up in U.S. storage data in January and February. In other words, the stock builds could be a temporary anomaly.

More recently, the time spreads for Brent futures also indicate increasing tightness in the market. John Kemp of Reuters notes that the spread between futures between April and May has sharply narrowed this month, meaning that the market is betting on a supply deficit as we move into the second quarter. The spreads for May-June and June-July are even smaller, trading at a few cents per barrel. This is a complicated way of saying that there isn’t a way to make money by buying oil, paying for storage, and selling it at a later date.

In a separate report, Reuters notes that inventories are also starting to drawdown in Asia, adding further evidence that the glut is not as bad as feared. As OPEC has throttled back on production, Asia is starting to see the impact. Reuters says that unusually large drawdowns took place across key oil hubs in Asia – 6.8 million barrels of oil were withdrawn from tanker storage off of Malaysia’s coast while Singapore saw a 4.1 million barrel decline and Indonesia’s storage fell by 1.2 million barrels.

“Dancing contango is now not a profitable thing to do, so we’ve sold out,” an oil trading manager told Reuters. The trader no longer stores oil on tankers because of the disappearing contango.

The details of the contango and the oil futures market may seem complex and arcane, but the shift in time spreads is exactly what OPEC has been targeting with its supply cut. By cutting near-term supply, OPEC has succeeded in changing the economics of oil trading, forcing inventories to draw down. That could cause a short-term supply problem as oil is unloaded from storage, but in the long run OPEC needs to drain that excess supply from storage tanks around the world in order to spark higher prices.

Traders are more and more confident that the oil market will experience tighter conditions as we move into the second quarter, a bet that is reflected in both the time spreads and the exceptional buildup in bullish positions on crude oil. The oil price rally is not without its risks – very notable risks that have been covered in previous articles – but for now, the futures market is offering investors and traders some reasons for bullishness.

Link to original article: http://oilprice.com/Energy/Energy-General/Next-Oil-Rally-Futures-Say-Market-is-Tightening.html

By Nick Cunningham of Oilprice.com