Author Archive for InvestMacro – Page 530

10-Year Note Speculators raised bullish bets for 1st time in 4 weeks

By CountingPips.comReceive our weekly COT Reports by Email

10-Year Note Non-Commercial Speculator Positions:

Treasury speculators raised their bullish net positions in the 10-Year Note futures markets this week for the first time in four weeks, according to the latest Commitment of Traders (COT) data released by the Commodity Futures Trading Commission (CFTC) on Friday.

The non-commercial futures contracts of 10-Year Note futures, traded by large speculators and hedge funds, totaled a net position of 282,329 contracts in the data reported through Tuesday July 18th. This was a weekly rise of 25,302 contracts from the previous week which had a total of 257,027 net contracts.

Speculative positions had fallen the previous three weeks by a total of -88,145 net contracts but the overall bullish standing has continued to remain above the +250,000 net contract level for six consecutive weeks.

10-Year Note Commercial Positions:

The commercial traders position, categorized by the CFTC as hedgers or traders engaged in buying and selling for business purposes, totaled a net position of -132,044 contracts on the week. This was a weekly shortfall of -68,208 contracts from the total net of -63,836 contracts reported the previous week.

IEF ETF:

Over the same weekly reporting time-frame, from Tuesday to Tuesday, the 7-10 Year Treasury Bond ETF (IEF) closed at approximately $106.92 which was a rise of $0.87 from the previous close of $106.05, according to unofficial market data.

*COT Report: The COT data, released weekly to the public each Friday, is updated through the most recent Tuesday (data is 3 days old) and shows a quick view of how large speculators or non-commercials (for-profit traders) as well as the commercial traders (hedgers & traders for business purposes) were positioned in the futures markets. The CFTC categorizes trader positions according to commercial hedgers (traders who use futures contracts for hedging as part of the business), non-commercials (large traders who speculate to realize trading profits) and nonreportable traders (usually small traders/speculators). Find CFTC criteria here: (http://www.cftc.gov/MarketReports/CommitmentsofTraders/ExplanatoryNotes/index.htm).

Article by CountingPips.comWeekly COT Report


S&P500 Speculators cut back on bullish bets for 1st time in 7 weeks

By CountingPips.comReceive our weekly COT Reports by Email

S&P500 Non-Commercial Speculator Positions:

Large speculators reduced their net positions in the S&P500 futures markets this week following six weeks of rising bets, according to the latest Commitment of Traders (COT) data released by the Commodity Futures Trading Commission (CFTC) on Friday.

The non-commercial futures contracts of S&P500 futures, traded by large speculators and hedge funds, totaled a net position of 1,279 contracts in the data reported through Tuesday July 18th. This was a weekly fall of -1,348 contracts from the previous week which had a total of 2,627 net contracts.

S&P500 speculative bets, despite the weekly drop, continue to be in positive territory for the fifth straight week after turning bullish on June 20th.

S&P500 Commercial Positions:

The commercial traders position, categorized by the CFTC as hedgers or traders engaged in buying and selling for business purposes, totaled a net position of -14,603 contracts on the week. This was a weekly uptick of 353 contracts from the total net of -14,956 contracts reported the previous week.

SPY ETF:

Over the same weekly reporting time-frame, from Tuesday to Tuesday, the SPY ETF, which tracks the price of S&P500 Index, closed at approximately $245.66 which was a gain of $3.47 from the previous close of $242.19, according to unofficial market data.

*COT Report: The COT data, released weekly to the public each Friday, is updated through the most recent Tuesday (data is 3 days old) and shows a quick view of how large speculators or non-commercials (for-profit traders) as well as the commercial traders (hedgers & traders for business purposes) were positioned in the futures markets. The CFTC categorizes trader positions according to commercial hedgers (traders who use futures contracts for hedging as part of the business), non-commercials (large traders who speculate to realize trading profits) and nonreportable traders (usually small traders/speculators). Find CFTC criteria here: (http://www.cftc.gov/MarketReports/CommitmentsofTraders/ExplanatoryNotes/index.htm).

Article by CountingPips.comWeekly COT Report


Gold Speculators edged bullish bets lower, down for 6th week

By CountingPips.comReceive our weekly COT Reports by Email

Gold Non-Commercial Speculator Positions:

Large speculators slightly trimmed their bullish net positions in the Gold futures markets this week and pushed speculative bets lower for a sixth straight week, according to the latest Commitment of Traders (COT) data released by the Commodity Futures Trading Commission (CFTC) on Friday.

The non-commercial futures contracts of Gold futures, traded by large speculators and hedge funds, totaled a net position of 60,138 contracts in the data reported through Tuesday July 18th. This was a weekly decline of -122 contracts from the previous week which had a total of 60,260 net contracts.

The gold speculative position has dropped by -144,327 net contracts in just the past six weeks alone but this week’s very small change may turn out to be a pause (and welcome sign for gold bulls) in the rate of decline of speculator sentiment.

Gold Commercial Positions:

Meanwhile, the commercial traders position, categorized by the CFTC as hedgers or traders engaged in buying and selling for business purposes, totaled a net position of -73,635 contracts on the week. This was a weekly rise of 281 contracts from the total net of -73,916 contracts reported the previous week.

GLD ETF:

Over the same weekly reporting time-frame, from Tuesday to Tuesday, the GLD ETF, which tracks the price of gold, closed at approximately $118.11 which was an increase of $2.49 from the previous close of $115.62, according to unofficial market data.

*COT Report: The COT data, released weekly to the public each Friday, is updated through the most recent Tuesday (data is 3 days old) and shows a quick view of how large speculators or non-commercials (for-profit traders) as well as the commercial traders (hedgers & traders for business purposes) were positioned in the futures markets. The CFTC categorizes trader positions according to commercial hedgers (traders who use futures contracts for hedging as part of the business), non-commercials (large traders who speculate to realize trading profits) and nonreportable traders (usually small traders/speculators). Find CFTC criteria here: (http://www.cftc.gov/MarketReports/CommitmentsofTraders/ExplanatoryNotes/index.htm).

Article by CountingPips.comWeekly COT Report


Silver Speculators continued to decrease bullish net positions for 6th week

By CountingPips.comReceive our weekly COT Reports by Email

Silver Non-Commercial Speculator Positions:

Large speculators continued to pare their bullish net positions in the Silver futures markets this week, according to the latest Commitment of Traders (COT) data released by the Commodity Futures Trading Commission (CFTC) on Friday.

The non-commercial futures contracts of Silver futures, traded by large speculators and hedge funds, totaled a net position of 9,376 contracts in the data reported through Tuesday July 18th. This was a weekly decrease of -4,629 contracts from the previous week which had a total of 14,005 net contracts.

Silver speculative positions have now fallen by -56,565 contracts over the past six weeks and the overall net position level has dropped to its lowest standing since August 4th 2015 when net positions totaled 8,405 contracts.

Silver Commercial Positions:

The commercial traders position, categorized by the CFTC as hedgers or traders engaged in buying and selling for business purposes, totaled a net position of -21,914 contracts on the week. This was a weekly advance of 2,653 contracts from the total net of -24,567 contracts reported the previous week.

SLV ETF:

Over the same weekly reporting time-frame, from Tuesday to Tuesday, the SLV ishares ETF, which tracks the price of silver, closed at approximately $15.38 which was a gain of $0.39 from the previous close of $14.99, according to unofficial market data.

*COT Report: The COT data, released weekly to the public each Friday, is updated through the most recent Tuesday (data is 3 days old) and shows a quick view of how large speculators or non-commercials (for-profit traders) as well as the commercial traders (hedgers & traders for business purposes) were positioned in the futures markets. The CFTC categorizes trader positions according to commercial hedgers (traders who use futures contracts for hedging as part of the business), non-commercials (large traders who speculate to realize trading profits) and nonreportable traders (usually small traders/speculators). Find CFTC criteria here: (http://www.cftc.gov/MarketReports/CommitmentsofTraders/ExplanatoryNotes/index.htm).

Article by CountingPips.comWeekly COT Report


Copper Speculators added to bullish net positions for 3rd out of past 4 weeks

By CountingPips.comReceive our weekly COT Reports by Email

Copper Non-Commercial Speculator Positions:

Large speculators raised their bullish net positions in the Copper futures markets this week, according to the latest Commitment of Traders (COT) data released by the Commodity Futures Trading Commission (CFTC) on Friday.

The non-commercial futures contracts of Copper futures, traded by large speculators and hedge funds, totaled a net position of 15,330 contracts in the data reported through Tuesday July 18th. This was a weekly advance of 3,324 contracts from the previous week which had a total of 12,006 net contracts.

Copper speculative positions have risen for three out of the past four weeks and have remained above the +10,000 speculative net level for seven consecutive weeks.

Copper Commercial Positions:

The commercial traders position, categorized by the CFTC as hedgers or traders engaged in buying and selling for business purposes, totaled a net position of -17,580 contracts on the week. This was a weekly shortfall of -2,679 contracts from the total net of -14,901 contracts reported the previous week.

JJC ETF:

Over the same weekly reporting time-frame, from Tuesday to Tuesday, the JJC iPath Bloomber Copper ETN, which tracks the price of copper, closed at approximately $30.97 which was a rise of $0.68 from the previous close of $30.29, according to unofficial market data.

*COT Report: The COT data, released weekly to the public each Friday, is updated through the most recent Tuesday (data is 3 days old) and shows a quick view of how large speculators or non-commercials (for-profit traders) as well as the commercial traders (hedgers & traders for business purposes) were positioned in the futures markets. The CFTC categorizes trader positions according to commercial hedgers (traders who use futures contracts for hedging as part of the business), non-commercials (large traders who speculate to realize trading profits) and nonreportable traders (usually small traders/speculators). Find CFTC criteria here: (http://www.cftc.gov/MarketReports/CommitmentsofTraders/ExplanatoryNotes/index.htm).

Article by CountingPips.comWeekly COT Report


Ichimoku Cloud Analysis 21.07.2017 (AUD/USD, NZD/USD, USD/CAD)

Article By RoboForex.com

AUD/USD

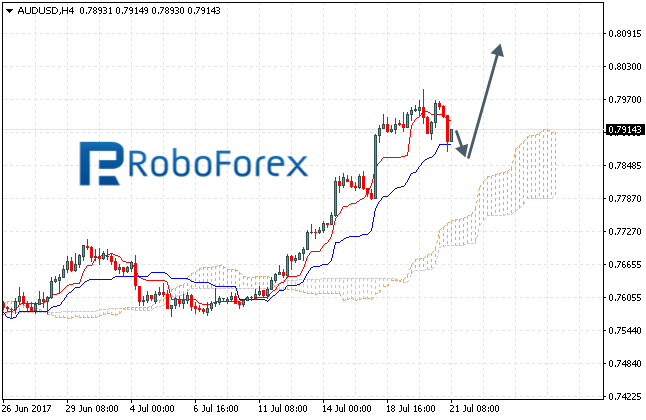
The AUD/USD is trading at 0.7914 currently. The pair keeps trading above the Ichimoku Cloud, and this suggests a rising tendency and further rise. A test of the area of Ichimoku’s signal lines can be expected. Also, the pair can test the support area near 0.7855, and then it can start yet another ascending wave above 0.8070. If the lower edge of the Ichimoku Cloud is broken and price closes below 0.7735, this can be seen as cancellation of further rise. In this case the pair can lower further towards 0.7645.

AUDUSD

NZD/USD

The NZD/USD pair is trading at 0.7434. The pair keeps trading above the Ichimoku Cloud, and this suggests a rising tendency and further rise. A test of the area of Ichimoku’s signal lines near 0.7380 can be expected. And then the pair can continue rising towards 0.7475. If the lower edge of the Ichimoku Cloud is broken and price closes below 0.7275, this can be seen as cancellation of further rise. In this case the pair can lower further towards 0.7205.

NZDUSD

USD/CAD

The USD/CAD is trading at 1.2571 currently. The pair keeps trading below the Ichimoku Cloud, and this suggests a downward tendency and further falling down. A test of the area of Ichimoku’s Cloud signal lines can be expected. Also, a resistance area near 1.2630 can be reached; after that the pair can fall further to reach 1.2385 area. If the upper edge of the Ichimoku Cloud is broken and price closes above 1.2750, this can be seen as cancellation of further downward move. In this case the pair can rise towards 1.2920.

USDCAD

Article By RoboForex.com

Attention!
Forecasts presented in this section only reflect the author’s private opinion and should not be considered as guidance for trading. RoboForex LP bears no responsibility for trading results based on trading recommendations described in these analytical reviews.

“Dirty, Difficult, And Dangerous”: Why Millennials Won’t Work In Oil

By OilPrice.com

Like many industries today, the oil industry is trying to sell its many job opportunities to the fastest growing portion of the global workforce: Millennials. But unlike any other industry, oil and gas is facing more challenges in persuading the environmentally-conscious Millennials that oil is “cool”.

During the Super Bowl earlier this year, the American Petroleum Institute (API) launched an ad geared toward Millennials, who now make up the largest generation in the U.S. labor force.

“This ain’t your daddy’s oil”, the ad says, in what API described as “a modern look at how oil is integrated into products consumers use now and in the future supported by bold visuals.”

Despite its pitch to speak the Millennials’ language and reach out to the elusive generation, the ad sparked anger with many consumers and viewers.

Millennials continue to have the most negative opinion toward the oil industry compared to all other industries, and they don’t see a career in oil and gas as their top choice of a workplace. The oil industry’s talent scouting and recruiting methods of the past are failing to reach Millennials, who want their work to have a positive impact on society, various studies and polls have found—a rather big ask for the oil industry.

This failure to reach the group that makes up the largest portion of today’s workforce—which now surpasses Generation X—points to a huge problem for the oil sector, as Baby Boomers move into retirement in droves.

Not only are Millennials snubbing oil and gas because of its negative image, they also seek different job perks than previous generations sought, and in this regard, the oil industry will need to do more as it becomes increasingly obvious that Millennials want different things than what oil executives think they want.

A total of 14 percent of Millennials say they would not want to work in the oil and gas industry because of its negative image—the highest percentage of any industry, McKinsey said in September 2016.

Young people see the industry as dirty, difficult, and dangerous, according to an EY survey published last month. EY’s survey polled Millennials—the 20-to-35-year-olds today—as well as Generation Z coming after them, and found that younger generations “question the longevity of the industry as they view natural gas and oil as their parents’ fuels. Further, they primarily see the industry’s careers as unstable, blue-collar, difficult, dangerous and harmful to society.”

In addition, two out of three teens believe the oil and gas industry causes problems rather than solves them, the survey showed.

So ‘not your daddy’s oil’ is not sinking in with Millennials and Generation Z, and with many of them, it never will, despite the oil lobbies’ marketing efforts to try to make it sound like an attractive career path.

According to executives polled by EY, the top three drivers for young people would be salary (72 percent), opportunity to use the latest technology (43 percent), and a good work-life balance (38 percent). But young people—although they are also prioritizing salary—have other views on what they look for in a job. Salary is still the top priority at 56 percent, but a close second comes good work-life balance (49 percent), with job stability and on-the-job happiness equally important at 37 percent.

Executives are underestimating the importance of work-life balance and stability for Millennials, while overestimating the allure of technology as a factor. It’s not surprising that Millennials are not as attracted to the opportunity to use new tech as oil executives believe they are – Millennials generally don’t see technology as a perk, they take it for granted.

Moreover, Millennials don’t see the oil and gas industry as innovative – a major driver of career choice among this generation. According to a recent report by Accenture, “Despite evidence to the contrary, many Millennials believe the sector is lacking innovation, agility and creativity, as well as opportunities to engage in meaningful work. In fact, only 2 percent of U.S. college graduates consider the oil and gas industry their top choice for employment.” Accenture is warning that ‘the talent well has run dry’ and said: “We believe the growing workforce deficit will, in fact, be a greater barrier to oil and gas companies’ upturn success than any deficits that might exist in capital, equipment or supplies.”

The oil and gas industry is losing the competition for talent recruitment to industries that are more appealing to Millennials, and U.S. oil and gas firms will face the talent crunch first, according to Accenture.

“Any mature industry has to think about the fact that there’s a new sheriff in town with new values, new spending habits,” Jeff Fromm, an expert in marketing to American Millennials, told Bloomberg.

And if the oil and gas industry wants to get this ‘new sheriff in town’ on board, it needs to profoundly change recruitment strategies and talent sourcing. But with the negative image that is probably set to become even more negative—despite oil organizations’ marketing efforts—oil and gas has a huge workforce problem looming.

Link to original article: http://oilprice.com/Energy/Energy-General/Dirty-Difficult-And-Dangerous-Why-Millennials-Wont-Work-In-Oil.html

By Tsvetana Paraskova for Oilprice.com


Forex Technical Analysis & Forecast 21.07.2017 (EUR/USD, GBP/USD, USD/CHF, USD/JPY, AUD/USD, USD/RUB, GOLD, BRENT)

Article By RoboForex.com

The EUR/USD pair has failed to maintain the descending wave. The market has broken the range from bottom upwards and the investors point to lift the pair further. For today we are expecting a consolidation range around 1.1620 to be developed. If this range is broken from bottom upwards, a rise towards 1.1698 can occur. If it is broken from top downwards, the market can lower to hit 1.1558.

EURUSD

The GBP/USD pair has completed a downward wave. For today we’d consider a possible rise towards 1.3031. Then the price can lower to 1.2870 once again.

GBPUSD

The USD/CHF pair has completed its ascending wave and embarked to a new downtrend wave to reach 0.9466. At the moment the market is trading in a new consolidation range at its lowest values. If this range is broken from top downwards, the pair can start moving towards the above target. If it is broken from bottom upwards, a correction towards 0.9580 can occur.

USDCHF

The USD/JPY pair is trading below 111.90. A breakout of the consolidation range and hitting 111.18 are expected. Yet another possible scenario is rising towards 112.85.

USDJPY

The AUD/USD pair has broken the low of the first descending impulse. We’d consider a possible third descending wave towards 0.7838 to be developed. Then a correction move towards 0.7902 can occur. Another scenario is a downward move towards 0.7782.

AUDUSD

The USD/RUB pair keeps trading lower while the US dollar is facing pressure. The market is trying to break the 58.84 level from top downwards. However, bearing in mind that the ascending wave on the oil market is over and a correction has started, there can be a correction move for the RUB towards 59.94 level.

USDRUB

Gold has broken yet another consolidation range from bottom upwards. Practically, we see that the current wave can be extended to 1254.50. Then a descending move towards 1244.46 can be expected. After that, a rise can happen that can lift the pair to 1260.50.

GOLD

Oil has hit the target of its ascending wave. For today we’d consider a correction towards 47.50 to start. The first target stands at 48.83. Then a rise can be expected that can lift the pair to 49.50. Practically, we’ll get a new consolidation range on top of the descending wave. If this range is broken through from bottom upwards, the pair can move higher towards 51.50. If it is broken from top downwards, the correction can be elongated to reach 47.50.

BRENT

Article By RoboForex.com

Attention!
Forecasts presented in this section only reflect the author’s private opinion and should not be considered as guidance for trading. RoboForex LP bears no responsibility for trading results based on trading recommendations described in these analytical reviews.

EURUSD: Draghi and Trump sink the dollar

By Gabriel Ojimadu, Alpari

On Thursday the 20th of July, trading on the euro/dollar pair closed up. By the end of the day, the euro had appreciated by 115 pips against the dollar, reaching 1.1630. The rate had dropped to 1.1479 before Mario Draghi’s press conference.

The European Central Bank decided to maintain rates at their current levels. The base rate remains at zero, the marginal rate at 0.25% and the deposit rate at -0.4%. The ECB also reiterated that their assets purchasing program would be maintained at 60bn EUR a month at least until December this year.

There was an increase in market volatility during Draghi’s speech. His comments were neutral, but they nevertheless triggered a strengthening of the euro across the market. At the press conference, Draghi talked about the improved economic performance seen across the European region. He also said that the regulator hadn’t discussed measures that might be taken in the near future or after September. He also gave no hint of the upcoming reversal of quantitative easing, but word from the regulator that the program’s future might be discussed in the autumn triggered a euro rally, pushing the rate up to 1.1570.

An hour later, the euro/dollar rate shot up to 1.1657. This was brought about by a weakening of the US dollar across the market. The dollar fell after it was revealed by Bloomberg that Robert Mueller, the man in charge of the probe investigating Russian interference in the US election, would start looking at Trump’s business dealings with Russia, as well as those of some of Trump’s close associates. After hitting its high, the euro corrected to 1.1618, after which the pair started trading flat.

Day’s news (GMT+3):

  • 11:30 UK: public sector net borrowing (Jun);
  • 15:30 Canada: CPI (Jun), CPI core (Jun), retail sales (May);
  • 20:00 USA: Baker Hughes US oil rig count.

EURUSD rate on the hourly. Source: TradingView

Mario Draghi probably didn’t imagine there would be such a reaction to his comments. With the single currency strengthening and with low oil prices, the ECB missed its inflation target. Draghi reiterated that the central bank could make the necessary changes to the QE program even if economic conditions get worse. No one has reversed QE yet, though, and euro bulls have already set themselves targets of 1.1826 and 1.2275.

This is understandable given that on Thursday; we saw a breakout of the trend line on the weekly timeframe. Brexit talks are not going particularly smoothly. Weak data is coming out of the US. Expectations of a further rate hike in the US this year have been reduced.

So, now is not the time to lay back. There are plenty of different potential developments under the current pricing model. I’ll now tell you about a couple of them. As trading opens in Europe, I’m expecting to see quotes rise to 1.1655. According to the pricing model, we should see the price exit the flat downwards towards the 45th degree, but the euro has strong support, so buyers are going to attack the 1.1650 level.

Why am I predicting a return to the 45th degree after growth? Firstly, the price rebounded from 1.16657, having hit the US moving averages line. The price receded by 1% from the LB. The U3 line is a strong resistance. After sharp growth, the price often enters a flat. Now I see a correction for the euro in the form of an a-b-c plane. Since there are very few economic events today, the price could go straight to the 45thdegree. If the rate drops below 1.16, we could see a lot of fixing of long positions, which would put pressure on the euro just before the weekend.

The price often returns to the LB from the U3 line. However, with strong support from the crosses before making this return, we could see the formation of an ending diagonal. Look at the price dynamics from the 18th of July. If the market starts to form a saw pattern, the immediate target will become 1.1677. Since today is Friday, I’m going to refrain from trading after yesterday’s rally.

Murray Math Analysis 20.07.2017 (AUD/USD, NZD/USD)

Article By RoboForex.com

AUD/USD

The AUD/USD pair holds within a resistance area above 8/8 level. For the time being, the pair is trying to break +1/8 level from top downwards. In case the price holds below this level, a downward move towards 8/8 (0.7812) can be expected, which can trigger a breakout of the above level and a further move towards 5/8 level (0.7446).

AUDUSD, Timeframe H4

H1-chart: price can rebound from the 5/8 (0.7873) level and once again rise to 6/8 (0.7934). And this level will be the decisive factor to form the subsequent movement. If the 6/8 is rebounded from, the price can move to 0.7446 level. If the 6/8 level is broken through, the market can resume rising higher.

AUDUSD, Timeframe H1

On the M15-chart the VoltyChannel lower edge has been broken, and this suggests a possible downward move of the currency pair.

AUDUSD, Timeframe M15

USD/CAD

The AUD/USD pair is trading above the resistance area above 8/8 level (0.7324). A breakout of the 8/8 level from top downwards will clear the way for a downward move towards 5/8 level (0.7141).

NZDUSD, Timeframe H4

The H1-chart shows that the price has failed to hold above 5/8 (0.7354) level and didn’t go higher. The breakout of the 5/8 level from top downwards makes it clear that the pair is weak enough and afterwards there can be a downward move towards 0.7141.

NZDUSD, Timeframe H1

The lower edge of VoltyChannel indicator has been broken (see M15 chart), and this suggests a further downward move of the currency pair.

NZDUSDM, Timeframe 15

Article By RoboForex.com

Attention!
Forecasts presented in this section only reflect the author’s private opinion and should not be considered as guidance for trading. RoboForex LP bears no responsibility for trading results based on trading recommendations described in these analytical reviews.