Author Archive for InvestMacro – Page 528

Japanese Candlestick Analysis 27.07.2017 (USDJPY, NZDUSD)

Article By RoboForex.com

USDJPY

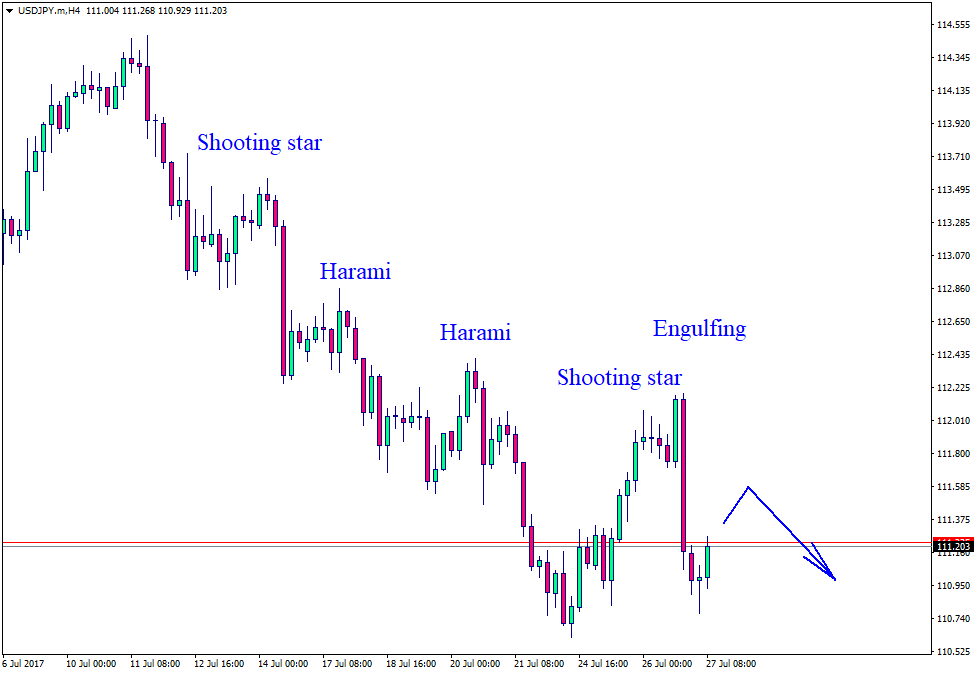
US dollar keeps declining against other currencies. The H4-chart shows that after being corrected, the pair continues to move lower, and this is confirmed by Harami, Shooting Star and Engulfing patterns.

USDJPY

NZDUSD

The Hammer, Engulfing, Tweezers, Inverted Hammer and Long-Legged Doji confirm the rising tendency. After a correction move the pair will move further towards a resistance level 0.7613.

NZDUSD

Article By RoboForex.com

Attention!
Forecasts presented in this section only reflect the author’s private opinion and should not be considered as guidance for trading. RoboForex LP bears no responsibility for trading results based on trading recommendations described in these analytical reviews.

3 charts, 3 forecasts, in 7 fast minutes

By Elliott Wave International

See just how much you can learn from three simple charts.


Oil, gold, ETFs & more: FREE pro-grade forecasts

Are you paying attention to commodities? You should be.

Major moves in oil, gold and other commodities have offered up huge opportunities for traders in 2017.

Now through July 28, get free, professional-grade forecasts for gold, oil, ETFs and more inside the new Commodity Hotlist

This article was syndicated by Elliott Wave International and was originally published under the headline 3 charts, 3 forecasts, in 7 fast minutes. EWI is the world’s largest market forecasting firm. Its staff of full-time analysts led by Chartered Market Technician Robert Prechter provides 24-hour-a-day market analysis to institutional and private investors around the world.

Japanese Candlesticks Analysis 26.07.2017 (AUDUSD, GOLD)

Article By RoboForex.com

AUDUSD

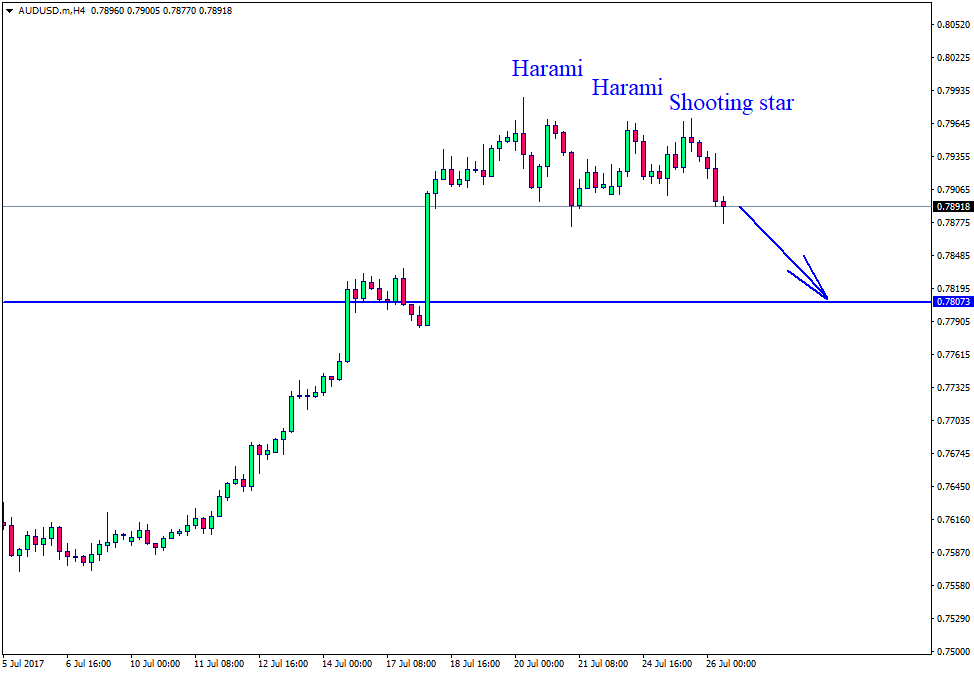
The pair has formed several Harami and Shooting Star candlesticks on its H4-chart. Bearing in mind those patterns were formed on highest values of the chart, the pair can move lower towards a support level 0.7807.

AUDUSD

GOLD

Gold has completed a correction move after a long upward move. Engulfing, Hammer, Long-Legged Doji and yet another Hammer have been formed on the H4-chart, and they suggest a further rise of the pair towards 1260.00 level.

GOLD

Article By RoboForex.com

Attention!
Forecasts presented in this section only reflect the author’s private opinion and should not be considered as guidance for trading. RoboForex LP bears no responsibility for trading results based on trading recommendations described in these analytical reviews.

Ichimoku Cloud Analysis 26.07.2017 (AUD/USD, NZD/USD, USD/CAD)

Article By RoboForex.com

AUD/USD

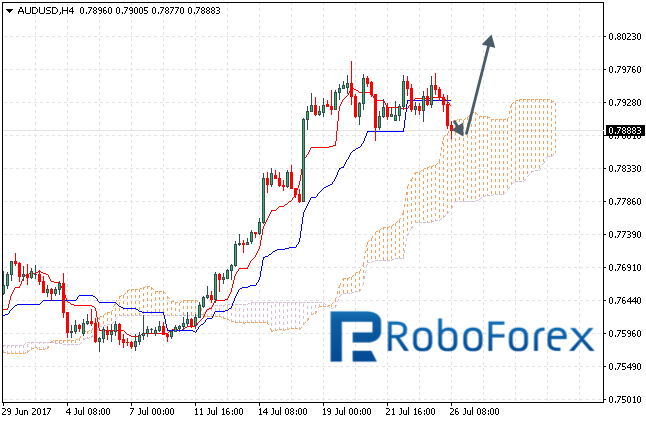
The AUD/USD pair is trading at 0.7888. The pair keeps trading above the Ichimoku cloud, and this suggests a rising tendency and further rise of the pair. The pair is testing the upper edge of Ichimoku cloud. Price can rebound from it and then can move hight towards 0.8020. If the lower edge of Ichimoku cloud is broken through and price closes below 0.7780, this will suggest further decline of the pair towards 0.7670 area.

AUDUSD

NZD/USD

The NZD/USD pair is trading at 0.7420 level. The pair keeps trading above the Ichimoku cloud, and this suggests a rising tendency and further rise of the pair. A test of the area of Ichimoku’s signal lines can be expected while price can also test a support level near 0.7395. After that the pair can move higher towards 0.7500. If the lower edge of Ichimoku cloud is broken through and price closes below 0.7330, this will suggest further decline of the pair towards 0.7255 area.

NZDUSD

USD/CAD

The USD/CAD pair is trading at 1.2513. The pair keeps trading below the Ichimoku cloud, and this suggests a downward tendency and further descending move of the pair. A test of the area of Ichimoku’s signal lines near 1.2565 can be expected. Then the pair can fall further towards 1.2415 area. If the upper edge of Ichimoku cloud is broken and price closes above 1.2710, this will suggest further rise of the pair towards 1.2870 area.

USDCAD

Article By RoboForex.com

Attention!
Forecasts presented in this section only reflect the author’s private opinion and should not be considered as guidance for trading. RoboForex LP bears no responsibility for trading results based on trading recommendations described in these analytical reviews.

EURUSD: awaiting a breakout of 1.1618 – 1.1626

By Gabriel Ojimadu, Alpari

Previous:

On Tuesday, trading on our currency pair closed slightly up. The daily candlestick has a bullish body of 6 pips, and a long upper shadow of 67 pips. In the first half of the day, buyers received a boost from Yves Mersch’s speech and the IFO report, which showed an increase in business activity in Germany for July. The pair hit a new one-year high thanks to a weakening of the dollar across the market and the activation of protective stop levels above 1.1685.

At 1.1712, buyers clearly met with some sell orders on the euro, which provoked a lot of traders to take profit on their long positions. By the end of the session, the euro had dropped to 1.1642.

ECB member Ewald Novotny’s speech, as well as US data, helped the dollar recover some of its losses. Novotny said that there’s no need to set a timeframe for completing bond purchases. Consumer confidence in the US came out higher than expected.

Day’s news (GMT+3):

  • 09:00 Switzerland: UBS consumption indicator (Jun);
  • 11:30 UK: GDP (Q2), BBA mortgage approvals (Jun), index of services (Jun);
  • 17:00 USA: new home sales (Jun);
  • 17:30 USA: EIA crude oil stocks change (21 Jul);
  • 18:30 EU: ECB’s Lautenschläger Speech;
  • 21:00 USA: Fed’s interest rate decision, Fed’s monetary policy statement.

EURUSD rate on the hourly. Source: TradingView

I allowed for the price to return to 1.1684 and was sure that sellers would defend that level until the Fed’s statement on monetary policy. Growth stopped at the 67th degree. Judging by the ricochet that took place at 1.1712, buyers must have met with some tempting offers. They provoked them to close their long positions, which had been opened above the 1.1685 resistance. This produced a nice trading volume for the time of day. When the euro bulls understood that they didn’t have the strength to grow further, they started cashing in on their positions, which triggered a drop in the rate to 1.1642 (-70 pips).

The US Senate has rejected Obamacare’s replacement. The new healthcare bill was supported by 43 senators, with 57 voting against, despite the fact that the Republican Party enjoys a 9-seat majority. There was no reaction to this on the market because this is exactly what it was expecting.

In Asia, the euro has dropped to 1.1633. On the chart, I’ve imposed a mirror image of the growth bars from 20-21st on July. Yesterday’s daily candlestick shows that the market is ready for a deep correction. All the price needs to do is break the support zone of 1.1618 – 1.1626.

On the hourly timeframe, due to yesterday’s growth to 1.17, a head has formed. Now, all we need is a right shoulder. As long as the price remains above 1.1618, there’s a high risk of 1.17 being tested again.

This evening, the US Fed will publish their monetary policy statement. No one is expecting an interest rate hike. The meeting will not be accompanied by an update of economic forecasts or a press conference. Some sharp fluctuations are possible depending on the Fed’s choice of words regarding rates and reducing the balance sheet.

Trump’s “First America” Trade Frictions Are About to Begin

By Dan Steinbock

After the US-Sino Comprehensive Economic Dialogue, trade issues are alienating not only China and America’s NATO allies – but its NAFTA partners, Canada and Mexico.

As the Trump administration’s first US-Sino Comprehensive Economic Dialogue (CED) ended in Washington, it could only agree on three no’s: canceled news conferences, no joint statement and no new announcements on market access by the US to China, or by China to the US.

A simple scenario is that the CED has paved way to a major trade conflict between the US and China. Yet, despite tough political rhetoric, economic realities do not seem to support such a view, at least yet.

A more nuanced scenario is that, while the Trump administration was willing to penalize the Sino-US economic dialogue over slow progress in deficit reduction and perhaps North Korea’s geopolitics, it also wanted to use the CED as a ‘demonstration effect’ in the impending NAFTA talks and trade reviews – to signal determination.

From trade pragmatism to friction

In fact, the shadows over the CED talks emerged a while ago. After the Trump-Xi Summit in early April, the US and China announced a 100-day Action Plan to improve strained trade ties between two nations. Yet, only two weeks later, Trump issued a Presidential Memorandum, which directed Ross to investigate the effects of steel imports on national security; on the basis of the Trade Expansion Act of 1962.

As Trump returned from his visit to France, he ramped up the heat. “They’re dumping steel and destroying our steel industry,” he said at the eve of the CED. “They’ve been doing it for decades, and I’m stopping it. There are two ways: quotas and tariffs. Maybe I’ll do both.”

While China’s US Ambassador Cui Tiankai warned the US on “troubling developments” that could derail the bilateral relationship, US Commerce Secretary Wilbur Ross added heat by stating that he would present Trump a range of options to restrict steel imports on national security grounds.

It was precisely those actions that Trump alluded to in his pre-CED statement, including imposing import quotas, license fees on imported goods, or negotiating more restrictive trade agreements.

What is important to understand is that the odd emergence of steel as a national security threat was not presented only as a bilateral Sino-US issue. Rather, it was offered as a multilateral challenge.

Steel as national security threat

As steel imports suddenly became an issue of “national security,” US Defense Secretary James Mattis was dragged into the debacle. And by mid-June, Europe’s NATO leaders joined in as well. They launched an extraordinary lobbying campaign against an anticipated US crackdown on steel imports, which, they said, would hit US allies more than China. Consequently, Mattis – not Commerce Secretary Ross – has been hearing the cases of apprehensive German and Dutch NATO leaders and passing on their concerns to the White House.

In the White House, the issue reignited the old divide between trade hawks – including Trump’s trade and industrial policy head Peter Navarro, trade representative Robert Lighthizer and trade advisor Dan DiMicco, former CEO of US steel giant Nucor – who are pushing for high import tariffs, and the more business-friendly former Goldman Sachs executives – Treasury Secretary Steven Mnuchin and National Economic Council’s chief Gary Cohn – who argue for restraint.

Washington’s European NATO allies do not buy the national security argument. Consequently, some EU leaders are ready for retaliation if the Trump administration will walk the talk.

In North America, US’s NAFTA partners have been monitoring the debacle very closely. If the Trump administration plans to use steel as a national security threat, Canada and Mexico understand quite well that the real focus will soon be more on NAFTA rather than just China or Germany.

Today China produces almost half of the world’s steel, but its US market share in steel is marginal; less than 2%. In America, the largest steel importers include Washington’s NAFTA partners, Canada (almost 17%) and Mexico (nearly 9%), East Asian giants South Korea (12%) and Japan (nearly 7%), as well as Brazil, Turkey, Russia, Germany, Taiwan, Vietnam – and only then China.

So if Trump really is “hell-bent on imposing” major tariffs on steel, it is America’s NAFTA partners that will be the first to feel the heat. But if Trump plans to move further to imported aluminum, semiconductors, paper, household appliances, that’s when China and other major importers will become targets as well.

What next and when?

Recently, Commerce Secretary Wilbur Ross seemed to be pushing for a trade war over steel in a closed-door meeting with Senate Finance Committee members, but he did not put a time frame on his review’s release. Officially, he has 270 days to submit a report to Trump – which means anytime between soon or by late fall.

Now, if Ross finds that steel imports threaten to impair US national security, Trump must determine within three months whether he concurs with Ross’s findings; and what actions should be taken.

However, the highly-anticipated NAFTA talks will move ahead faster. According to the US Trade Representative (USTR) Lighthizer’s recently-released negotiating goals, the main objective is to reduce US trade deficit. What free-trade advocates find distressing is that USTR’s goals reveal little about such flashpoints as dispute-settlement mechanism, intellectual property, and rules of origin. What they see as reassuring is that the USTR’s objectives build on existing agreements, including WTO measures and some elements of the Trans-Pacific Partnership agreement (which Trump buried during his first day in the office).

Nevertheless, the NAFTA talks are likely to prove long and confrontational. And even more importantly, the NAFTA objectives are likely to be deployed as a template not just for other pending trade reviews (particularly South Korea), but with perceived “deficit offenders” in Europe (especially Germany) and Asia (China, but also Japan).

The planned steel import tariffs are likely to illustrate the White House’s effective objectives. During his campaign, Trump spoke about 45% import tariffs. In the past few months, his team has floated the idea of 10% tariffs. But in a recent White House meeting with some 22 leading officials, Trump made clear that he would be willing to impose 20% tariffs, even if almost 20 of those officials were against the idea.

If that’s the case, why would Trump be so willing to against the mainstream?

Timing matters

President Trump’s focus has never been on the middle-of-the-road of America, but on those constituencies that made possible his win through the Electoral College and on his campaign objectives that these constituencies supported – particularly “America First” trade policy predicated on deficit targeting.

And timing is even more important. In the past few months, Republicans have failed twice to repeal the Obamacare and the Trump administration’s tax reforms have stalled in the Congress.

In the medium-term, the Special Counsel Mueller’s investigation may seek to undermine Trump’s political future. In the short-term, it will complicate any reforms that require support by the Congress. However, the investigation is less likely to tie Trump’s hands in trade policy, which can be built on executive powers.

And perhaps that’s why President Trump was willing to ramp up the heat in the first Sino-US economic dialogue. He needs perceived short-term wins to appease his constituencies and to restore the administration’s credibility – even if it means alienating America’s longstanding NATO partners in Europe, NAFTA partners in North America, East Asian partners Japan and South Korea – and China.

About the Author:

Dr Dan Steinbock is the founder of Difference Group and has served as research director at the India, China and America Institute (USA) and visiting fellow at the Shanghai Institutes for International Studies (China) and the EU Center (Singapore). For more, see https://www.differencegroup.net/ 

The original version was released by China-US Focus on July 25, 2017.
 

Japanese Candlesticks Analysis 25.07.2017 (EURUSD, USDCAD)

Article By RoboForex.com

EURUSD

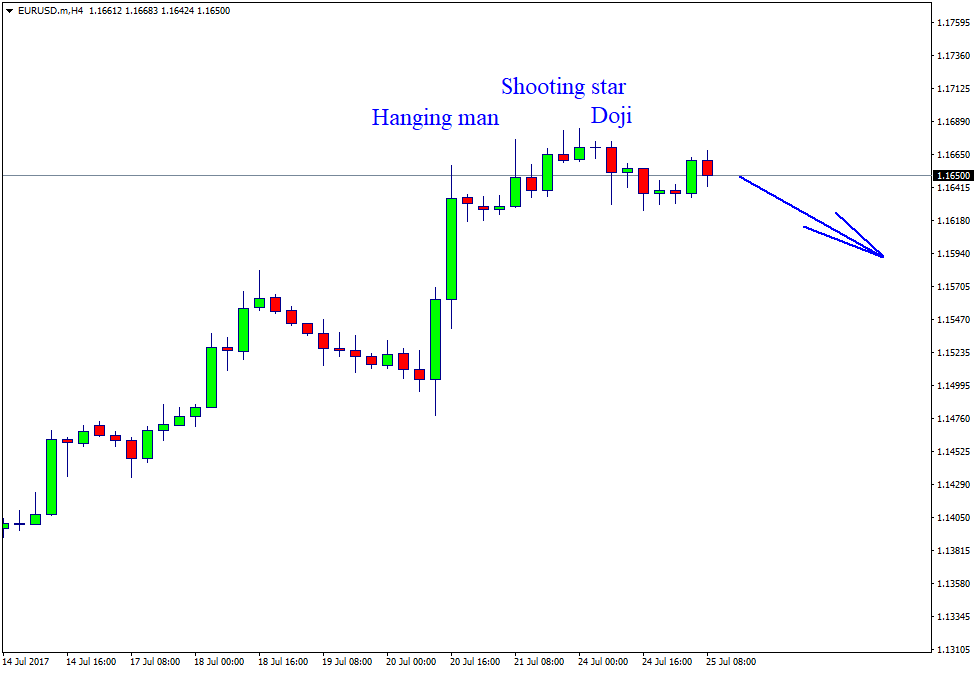
Having come close to the highs, the pair has stopped and formed several reversal patterns: Hanging Man, Shooting Star and Doji. The said candlestick patterns suggest the price can rebound towards the support level 1.1600.

EURUSD

USDCAD

On the H4-chart the pair is still declining, and this is confirmed by a number of consequent patterns Engulfing and Shooting Star. At the moment we see a correction move which can bring the pair to 1.2556 level.

USDCAD

Article By RoboForex.com

Attention!
Forecasts presented in this section only reflect the author’s private opinion and should not be considered as guidance for trading. RoboForex LP bears no responsibility for trading results based on trading recommendations described in these analytical reviews.

Forex Technical Analysis & Forecast 25.07.2017 (EUR/USD, GBP/USD, USD/CHF, USD/JPY, AUD/USD, USD/RUB, GOLD, BRENT)

Article By RoboForex.com

The EUR/USD pair has completed a descending wave. At the moment the market is developing a rising structure. This structure can be deemed as a correction move. It is expected that a Flag will be formed of five waves. For today, we’d consider a move towards the 1.1646 level. Then the pair can move highet towards 1.1666. Yet another scenario is a third wave to break through the 1.1620 level. The local target stands at 1.1584. It is not improbable that the price can spike towards 1.1689. After that it can go lower to reach and break through 1.1620.

EURUSD

The GBP/USD pair has completed an ascending wave in form of a Flag for the descending Flagpole. For today we’d consider a possible breakout of the rising channel. The first target stands on 1.2985. Therefore, we are considering a consolidation range to be formed. If it is broken from top downwards, a descending wave towards 1.2948 is possible. If the price breaks out of the range from bottom upwards, it can go higher towards 1.3123.

GBPUSD

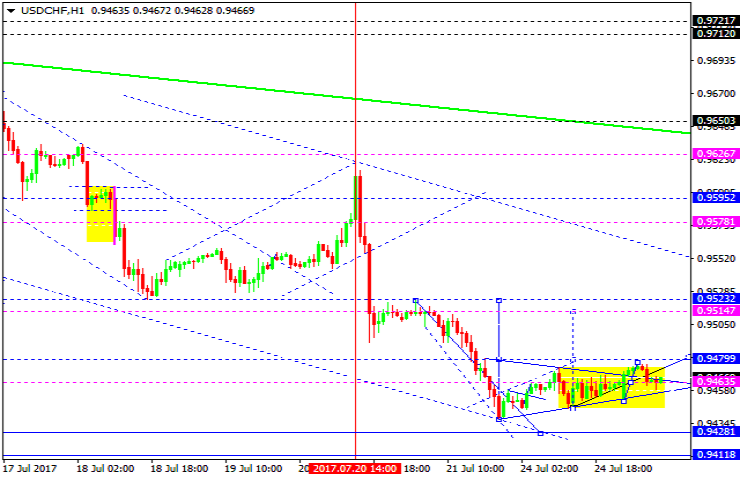
The USD/CHF pair is trading within a rising structure towards 0.9480. As the next move, we are expecting a downwards leg towards 0.9463. If the range is broken from bottom upwards, an ascending move towards 0.9514 is possible. In case the price breaks out of the range from top downwards, the market can go lower to reach 0.9428. After that it can climb towards 0.9520.

USDCHF

The USD/JPY pair keeps developing it descending wave. A new consolidation range has appeared and formed its borders. If the lower edge of it is broken, the price can move towards 110.19. If the upper border of the range is broken, a correction move towards 111.89 can occur.

USDJPY

The AUD/USD pair keeps trading within the consolidation range on top of the ascending wave. A downward move to 0.7852 is expectable. Then the pair can climb higher towards 0.7920. After that it can decline to reach 0.7780.

AUDUSD

The USD/RUB pair has broken through the consolidation range from bottom upwards and completed the calculated move towards 60.00. A downward move towards 59.43 is possible. The basic scenario for the pair is the downtrend to go further to reach the 57.70 level.

USDRUB

Gold is trading within a tight consolidation range on top of the ascending wave. For today we’d consider a possible break out of this range from bottom upwards to reach 1260.50. If the range is broken from top downwards, a correction move towards 1232.55 is broken.

GOLD

Oil is trading moderately higher trying hard to climb. For today we’d consider the level 49.40 to be reached and broken. Another scenario is a downward move towards 47.40. This will be the end of the correction move in our opinion. After that a rise towards 50.65 is possible.

BRENT

Article By RoboForex.com

Attention!
Forecasts presented in this section only reflect the author’s private opinion and should not be considered as guidance for trading. RoboForex LP bears no responsibility for trading results based on trading recommendations described in these analytical reviews.

EURUSD: downwards correction incomplete

By Gabriel Ojimadu, Alpari

Previous:

Trading on the euro closed down on Monday. The US dollar rose slightly against the dollar in the wake of a partial closing of long positions.

The euro/dollar rate has fallen to the 45th degree at 1.1626 and stabilised beneath the LB balance line. Price fluctuations are fairly restrained given that trader attention is fixed on the outcome of the FOMC’s meeting on Wednesday.

US statistics:

  • Existing home sales in the US in June came to 5.52 million (forecast: 5.57m, previous reading: 5.62m).
  • The Markit services PMI for July came to 54.2 (forecast: 54.2, previous reading: 54.2).
  • The Markit manufacturing PMI for July came to 53.2 (forecast: 52.3, previous reading: 52.0).

Day’s news (GMT+3):

  • 09:00 Germany: import price index (Jun);
  • 11:00 Germany: IFO business climate (Jul);
  • 13:00 UK: CBI industrial trends survey (Jul);
  • 16:00 USA: housing price index (May), S&P/Case-Shiller home price indices (May);
  • 17:00 USA: Richmond Fed manufacturing index (Jul);
  • 20:00 UK: MPC member Haldane’s speech.

EURUSD rate on the hourly. Source: TradingView

From its high of 1.1684, the euro rate has corrected by 45 degrees. It turned out to be strong, as sellers failed 4 times to break through it. In Asia, the euro’s restored to 1.1663. The euro’s rise was facilitated by ECB Executive Board member Yves Mersch’s speech in Singapore, in which he touched on the Eurozone’s economic recovery.

From 1.1626 upwards, a beautiful three-wave correction has formed. On the chart, I’ve shown the sinusoidal decline cycle to 1.1603 (67 degrees). This is the ideal scenario for today as we await the results of the Fed’s July meeting. The meeting is unlikely to be accompanied by any renewed economic forecasts or press conferences, so its effect will be limited to the currency market. The Stochastic is in the sell zone, so it would be nice to see this correctional movement continue and see the third wave complete its formation. If the price consolidates below 1.1617, then sellers may take 1.1575 as a target. This correction will get stronger after a sustained rally for the euro.

Azarga Metals Corp., Oversold Copper/Silver Junior?

By Peter Epstein, CFA, MBA    http://EpsteinResearch.com

Silver (“Ag“) junior stocks have been destroyed over the past 3 months through July 17th.  Not even companies (near to) or in production have been spared.  Of course, the Ag price is the main reason for the carnage, it’s down 13.4% over the period.  While 13% might not seem like a disaster, it is compared to Gold (“Au“) [down 4.5% and Copper (“Cu“) up ~5% since April 17th].  In the past several days, the Ag price has settled in, now ~US$16.20/oz., and some pundits are saying that select juniors are significantly oversold.

A name I believe to be oversold is Azarga Metals Corp.  [TSX-V: AZR].  Not only is it off ~30% in 3 months, it was (and still is) under-appreciated to begin with.  More tangibly, Azarga’s flagship project is roughly 50/50 Cu & Ag and, as mentioned, the Cu price is up ~5% since mid April.  There’s no good reason for AZR to be trading off more than the average Ag focused junior!  {I estimate the average Ag junior was down ~20% from April 17-July 17}

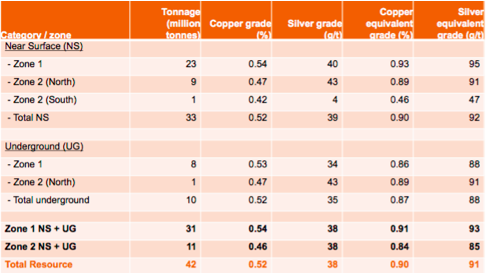
Azarga is a [C$7.5 M / US$5.9 M] market cap company listed on the TSX-V (ticker: AZR).  It owns 60% [+ a call option on the remaining 40%] of the Unkur Copper-Silver project in eastern Russia, a project Interest it acquired 16 months ago.  In April the Company delivered a maiden NI 43-101 Mineral Resource estimate (“MRE“) of 42 Million metric tonnes (“Mt“) of 0.52% Cu and 38 g/t Ag — containing approximately 840 M Inferred pounds Cu Eq., or 124 M Inferred troy ounces Ag Eq.  The MRE was established quickly and cost effectively.

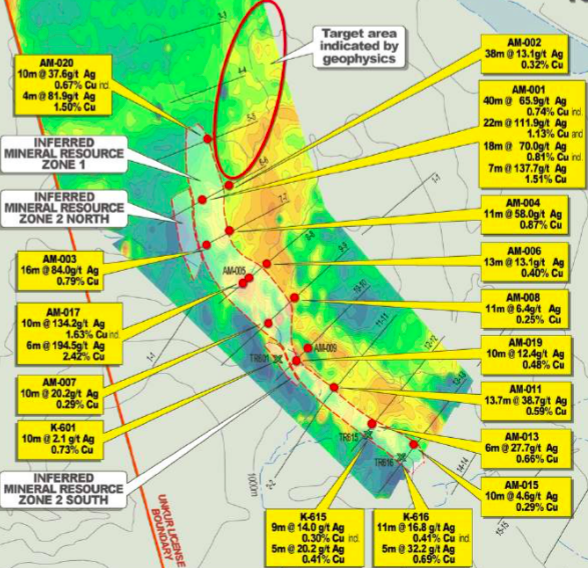
The first modern exploration program, conducted from Aug. 2016 – Feb. 2017, consisted of 16 diamond core drill holes (4,580 m), plus 4 trenches and sampling of various outcrops, tested a strike length of 3,400 m.  In the map below, the red oval is an area of key interest, a zone of thicker and higher grade mineralization (confirmed by a ground magnetics survey) in the northern part of the Resource area.

Unkur is a high-grade deposit that was actively explored in the 1960s / 1970s, including drilling & trenching during the Soviet era.  It has had several mineral resource estimates done on it, but none were (are) NI 43-101 compliant.  [Corporate Presentation].

Four important features of the Resource are; (1) most of it (79%) is near surface, including two higher grade pods of mineralization.  These pods could be amenable to low-cost open pit mining and could be mined earlier in a prospective mine plan, (2) mineralization is open in both directions along strike and down dip, (3) there’s now thought to be more than one layer of ore, not just a single mineralized zone, and (4) the MRE only covers about half the known strike length.

In an excellent Proactive Investors interview of CEO, President & Director Dusty Nicol in June, he stated that a potential doubling in size of the MRE was possible from the next drill campaign slated to start in August.  A doubling in size and a likely increase in grade.  He noted that the historic Soviet resource (not NI 43-101 compliant) of ~165 Mt is about 4 times the size of the MRE.  New work done by the Company so far seems to indicate that the Soviet era data erred on the side of conservatism on both size and grade.  Management continues to methodically validate the historical resource and is excited by results to date.

Regarding the opportunity to double the size of the MRE, Dusty thinks it could grow by a third or more from routine step-out drilling, connecting two known pods of mineralization in zone 2.  And, if step-out drilling is successful in extending strike length by several hundred meters, there’s tonnage underneath the pit bottom that could be included in an updated resource later this year.  The technical team, armed with a better understanding of what controls the distribution of high-grade Cu & Ag mineralization, is optimistic they can increase the overall grade by targeting geophysical anomalies to the North and Northeast.  After raising exploration capital, drilling is expected to start in August.

The second phase of exploration will be carried out during the 2017-2018 field season and will focus on the potential for discovery of additional Cu /Ag mineralization from 3 target concepts: (i) drilling along strike or down dip; (ii) drilling to confirm additional mineralized zone(s) postulated to occur stratigraphically below currently defined Zones 1 & 2; and (iii) drilling new targets expected to be generated by geophysical surveys.  The plan comprises geophysical exploration; {continuation of ground magnetics and initiation of electrical prospecting to the north and northeast of the currently defined resource} near-resource drilling; {8 diamond drill holes totaling 2,370 m} new target drilling; {~1,500 m of additional diamond drilling} and metallurgical characterization.CEO Nicol commented in June,

“Our objective this year will be to at least double the size of the current Resource while increasing overall Cu & Ag grades.  Some of this increase is expected to come from step out drilling near the current Resource footprint.  The remainder of the anticipated new Resource is expected to come from drilling of new targets from geophysics.  Several such new targets have already been identified and drilling will focus on near-surface, high-grade targets as they’re identified.”

If the Company could double the size of the Resource to [840 M x 2 = 1.68 B lbs. Cu Eq.], it would be trading at just US$0.007 per lb. (net to Azarga) of Cu Eq. in the ground.  {adjusted for Azarga’s 60% ownership of the Unkur project}

Dusty is fluent in 5 languages and has worked in 70 countries, he stated that access to infrastructure is better at Unkur than in 90% of the places he’s worked.  He’s worked in really hard places in terms of terrain, weather and permitting, but Unkur’s location in eastern Russia is not expected to be challenging.  Dusty has no trouble getting to site or getting rigs in.  With the initial tonnage and grade and good infrastructure — less than 8 km from rail, direct rail to Vladivostok (a Pacific Ocean port) and Chinese smelters, power & groundwater onsite, — this next phase of exploration will support the work needed for a third-party NI 43-101 PEA or internal scoping study to be delivered in the Spring of 2018.

The project location has one advantage that few are talking about, namely a package of incentives provided to promote investment in Russia’s far east.  There are tax incentives and royalty reductions, but the most important thing is the Far East Development Fund (“FEDF”), a development bank specifically set up for the region.  It offers debt & equity funding and loan guarantees on preferential terms for projects such as Unkur.  Azarga has a strong presence in Russia, it has boots on the ground.  The entire technical team at site and administrative team in the city of Chita is Russian, and a significant percentage of the Company’s shareholder base is Russian.

Catalysts over the remainder of the year include; drill results, results from geophysics and metallurgical testing, and a new Resource estimate.  A PEA or internal scoping study is expected in the Spring of 2018.  Readers are encouraged to check out this 12-minute video interview of CEO Nicol to learn more about the Company and its plans for the remainder of the year.

Disclosures: The content of this article is for information only. Readers fully understand and agree that nothing contained herein, written by Peter Epstein of Epstein Research [ER](together, [ER]) about Azarga Metals Corpincluding but not limited to, commentary, opinions, views, assumptions, reported facts, calculations, etc. is to be considered implicit or explicit investment advice. Nothing contained herein is a recommendation or solicitation to buy or sell any security. [ER] is not responsible under any circumstances for investment actions taken by the reader. [ER] has never been, and is not currently, a registered or licensed financial advisor or broker/dealer, investment advisor, stockbroker, trader, money manager, compliance or legal officer, and does not perform market making activities. [ER] is not directly employed by any company, group, organization, party or person. The shares of Azarga Metals Corp. are highly speculative, not suitable for all investors. Readers understand and agree that investments in small cap stocks can result in a 100% loss of invested funds. It is assumed and agreed upon by readers that they will consult with their own licensed or registered financial advisors before making any investment decisions.

At the time this article was posted, Peter Epstein owned shares and stock options in Azarga Metals and the Company was an advertiser on [ER].Readers understand and agree that they must conduct their own due diligence above and beyond reading this article. While the author believes he’s diligent in screening out companies that, for any reasons whatsoever, are unattractive investment opportunities, he cannot guarantee that his efforts will (or have been) successful. [ER] is not responsible for any perceived, or actual, errors including, but not limited to, commentary, opinions, views, assumptions, reported facts & financial calculations, or for the completeness of this article or future content. [ER] is not expected or required to subsequently follow or cover events & news, or write about any particular company or topic. [ER] is not an expert in any company, industry sector or investment topic.