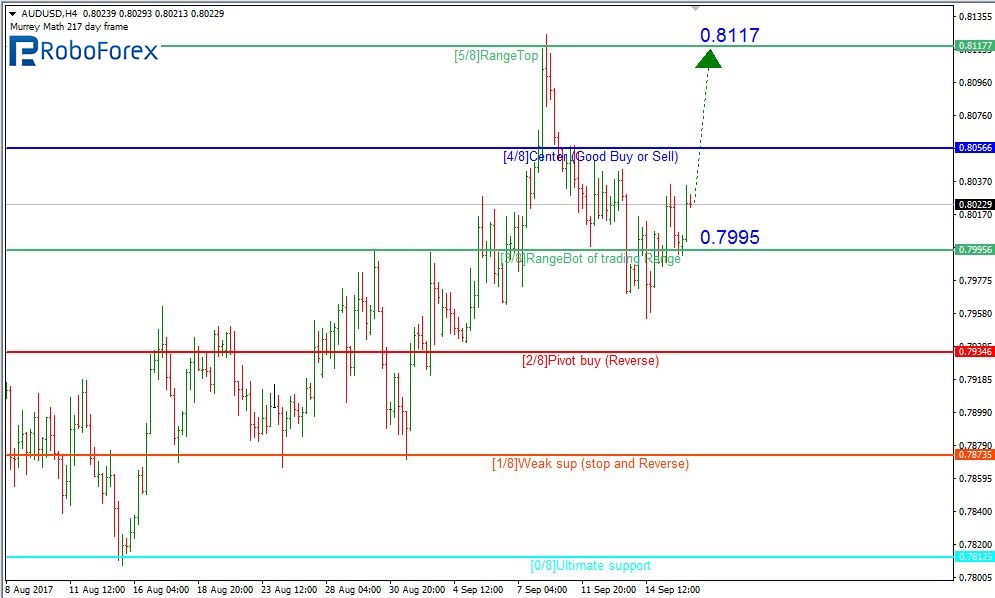
As we can see at the H4 chart, the AUD/USD pair has rebounded from the 3/8 level at 0.7995. Later, the price is expected to resume growing towards the 5/8 level at 0.8117.
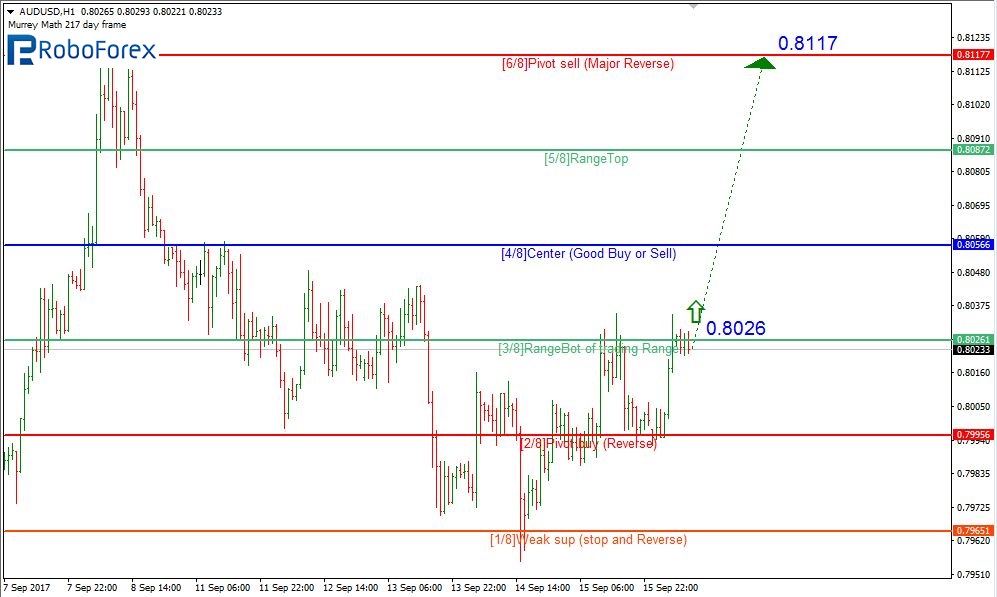
At the H1 chart, the price may continue growing to reach 0.8117 if it fixes above the 3/8 level at 0.8026.
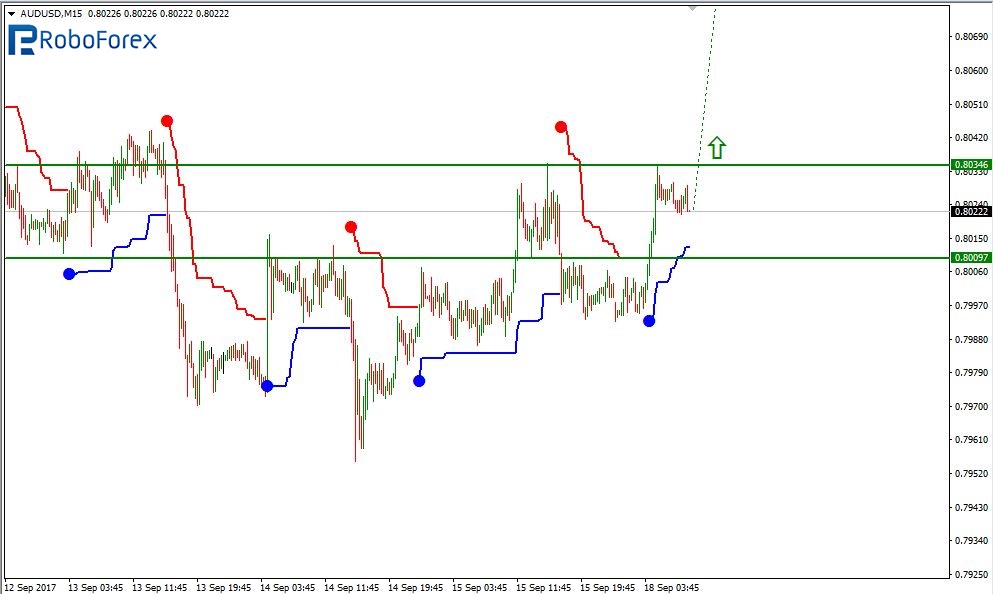
As we can see at the M15 chart, the price has broken the upside line of the VoltyChannel indicator. As a result, the pair may continue growing towards 0.8117.
GBP CAD, “Great Britain Pound vs Canadian Dollar”
At the H4 chart, the GBP/CAD pair is trading close to the resistance at the 8/8 level (1.6601). Later, the price is expected to test this level, rebound from it, and then continue falling to reach the 5/8 one at 1.6235.
The lines at the H4 and H1 charts are completely the same. The scenario is similar to the one described above.
At the M15 chart, the price may break the downside line of the VoltyChannel indicator and, as a result, continue falling towards 1.6235.
Attention! Forecasts presented in this section only reflect the author’s private opinion and should not be considered as guidance for trading. RoboForex LP bears no responsibility for trading results based on trading recommendations described in these analytical reviews.
3 Videos + 8 Charts = Opportunities You Need to See.
Join this free event hosted by Elliott Wave International and you’ll get a clear picture of what’s next in a variety of U.S. markets. After seeing these videos and charts you will be ready to jump on opportunities and sidestep risks in some major markets. This free report (a $29 value) will present a unique outlook and give you a new perspective on the markets you won’t get anywhere else.
This article was syndicated by Elliott Wave International and was originally published under the headline Believe Your Own Eyes: Central Banks FOLLOW the Market. EWI is the world’s largest market forecasting firm. Its staff of full-time analysts led by Chartered Market Technician Robert Prechter provides 24-hour-a-day market analysis to institutional and private investors around the world.
US Dollar Index Non-Commercial Speculator Positions:
Large speculators pared some of their bearish net positions in the US Dollar Index futures markets this week, according to the latest Commitment of Traders (COT) data released by the Commodity Futures Trading Commission (CFTC) on Friday.
The non-commercial futures contracts of US Dollar Index futures, traded by large speculators and hedge funds, totaled a net position of -2,191 contracts in the data reported through Tuesday September 12th. This was a weekly rise of 1,753 contracts from the previous week which had a total of -3,944 net contracts.
US dollar index speculative level had fallen the previous two weeks before this week’s slight turnaround. The US dollar index net positions have now remained in bearish territory for eight straight weeks.
US Dollar Index Commercial Positions:
The commercial traders position, categorized by the CFTC as hedgers or traders engaged in buying and selling for business purposes, totaled a net position of -3,725 contracts on the week. This was a weekly drop of -1,072 contracts from the total net of -2,653 contracts reported the previous week.
UUP:
Over the same weekly reporting time-frame, from Tuesday to Tuesday, the UUP ETF, which tracks the price of US Dollar Index, closed at approximately $23.85 which was a drop of $-0.10 from the previous close of $23.95, according to unofficial market data.
*COT Report: The COT data, released weekly to the public each Friday, is updated through the most recent Tuesday (data is 3 days old) and shows a quick view of how large speculators or non-commercials (for-profit traders) as well as the commercial traders (hedgers & traders for business purposes) were positioned in the futures markets. The CFTC categorizes trader positions according to commercial hedgers (traders who use futures contracts for hedging as part of the business), non-commercials (large traders who speculate to realize trading profits) and nonreportable traders (usually small traders/speculators). Find CFTC criteria here: (http://www.cftc.gov/MarketReports/CommitmentsofTraders/ExplanatoryNotes/index.htm).
Large currency speculators advanced their net positions in the Russian Ruble futures markets this week, according to the latest Commitment of Traders (COT) data released by the Commodity Futures Trading Commission (CFTC) on Friday.
The non-commercial futures contracts of Russian Ruble futures, traded by large speculators and hedge funds, totaled a net position of 5,232 contracts in the data reported through Tuesday September 12th. This was a weekly increase of 4,746 contracts from the previous week which had a total of 486 net contracts.
Ruble speculative positions improved for a fourth week and are in bullish territory for a second consecutive week after a stay of ten straight weeks in bearish territory.
Russian Ruble Commercial Positions:
The commercial traders position, categorized by the CFTC as hedgers or traders engaged in buying and selling for business purposes, totaled a net position of -5,733 contracts on the week. This was a weekly loss of -4,796 contracts from the total net of -937 contracts reported the previous week.
RUBUSD:
Over the same weekly reporting time-frame, from Tuesday to Tuesday, the RUBUSD Currency Pair closed at approximately $0.0173 which was a decrease of $0.0001 from the previous close of $0.0174, according to unofficial market data.
*COT Report: The COT data, released weekly to the public each Friday, is updated through the most recent Tuesday (data is 3 days old) and shows a quick view of how large speculators or non-commercials (for-profit traders) as well as the commercial traders (hedgers & traders for business purposes) were positioned in the futures markets. The CFTC categorizes trader positions according to commercial hedgers (traders who use futures contracts for hedging as part of the business), non-commercials (large traders who speculate to realize trading profits) and nonreportable traders (usually small traders/speculators). Find CFTC criteria here: (http://www.cftc.gov/MarketReports/CommitmentsofTraders/ExplanatoryNotes/index.htm).
As the White House is about to escalate trade friction in intellectual property, it has opted for a flawed, partisan approach.
In mid-August, President Trump asked U.S. Trade Representative Robert Lighthizer, a veteran Reagan administration trade hawk, to open an investigation into China’s intellectual property (IP) practices.
The first public hearing about Chinese trade conduct is scheduled for October 10 in Washington.
The White House IP narrative
As Lighthizer initiated the investigation, he seized the notorious Section 301 of the Trade Act of 1974, which in the 1980s was used against the rise of Japan and which Japan and the EU regarded as a violation of the rules of the World Trade Organization (WTO). Instead of free trade, it represents “aggressive unilateralism” and authorizes retaliatory tariffs.
Lighthizer draws from the highly partisan US Commission on the Theft of American Intellectual Property, which was mobilized in the early 2010s – amid the rise of China’s indigenous innovation and foreign investment.
Relying on contested estimates, the Commission believes that IP theft amounts to $225-600 billion annually in counterfeit goods, pirated software, and theft of trade secrets. As a result, it advocates more aggressive policy enforcement “to protect American IP.”
Essentially, the US IP narrative claims that Chinese government forces US companies to relinquish its IP to China. The narrative is consistent with Trump’s “America First” stance and it has been quoted, referenced and echoed uncritically by media.
Nevertheless, it is deeply flawed.
The real IP narrative
While foreign companies in China are often warned not to part with “too much” in technology transfer and IP deals, they are not forced by the Chinese government or other interested parties into those deals.
Moreover, in contested legal cases, the Chinese government has often supported foreign companies. As the Wall Street Journal reported last year, when foreign companies sue in Chinese courts, they typically win. From 2006 through 2014, foreign plaintiffs won more than 80% of their patent-infringement suits against Chinese companies, virtually the same rate as domestic plaintiffs.
For years, foreign multinationals have effectively exchanged their technology expertise for market share in China. The rush of IP companies to China intensified a decade ago amid the global crisis, when the Silicon Valley giant Intel opened a $2.5 billion wafer fabrication foundry in Dalian, northeast China. As advanced economies struggled with stagnation, China continued to grow vigorously. So the bet proved very lucrative. At the time, Intel’s chairman was Craig Barrett. Today Barrett is one of the five commissioners of the US IP Commission which portrays America as a victim of massive IP fraud.
Not surprisingly, some US observers see the Trump administration’s IP investigation as less a scrutiny of forced technology transfers than a negotiation ploy.
In reality, much of China’s IP progress can be attributed to past technology transfers and the government’s huge investment in science and technology. And as Chinese companies have moved up the value-added chain, they stress the need for IP protection, particularly patents.
Timing matters
Already in 2006, I noted in the prestigious US foreign policy journal The National Interest that emerging Chinese multinationals were “no longer satisfied with imitating. Instead, they seek to convert cost advantages to more sustainable competitive advantages—often through innovation.” At the time, few took the prediction seriously.
Typically, the Trump IP debacle is escalating as Chinese companies join the global rivalry for cutting-edge innovation. In terms of the number of total patent applications, China’s share has exploded. Two decades ago, it was far behind the US, Japan, South Korea and Germany; the world’s leading patent players. Now it is ahead of all of them (Figure 1).
Figure 1 Total patent applications, 1985-2014 (WIPO)
But in these rivalries, not all patents are of equal value. The so-called triadic patents, which are registered in the US, EU, and Japan to protect the same invention, tend to be the most valuable commercially and globally.
In triadic patents, too, China’s patent power has increased dramatically and will surpass that of Korea and Germany soon. The patents of Japan and the US peaked around 2005-6. Despite some progress, US patents are still 15% below their peak, whereas those of China have increased more than sixfold in the past decade (Figure 2).
Since patent competition is accumulative, catch-up requires time. But here’s the thing: If, for instance, US and Chinese triadic patents would increase in the future as they have in the past five years, China could surpass the US by the late 2020s. And perhaps that’s why Trump is targeting China’s IP today.
However, neither innovation nor intellectual property are an exclusive privilege of the West.
About the Author:
Dr Dan Steinbock is the founder of Difference Group and has served as research director at the India, China and America Institute (USA) and visiting fellow at the Shanghai Institutes for International Studies (China) and the EU Center (Singapore). For more, see https://www.differencegroup.net/
A slightly shorter version was published by China Daily on September 15, 2017
US Dollar net speculator positions leveled at $-11.57 billion as of Tuesday
The latest data for the weekly Commitment of Traders (COT) report, released by the Commodity Futures Trading Commission (CFTC) on Friday, showed that large traders and currency speculators added to their bearish bets for the US dollar this week. See full article
The non-commercial contracts of WTI crude futures totaled a net position of 374,480 contracts, according to data from last week. This was a slide of -7,633 contracts from the previous weekly total. See full article
The large speculator contracts of gold futures totaled a net position of 254,760 contracts. This was a weekly advance of 9,462 contracts from the previous week. See full article
The large speculator contracts of 10-year treasury note futures totaled a net position of 251,679 contracts. This was a weekly increase of 29,873 contracts from the previous week. See full article
The large speculator contracts of S&P 500 futures totaled a net position of -5,839 contracts. This was a decrease of -1,811 contracts from the reported data of the previous week. See full article
The non-commercial contracts of silver futures totaled a net position of 74,987 contracts, according to data from last week. This was a weekly gain of 10,816 contracts from the previous totals. See full article
The large speculator contracts of copper futures totaled a net position of 46,614 contracts. This was a weekly shortfall of -2,251 contracts from the data of the previous week. See full article
The Commitment of Traders report data is published in raw form every Friday by the Commodity Futures Trading Commission (CFTC) and shows the futures positions of market participants as of the previous Tuesday (data is reported 3 days behind).
US Dollar net speculator positions now at $-11.57 billion this week
The latest data for the weekly Commitment of Traders (COT) report, released by the Commodity Futures Trading Commission (CFTC) on Friday, showed that large traders and currency speculators added to their bearish bets for the US dollar this week.
Non-commercial large futures traders, including hedge funds and large speculators, had an overall US dollar short position totaling $-11.57 billion as of Tuesday September 12th, according to the latest data from the CFTC and dollar amount calculations by Reuters. This was a weekly decline of $-0.68 billion from the $-10.89 billion total short position that was registered the previous week, according to the Reuters calculation (totals of the US dollar contracts against the combined contracts of the euro, British pound, Japanese yen, Australian dollar, Canadian dollar and the Swiss franc).
The US dollar aggregate position has now fallen for four consecutive weeks and for eleven out of the past twelve weeks to a new low level since 2013. At this time, the USD position has been in bearish territory for nine straight weeks after turning bearish on July 18th.
Weekly Speculator Contract Changes:
The individual major currencies saw two weekly changes above the (+ or -) 10,000 contract mark this week in the speculators category.
Japanese yen bets jumped by over +15,000 contracts this week and speculators have now been in favor of the JPY for seven out of the last eight weeks. Yen positions are still in bearish territory but have come back a long ways from the most extreme bearish levels of July (-126,919 contracts) to be in the least bearish position since June (-49,959 contracts).
Euro bets dropped by over -10,000 bets this week after a similar gain last week. Overall, euro bets are in a very bullish standing just off the highest level of the year which was registered just last week at +96,309 net contracts.
Overall, the major currencies that improved against the US dollar last week were the British pound sterling (6,842 weekly change in contracts), Japanese yen (15,648 contracts), Swiss franc (857 contracts) and the Mexican peso (3,386 contracts).
The currencies whose speculative bets declined last week versus the dollar were the euro (-10,251 weekly change in contracts), Canadian dollar (-3,145 contracts), Australian dollar (-1,871 contracts) and the New Zealand dollar (-2,373 contracts).
Table of Weekly Commercial Traders and Speculators Levels & Changes:
Currency
Net Commercials
Comms Weekly Chg
Net Speculators
Specs Weekly Chg
EuroFx
-116,185
4,483
86,058
-10,251
GBP
44,469
-7,776
-46,085
6,842
JPY
67,502
-10,730
-57,297
15,648
CHF
5,208
-499
-1,314
857
CAD
-74,071
-2,721
50,499
-3,145
AUD
-83,253
-64
63,033
-1,871
NZD
-14,544
1,980
12,350
-2,373
MXN
-123,118
-3,759
116,998
3,386
This latest COT data is through Tuesday and shows a quick view of how large speculators or non-commercials (for-profit traders) as well as the commercial traders (hedgers & traders for business purposes) were positioned in the futures markets. All currency positions are in direct relation to the US dollar where, for example, a bet for the euro is a bet that the euro will rise versus the dollar while a bet against the euro will be a bet that the dollar will gain versus the euro.
Weekly Charts: Large Trader Weekly Positions vs Price
EuroFX:
British Pound Sterling:
Japanese Yen:
Swiss Franc:
Canadian Dollar:
Australian Dollar:
New Zealand Dollar:
Mexican Peso:
*COT Report: The weekly commitment of traders report summarizes the total trader positions for open contracts in the futures trading markets. The CFTC categorizes trader positions according to commercial hedgers (traders who use futures contracts for hedging as part of the business), non-commercials (large traders who speculate to realize trading profits) and nonreportable traders (usually small traders/speculators). Find CFTC criteria here: (http://www.cftc.gov/MarketReports/CommitmentsofTraders/ExplanatoryNotes/index.htm).
The Commitment of Traders report is published every Friday by the Commodity Futures Trading Commission (CFTC) and shows futures positions data that was reported as of the previous Tuesday (3 days behind).
Each currency contract is a quote for that currency directly against the U.S. dollar, a net short amount of contracts means that more speculators are betting that currency to fall against the dollar and a net long position expect that currency to rise versus the dollar.
(The charts overlay the forex closing price of each Tuesday when COT trader positions are reported for each corresponding spot currency pair.) See more information and explanation on the weekly COT report from the CFTC website.
Large speculators reduced their bullish net positions in the WTI Crude Oil futures markets this week, according to the latest Commitment of Traders (COT) data released by the Commodity Futures Trading Commission (CFTC) on Friday.
The non-commercial futures contracts of WTI Crude Oil futures, traded by large speculators and hedge funds, totaled a net position of 374,480 contracts in the data reported through Tuesday September 12th. This was a weekly reduction of -7,633 contracts from the previous week which had a total of 382,113 net contracts.
WTI crude oil speculative bullish positions have now fallen lower for five out of the past six weeks and remain below the +400,000 net contract position for a third straight week.
WTI Crude Oil Commercial Positions:
The commercial traders position, categorized by the CFTC as hedgers or traders engaged in buying and selling for business purposes, totaled a net position of -379,315 contracts on the week. This was a weekly boost of 9,414 contracts from the total net of -388,729 contracts reported the previous week.
USO:
Over the same weekly reporting time-frame, from Tuesday to Tuesday, the USO Crude Oil ETF, which tracks the price of WTI crude oil, closed at approximately $9.87 which was a shortfall of $-0.05 from the previous close of $9.92, according to unofficial market data.
*COT Report: The COT data, released weekly to the public each Friday, is updated through the most recent Tuesday (data is 3 days old) and shows a quick view of how large speculators or non-commercials (for-profit traders) as well as the commercial traders (hedgers & traders for business purposes) were positioned in the futures markets. The CFTC categorizes trader positions according to commercial hedgers (traders who use futures contracts for hedging as part of the business), non-commercials (large traders who speculate to realize trading profits) and nonreportable traders (usually small traders/speculators). Find CFTC criteria here: (http://www.cftc.gov/MarketReports/CommitmentsofTraders/ExplanatoryNotes/index.htm).
Large treasury bond speculators lifted their bullish net positions in the 10-Year Note futures markets this week after paring bets the previous week, according to the latest Commitment of Traders (COT) data released by the Commodity Futures Trading Commission (CFTC) on Friday.
The non-commercial futures contracts of 10-Year Note futures, traded by large speculators and hedge funds, totaled a net position of 251,679 contracts in the data reported through Tuesday September 12th. This was a weekly rise of 29,873 contracts from the previous week which had a total of 221,806 net contracts.
Ten-year note speculative positions have now advanced for three out of the last four weeks and are back above the +250,000 net position level after sliding below this threshold last week.
10-Year Note Commercial Positions:
The commercial traders position, categorized by the CFTC as hedgers or traders engaged in buying and selling for business purposes, totaled a net position of -108,347 contracts on the week. This was a weekly shortfall of -45,713 contracts from the total net of -62,634 contracts reported the previous week.
IEF ETF:
Over the same weekly reporting time-frame, from Tuesday to Tuesday, the 7-10 Year Treasury Bond ETF (IEF) closed at approximately $107.76 which was a loss of $-0.75 from the previous close of $108.51, according to unofficial market data.
*COT Report: The COT data, released weekly to the public each Friday, is updated through the most recent Tuesday (data is 3 days old) and shows a quick view of how large speculators or non-commercials (for-profit traders) as well as the commercial traders (hedgers & traders for business purposes) were positioned in the futures markets. The CFTC categorizes trader positions according to commercial hedgers (traders who use futures contracts for hedging as part of the business), non-commercials (large traders who speculate to realize trading profits) and nonreportable traders (usually small traders/speculators). Find CFTC criteria here: (http://www.cftc.gov/MarketReports/CommitmentsofTraders/ExplanatoryNotes/index.htm).
Large precious metal speculators continued to increase their net positions in favor of Gold futures this week, according to the latest Commitment of Traders (COT) data released by the Commodity Futures Trading Commission (CFTC) on Friday.
The non-commercial futures contracts of Gold futures, traded by large speculators and hedge funds, totaled a net position of 254,760 contracts in the data reported through Tuesday September 12th. This was a weekly increase of 9,462 contracts from the previous week which had a total of 245,298 net contracts.
Speculative gold bets have advanced higher for eight straight weeks and net positions are now above the +200,000 net contracts level for the fourth straight week. Overall, net bullish positions are at the highest standing since September 27th of 2016 when net positions totaled +291,904 contracts.
Gold Commercial Positions:
The commercial traders position, categorized by the CFTC as hedgers or traders engaged in buying and selling for business purposes, totaled a net position of -272,098 contracts on the week. This was a weekly fall of -10,291 contracts from the total net of -261,807 contracts reported the previous week.
GLD ETF:
Over the same weekly reporting time-frame, from Tuesday to Tuesday, the GLD ETF, which tracks the price of gold, closed at approximately $126.56 which was a decline of $-0.90 from the previous close of $127.46, according to unofficial market data.
*COT Report: The COT data, released weekly to the public each Friday, is updated through the most recent Tuesday (data is 3 days old) and shows a quick view of how large speculators or non-commercials (for-profit traders) as well as the commercial traders (hedgers & traders for business purposes) were positioned in the futures markets. The CFTC categorizes trader positions according to commercial hedgers (traders who use futures contracts for hedging as part of the business), non-commercials (large traders who speculate to realize trading profits) and nonreportable traders (usually small traders/speculators). Find CFTC criteria here: (http://www.cftc.gov/MarketReports/CommitmentsofTraders/ExplanatoryNotes/index.htm).