Large treasury bond speculators raised their bullish net positions in the 10-Year Note futures markets this week, according to the latest Commitment of Traders (COT) data released by the Commodity Futures Trading Commission (CFTC) on Friday.
The non-commercial futures contracts of 10-Year Note futures, traded by large speculators and hedge funds, totaled a net position of 270,120 contracts in the data reported through Tuesday September 12th. This was a weekly increase of 18,441 contracts from the previous week which had a total of 251,679 net contracts.
Ten-year note speculative positions, up two weeks in a row and at the highest level in four weeks, have now advanced for four out of the last five weeks and are above the +250,000 net position level for a second week.
10-Year Note Commercial Positions:
The commercial traders position, categorized by the CFTC as hedgers or traders engaged in buying and selling for business purposes, totaled a net position of -144,751 contracts on the week. This was a weekly drop of -36,404 contracts from the total net of -108,347 contracts reported the previous week.
IEF ETF:
Over the same weekly reporting time-frame, from Tuesday to Tuesday, the 7-10 Year Treasury Bond ETF (IEF) closed at approximately $107.15 which was a decline of $-0.61 from the previous close of $107.76, according to unofficial market data.
*COT Report: The COT data, released weekly to the public each Friday, is updated through the most recent Tuesday (data is 3 days old) and shows a quick view of how large speculators or non-commercials (for-profit traders) as well as the commercial traders (hedgers & traders for business purposes) were positioned in the futures markets. The CFTC categorizes trader positions according to commercial hedgers (traders who use futures contracts for hedging as part of the business), non-commercials (large traders who speculate to realize trading profits) and nonreportable traders (usually small traders/speculators). Find CFTC criteria here: (http://www.cftc.gov/MarketReports/CommitmentsofTraders/ExplanatoryNotes/index.htm).
Large speculators lowered their bullish net positions in the Gold futures markets this week for the first time in nine weeks, according to the latest Commitment of Traders (COT) data released by the Commodity Futures Trading Commission (CFTC) on Friday.
The non-commercial futures contracts of Gold futures, traded by large speculators and hedge funds, totaled a net position of 236,089 contracts in the data reported through Tuesday September 19th. This was a weekly lowering of -18,671 contracts from the previous week which had a total of 254,760 net contracts.
Gold bets had gained by +194,622 contracts in the previous eight weeks before this week’s turnaround. The gold speculative level, despite the pullback this week, remains above the +200,000 contract level for a fifth consecutive week.
Gold Commercial Positions:
The commercial traders position, categorized by the CFTC as hedgers or traders engaged in buying and selling for business purposes, totaled a net position of -253,041 contracts on the week. This was a weekly gain of 19,057 contracts from the total net of -272,098 contracts reported the previous week.
GLD ETF:
Over the same weekly reporting time-frame, from Tuesday to Tuesday, the GLD ETF, which tracks the price of gold, closed at approximately $124.62 which was a loss of $-1.94 from the previous close of $126.56, according to unofficial market data.
*COT Report: The COT data, released weekly to the public each Friday, is updated through the most recent Tuesday (data is 3 days old) and shows a quick view of how large speculators or non-commercials (for-profit traders) as well as the commercial traders (hedgers & traders for business purposes) were positioned in the futures markets. The CFTC categorizes trader positions according to commercial hedgers (traders who use futures contracts for hedging as part of the business), non-commercials (large traders who speculate to realize trading profits) and nonreportable traders (usually small traders/speculators). Find CFTC criteria here: (http://www.cftc.gov/MarketReports/CommitmentsofTraders/ExplanatoryNotes/index.htm).
Large speculators advanced their net positions in the S&P500 futures markets this week to a new bullish level, according to the latest Commitment of Traders (COT) data released by the Commodity Futures Trading Commission (CFTC) on Friday.
The non-commercial futures contracts of S&P500 futures, traded by large speculators and hedge funds, totaled a net position of 869 contracts in the data reported through Tuesday September 19th. This was a weekly gain of 6,708 contracts from the previous week which had a total of -5,839 net contracts.
This week’s rise in speculative positions follows five week’s of declining bets and brings the overall net position level into a bullish territory for the first time in eight weeks.
S&P500 Commercial Positions:
The commercial traders position, categorized by the CFTC as hedgers or traders engaged in buying and selling for business purposes, totaled a net position of -3,500 contracts on the week. This was a weekly decrease of -2,654 contracts from the total net of -846 contracts reported the previous week.
SPY ETF:
Over the same weekly reporting time-frame, from Tuesday to Tuesday, the SPY ETF, which tracks the price of S&P500 Index, closed at approximately $249.97 which was a boost of $1.15 from the previous close of $248.82, according to unofficial market data.
*COT Report: The COT data, released weekly to the public each Friday, is updated through the most recent Tuesday (data is 3 days old) and shows a quick view of how large speculators or non-commercials (for-profit traders) as well as the commercial traders (hedgers & traders for business purposes) were positioned in the futures markets. The CFTC categorizes trader positions according to commercial hedgers (traders who use futures contracts for hedging as part of the business), non-commercials (large traders who speculate to realize trading profits) and nonreportable traders (usually small traders/speculators). Find CFTC criteria here: (http://www.cftc.gov/MarketReports/CommitmentsofTraders/ExplanatoryNotes/index.htm).
Large speculators cut back on their net positions in the Silver futures markets this week following a streak of eight weekly gains, according to the latest Commitment of Traders (COT) data released by the Commodity Futures Trading Commission (CFTC) on Friday.
The non-commercial futures contracts of Silver futures, traded by large speculators and hedge funds, totaled a net position of 67,803 contracts in the data reported through Tuesday September 19th. This was a weekly decline of -7,184 contracts from the previous week which had a total of 74,987 net contracts.
Speculative bets had increased by over +65,000 net contracts in the previous eight weeks before this week’s coolling off of bullish bets.
Silver Commercial Positions:
The commercial traders position, categorized by the CFTC as hedgers or traders engaged in buying and selling for business purposes, totaled a net position of -78,408 contracts on the week. This was a weekly rise of 6,273 contracts from the total net of -84,681 contracts reported the previous week.
SLV ETF:
Over the same weekly reporting time-frame, from Tuesday to Tuesday, the SLV ishares ETF, which tracks the price of silver, closed at approximately $16.36 which was a decrease of $-0.53 from the previous close of $16.89, according to unofficial market data.
*COT Report: The COT data, released weekly to the public each Friday, is updated through the most recent Tuesday (data is 3 days old) and shows a quick view of how large speculators or non-commercials (for-profit traders) as well as the commercial traders (hedgers & traders for business purposes) were positioned in the futures markets. The CFTC categorizes trader positions according to commercial hedgers (traders who use futures contracts for hedging as part of the business), non-commercials (large traders who speculate to realize trading profits) and nonreportable traders (usually small traders/speculators). Find CFTC criteria here: (http://www.cftc.gov/MarketReports/CommitmentsofTraders/ExplanatoryNotes/index.htm).
Large speculators sharply decreased their net positions in the Copper futures markets this week bringing bullish bets lower for a second week following eight weeks of gains, according to the latest Commitment of Traders (COT) data released by the Commodity Futures Trading Commission (CFTC) on Friday.
The non-commercial futures contracts of Copper futures, traded by large speculators and hedge funds, totaled a net position of 32,587 contracts in the data reported through Tuesday September 19th. This was a weekly decrease of -14,027 contracts from the previous week which had a total of 46,614 net contracts.
The copper speculative decline this week was the largest one-week fall since October of 2016 and brings the overall bullish speculator level to its lowest spot in six weeks.
Copper Commercial Positions:
The commercial traders position, categorized by the CFTC as hedgers or traders engaged in buying and selling for business purposes, totaled a net position of -38,803 contracts on the week. This was a weekly boost of 13,009 contracts from the total net of -51,812 contracts reported the previous week.
JJC ETF:
Over the same weekly reporting time-frame, from Tuesday to Tuesday, the JJC iPath Bloomber Copper ETN, which tracks the price of copper, closed at approximately $33.75 which was a decline of $-0.82 from the previous close of $34.57, according to unofficial market data.
*COT Report: The COT data, released weekly to the public each Friday, is updated through the most recent Tuesday (data is 3 days old) and shows a quick view of how large speculators or non-commercials (for-profit traders) as well as the commercial traders (hedgers & traders for business purposes) were positioned in the futures markets. The CFTC categorizes trader positions according to commercial hedgers (traders who use futures contracts for hedging as part of the business), non-commercials (large traders who speculate to realize trading profits) and nonreportable traders (usually small traders/speculators). Find CFTC criteria here: (http://www.cftc.gov/MarketReports/CommitmentsofTraders/ExplanatoryNotes/index.htm).
Macroeconomic overview: European Central Bank President Mario Draghi stressed once again that the central bank’s goal is to “ensure price stability and price stability is defined as an inflation rate which is close to 2%”, adding that “today that means we are not there yet” and that “that is why monetary policy remains extraordinarily accommodative”.
The September PMIs paint a bright picture for eurozone growth, recording a strong increase both in the manufacturing and services indices from already solid levels. The Composite PMI rose one full point to 56.7, de facto matching the cyclical high hit in the spring. In quarterly terms, the average for the third quarter 2017 is 56.0, only moderately below the second-quarter 2017 number, when GDP expanded at an annualized pace of 2.5%. The recovery displays remarkable resilience to recent euro appreciation, indicating that strengthening domestic demand and supportive global growth are offsetting any FX-related drag that may have emerged at this stage.
The manufacturing PMI rose to 58.2 from 57.4, although the improvement was not homogeneous across subcomponents. The output index surged to 59.5 from 58.3, while the new orders index stabilized at a solid 58.3, with export orders down to 57.1 from 58.5. This latter detail might signal some small initial impact from currency appreciation, although the PMI press release does not report any material concern among the polled companies. The employment recovery is gaining traction (56.8 from 55.5) while, on the inflation front, both input and output prices accelerated further.
The services PMI improved to 55.6 from 54.7, driven by a combination of strengthening outstanding business (53.2 from 51.5), new orders (55.6 from 54.5) and employment (53.7 from 53.3).
At the country level, Germany and France performed strongly, with both their Composite PMIs rising by 2pts to 57.8 and 57.2, respectively. Given that the eurozone Composite PMI improved “only” by 1pt, it is likely that the performance in Italy and/or Spain was not as buoyant as in the core of the eurozone.
With the output gap closing at a fast pace in the last three to four quarters, the ECB can overlook weak inflation numbers and feel confident to start reducing the pace of monetary accommodation. However, the central bank’s exit is likely to be slow, with monthly net asset purchases reduced to EUR 40bn in the first half of 2018 and to EUR 20bn in the second half of 2018.
Technical analysis: A rebound and positive close on Thursday negates Wednesday’s bearish signals. EUR/USD has continued to gain into Friday to a fresh recovery high at 1.2004. Wednesday’s peak at 1.2035 is the next important resistance level.
Short-term signal: As we had expected, rapid sell-off on Wednesday was not continued and now we the EUR/USD is back on the upward path. We keep EUR/USD long for 1.2250.
Long-term outlook: Bullish
USD/CAD: Short for 1.1930
Macroeconomic overview: The Canadian dollar edged lower on Thursday against the USD as oil prices dipped, but pared some losses after domestic data showed much stronger-than-expected growth in wholesale trade.
The 1.5% increase in July wholesale trade exceeded economists’ forecasts for a decline of 0.9% and was the biggest increase since January. Stripping out the effects of price changes, volumes were even stronger, up 2.1%.
The strength of the data has boosted the outlook for growth in the economy for the month, offsetting soft manufacturing data.
The market will turn to Canada’s retail sales report today, for further clues on prospects for July gross domestic product. The country’s August inflation report is also due on Friday. A jump in inflation could trigger in October another interest rate hike by the Bank of Canada.
Prices of oil, one of Canada’s major exports, gave up some recent gains before a meeting of oil producers that could extend production limits aimed at clearing a glut.
Technical analysis: The corrective move is likely to be over. Yesterday’s shooting star is a sign of reversal. The next target for USD/CAD bears is 1.1920, full retracement of 2015-2016 rise.
Short-term signal: We got USD/CAD short at 1.2275 today. The target is 1.1930.
Long-term outlook: Bearish
TRADING STRATEGIES SUMMARY:
FOREX – MAJOR PAIRS:
FOREX – MAJOR CROSSES:
PRECIOUS METALS:
How to read these tables?
1.Support/Resistance – three closest important support/resistance levels 2. Position/Trading Idea: BUY/SELL – It means we are looking to open LONG/SHORT position at the Entry Price. If the order is filled we will set the suggested Target and Stop-loss level. LONG/SHORT – It means we have already taken this position at the Entry Price and expect the rate to go up/down to the Target level. 3. Stop-Loss/Profit Locked In – Sometimes we move the stop-loss level above (in case of LONG) or below (in case of SHORT) the Entry price. This means that we have locked in profit on this position. 4. Risk Factor – green “*” means high level of confidence (low level of uncertainty), grey “**” means medium level of confidence, red “***” means low level of confidence (high level of uncertainty) 5. Position Size (forex)– position size suggested for a USD 10,000 trading account in mini lots. You can calculate your position size as follows: (your account size in USD / USD 10,000) * (our position size). You should always round the result down. For example, if the result was 2.671, your position size should be 2 mini lots. This would be a great tool for your risk management! Position size (precious metals) – position size suggested for a USD 10,000 trading account in units. You can calculate your position size as follows: (your account size in USD / USD 10,000) * (our position size). 6. Profit/Loss on recently closed position(forex) – is the amount of pips we have earned/lost on recently closed position. The amount in USD is calculated on the assumption of suggested position size for USD 10,000 trading account. Profit/Loss on recently closed position (precious metals) – is profit/loss we have earned/lost per unit on recently closed position. The amount in USD is calculated on the assumption of suggested position size for USD 10,000 trading account.
VIP Traders Club members should expect to receive forex and precious metals trading signals updates at least twice a day. We will send you:
Suggested position size that you can easily adjust to your trading account size – this would help you in risk management and you will survive longer drawdown periods
Early heads-up about the potential trading opportunities or rationale to taken positions ( fundamental analysis, technical analysis )
Forecasts of most important macroeconomic indicators prepared by our economists and econometricians.
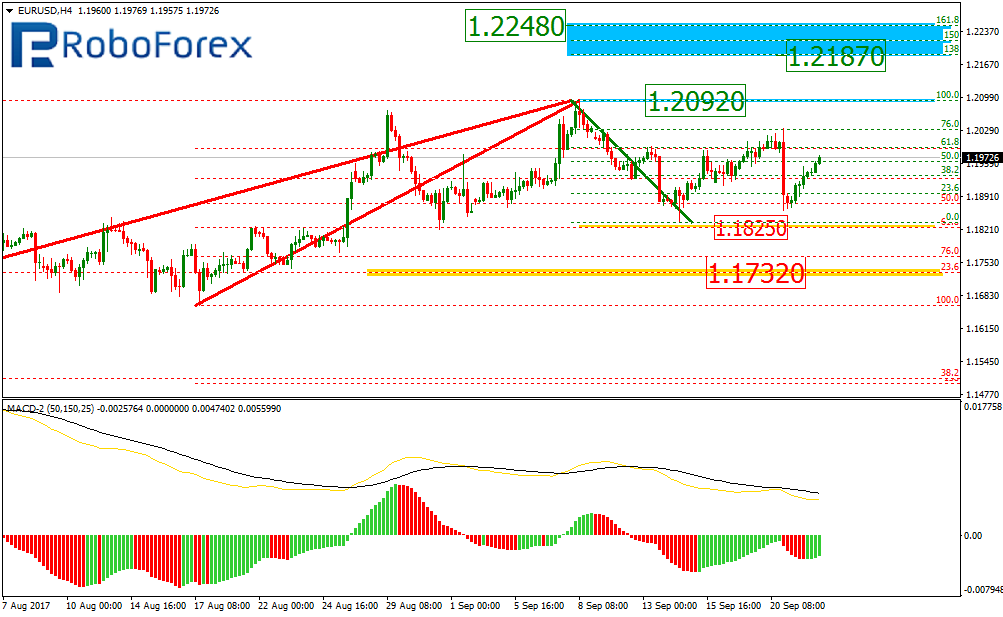
As we can see at the H4 chart, the EUR/USD pair is still being corrected to the downside. The closest target of this correction is the retracement of 23.6% at 1.1730. The main resistance level is at 1.2092. If the price breaks this level, the instrument may continue growing inside the uptrend towards the post-correctional extension area between the retracements of 138.2% and 161.8% at 1.2187 and 1.2248 respectively. The local support at 1.1825.
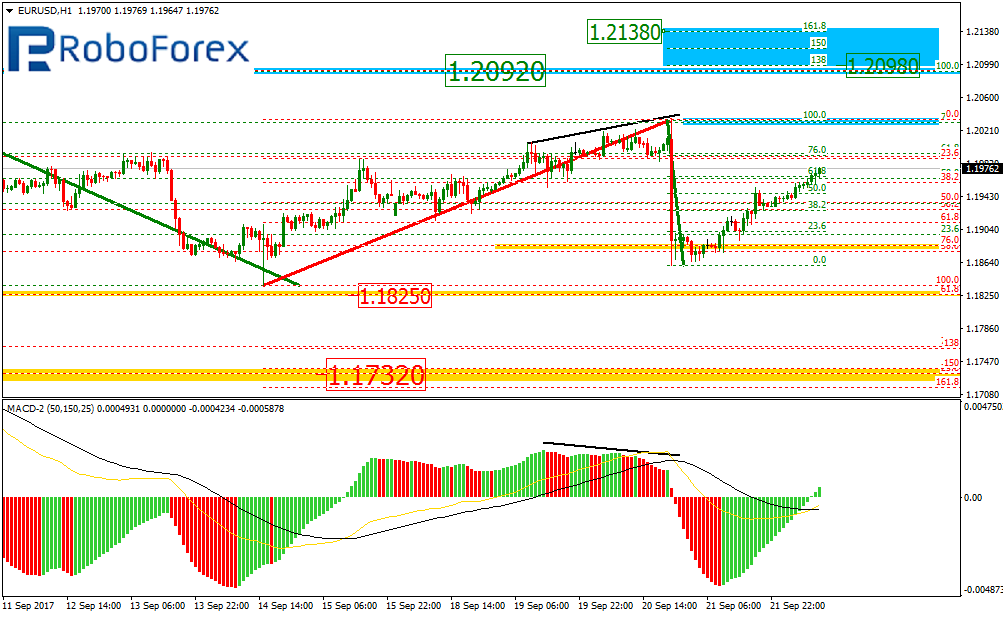
At the H1 chart, the pair is trying to recover after losing momentum yesterday when the news was published. If the price breaks break the local high at 1.2033, the instrument may not only reach the year’s high, but also continue growing towards the post-correctional extension area between the retracements of 138.2% and 161.8% at 1.2098 and 1.2138 respectively.
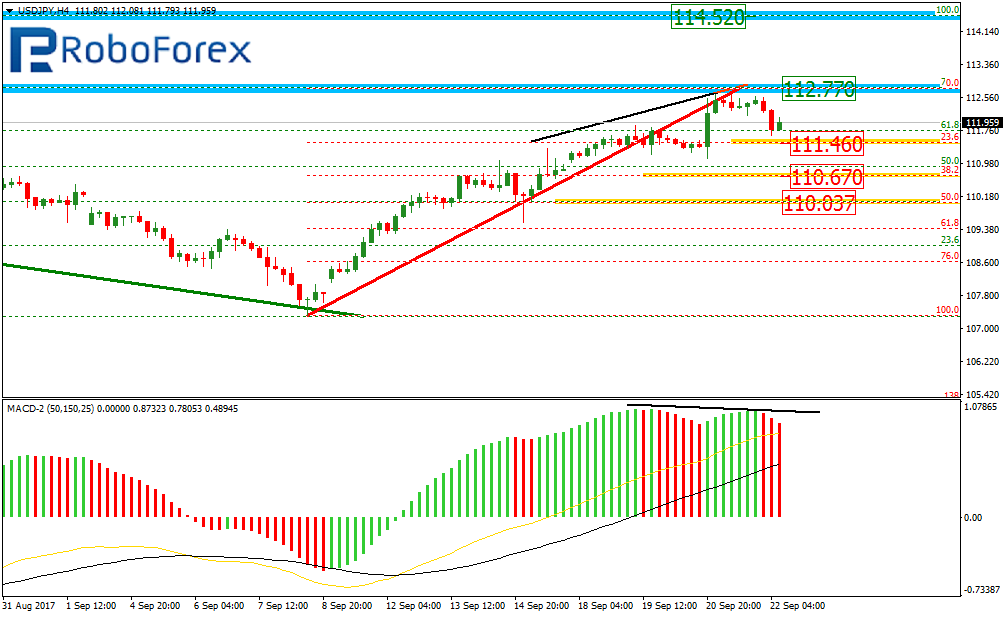
USD JPY, “US Dollar vs. Japanese Yen”
As we can see at the H4 chart, the previous downtrend has been corrected by 76.0%. At the moment, the USD/JPY pair is forming the divergence, which may indicate a possible correction to the downside. The targets of this correction may be at the retracements of 23.6%, 38.2%, and 50.0% at 111.46, 110.67, and 110.03 respectively.
More detailed structure of the correction is shown on the H1 chart. we should also note that if the price breaks the local high at 112.77, it may continue growing towards 114.52.
Attention! Forecasts presented in this section only reflect the author’s private opinion and should not be considered as guidance for trading. RoboForex LP bears no responsibility for trading results based on trading recommendations described in these analytical reviews.
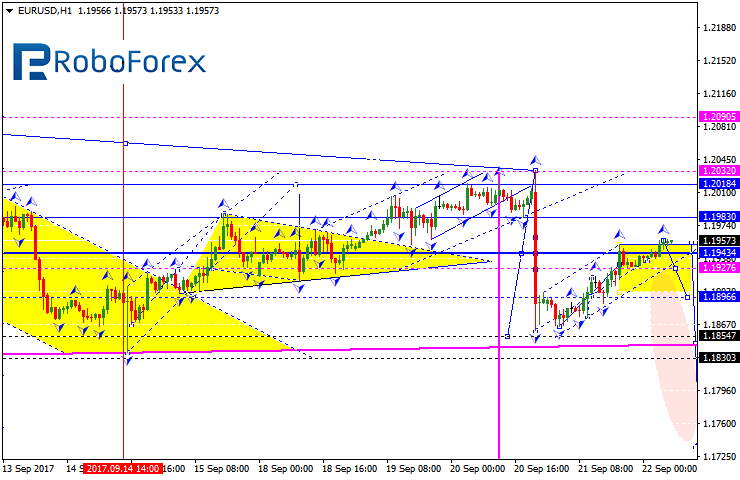
The EUR/USD pair has completed this wave and right now is being corrected. We think, today the price may continue consolidating at the highs of the current ascending wave. After breaking 1.1927, the instrument may form another descending impulse to reach 1.1855.
GBP USD, “Great Britain Pound vs US Dollar”
The GBP/USD pair has completed the correction of the first descending impulse and formed another consolidation range in the form of the Diamond pattern. Possibly, the price may fall to break the low at 1.3444. The target is at 1.3222.
USD CHF, “US Dollar vs Swiss Franc”
The USD/CHF pair has completed the descending correctional structure, Possibly, today the price may break the correctional channel to the upside. The next target is at 0.9817.
USD JPY, “US Dollar vs Japanese Yen”
The USD/JPY pair is trading to rebound from 112.65 to the downside. Possibly, the price may reach 111.52. Later, in our opinion, the market may grow towards 112.12 and then continue falling with the target at 109.60.
AUD USD, “Australian Dollar vs US Dollar”
The AUD/USD pair has reached the predicted target at 0.7912. We think, today the price may consolidate around 0.7924. If later the instrument breaks this consolidation channel to the downside, the market may fall towards 0.7755; if to the upside – start another correction with the target at 0.8000.
USD RUB, “US Dollar vs Russian Ruble”
Being under pressure, the USD/RUB pair is moving downwards. Possibly, the price may reach 57.48. Later, in our opinion, the market may choose an alternative scenario and form another ascending structure towards 58.67. The main scenario implies that the instrument may continue falling with the target at 56.55.
XAU USD, “Gold vs US Dollar”
Being under pressure, Gold is moving upwards. Possibly, the price may be corrected towards 1302 and then fall to reach 1284. After that, the instrument may continue the correction towards 1320.
BRENT
Brent has rebounded from 55.54 upwards and completed the ascending wave at 56.20. Later, in our opinion, the market may be corrected to the downside to reach the first target at 54.00. An alternative scenario suggests that the instrument may form another ascending structure towards 56.40 and then continue falling inside the downtrend.
Attention! Forecasts presented in this section only reflect the author’s private opinion and should not be considered as guidance for trading. RoboForex LP bears no responsibility for trading results based on trading recommendations described in these analytical reviews.
The second half of yesterday’s trading session passed without any major news. The market is still adjusting to the Fed’s decision taken on Wednesday evening (21st of September).
Today, our attention will be focused on the PMI indicators from Markit for the Eurozone and US. HIS Markit is set to publish its preliminary forecasts for GDP growth in the European and American economies for the third quarter of 2017. The effects of the hurricanes to have hit the Southwest coast of the US will be taken into account in this preliminary rating.
British Prime Minister Theresa May is set to make a speech today in Florence on the subject of the UK’s future relationship with the European Union post-Brexit. Remember that over the course of the last year, we’ve seen very high intraday volatility on the pound while speeches of this nature have been taking place.
On Saturday the 23rd of September, New Zealand will hold its parliamentary elections, and on the 24th, Germany will hold its federal elections. Volatility on the Kiwi dollar and the euro could be significantly higher before and after the weekend.
EUR/USD
On the 4-hour timeframe, the EURUSD pair is trying to recover its upwards trend:
On the hourly timeframe, the EURUSD is moving towards the centre of its potential range:
Although there is a weak buy signal on this pair, I’m going to refrain from trading. First of all, elections are being held in Germany over the weekend. In theory, the market could open with a gap after the weekend. While elections only have a small influence on national currency rates in the long term, volatility can increase in the short term. Secondly, on the hourly timeframe, the EURUSD pair is trading within a range, which in itself indicates that growth on the euro has stalled. Thirdly, the pair has yet to renew the “key top” of the correctional movement on the hourly timeframe. It’s for these reasons that I’m just going to watch the market from the sidelines today.
At the time of writing, the EURUSD pair is trading at 1.1969.
GBP/USD
On the 4-hour timeframe, the GBPUSD pair is trading around the resistance line of the upwards trend:
I don’t think it’s worth buying GBPUSD at the moment. What’s more, we could see some potentially chaotic behavior on the pound during Theresa May’s speech today. At the time of writing, the GBPUSD pair is trading at 1.3590.
USD/CHF
The USDCHF pair is continuing to move in a downwards trend on the daily timeframe:
We can see on the chart, however, that the price is approaching the resistance line of the trend. In my opinion, if US economic growth picks up thanks to the Fed’s looser monetary policy, the USDCHF could break through the trend line. Still, I’d like to stress that the USDCHF pair is still caught in a downwards trend and we’re talking about the daily timeframe here. That is to say that if there is a breakout, it won’t be instantaneous.
At the time of writing, the USDCHF pair is trading at 0.9681.
3 Videos + 8 Charts = Opportunities You Need to See.
Join this free event hosted by Elliott Wave International and you’ll get a clear picture of what’s next in a variety of U.S. markets. After seeing these videos and charts you will be ready to jump on opportunities and sidestep risks in some major markets. This free report (a $29 value) will present a unique outlook and give you a new perspective on the markets you won’t get anywhere else.
This article was syndicated by Elliott Wave International and was originally published under the headline Gold: Often, Simple Forecasting Tools Are All You Need. EWI is the world’s largest market forecasting firm. Its staff of full-time analysts led by Chartered Market Technician Robert Prechter provides 24-hour-a-day market analysis to institutional and private investors around the world.