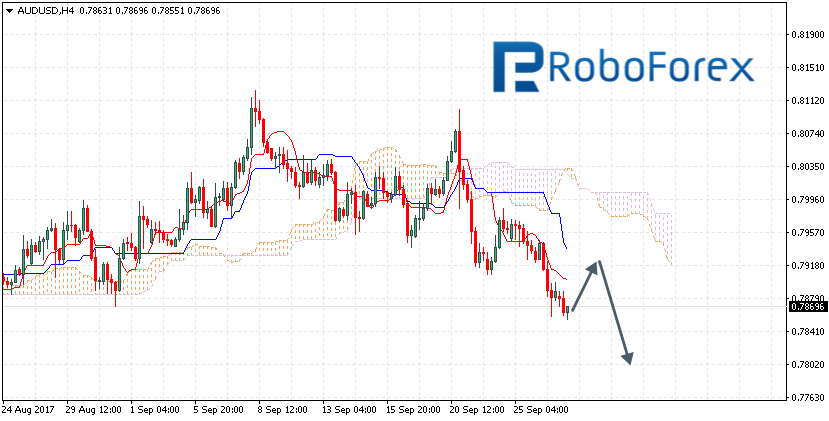
The AUD/USD pair is trading at 0.7869; the instrument is still moving below Ichimoku Cloud, which means that it may continue falling. We should expect the price to test Tenkan-Sen and Kijun-Sen at 0.7920 and continue moving downwards to reach 0.7805. However, this scenario may be cancelled if the price breaks the upside border of the cloud and fixes above 0.8005. In this case, the pair may continue growing towards 0.8120.
NZD/USD, “New Zealand Dollar vs US Dollar”
The NZD/USD pair is trading at 0.7198; the instrument is still moving below Ichimoku Cloud, which means that it may continue falling. We should expect the price to test Tenkan-Sen and Kijun-Sen at 0.7245 and then continue moving downwards to reach 0.7095. However, the scenario that implies further decline may be cancelled if the price breaks the upside border of the cloud and fixes above 0.7305. In this case, the pair may continue growing towards 0.7440.
USD/CAD, “US Dollar vs Canadian Dollar”
The USD/CAD pair is trading at 1.2360; the instrument is still moving above Ichimoku Cloud, which means that it may continue growing. We should expect the price to test Tenkan-Sen and Kijun-Sen at 1.2310 and then continue moving upwards to reach 1.2495. However, this scenario may be cancelled if the price breaks the downside border of the cloud and fixes below 1.2245. In this case, the pair may continue falling towards 1.2150.
Attention! Forecasts presented in this section only reflect the author’s private opinion and should not be considered as guidance for trading. RoboForex LP bears no responsibility for trading results based on trading recommendations described in these analytical reviews.
The EUR/USD pair has rebounded from 1.1800 and right now is falling inside the third wave. We think, today the price may reach 1.1666. Later, in our opinion, the market may be corrected to return to 1.1830 and then start another decline with the target at 1.1627.
GBP USD, “Great Britain Pound vs US Dollar”
The GBP/USD pair has rebounded from 1.3450 and right now is falling towards 1.3380. After that, the instrument may test 1.3450 from below and then resume moving downwards with the target at 1.3300.
USD CHF, “US Dollar vs Swiss Franc”
The USD/CHF pair is trading to rebound from 0.9688. Possibly, today the price may reach 0.9733. Later, in our opinion, the market may be corrected to return to 0.9688 and then form another ascending structure with the target at 0.9777.
USD JPY, “US Dollar vs Japanese Yen”
The USD/JPY pair has completed the first descending structure at 111.47 and right now is being corrected. We think, today the price may form another descending wave to break 111.47. The local target is at 111.11. And this is just a half of the third wave.
AUD USD, “Australian Dollar vs US Dollar”
The AUD/USD pair has broken 0.7900 and is still falling to reach 0.7826. After that, the instrument may test 0.7900 from below and then continue moving downwards with the target at 0.7755.
USD RUB, “US Dollar vs Russian Ruble”
The USD/RUB pair is still consolidating. Possibly, the price may continue the correction and reach 58.46. Later, in our opinion, the market may form the fifth descending wave with the target at 56.54.
XAU USD, “Gold vs US Dollar”
Gold has failed to fix above 1300.00 and right now is still moving downwards. Possibly, today the price may reach 1289.50 and then grow to test 1301.00 from below. After that, the instrument may fall with the target at 1280.00.
BRENT
Brent has rebounded from 57.20 to the upside. Possibly, the price may grow to reach 58.68. the next target is at 60.25. Later, in our opinion, the market may be corrected towards 55.50.
Attention! Forecasts presented in this section only reflect the author’s private opinion and should not be considered as guidance for trading. RoboForex LP bears no responsibility for trading results based on trading recommendations described in these analytical reviews.
Macroeconomic overview: Fed Chair Janet Yellen said the Federal Reserve needs to continue gradual rate hikes despite broad uncertainty about the path of inflation.
It is possible, Yellen said, that the Fed may have “misspecified” its models for inflation, and “misjudged” key facts like the underlying strength of the labor market and whether inflation expectations are as stable as they seem, and central bankers need to remain open to that possibility as they decide on policy.
Still, recent low inflation was likely a reflection of factors that would fade over time and despite uncertainties, it “would be imprudent to keep monetary policy on hold until inflation is back to 2%,” Yellen said. “Without further modest increases in the federal funds rate over time, there is a risk that the labor market could eventually become overheated, potentially creating an inflationary problem down the road that might be difficult to overcome without triggering a recession.”
Yellen’s remarks attempt to resolve a debate that has split members of the central bank among those worried that inflation may be permanently anchored below the Fed’s 2% target because of structural changes in the global economy, and those who feel it is only a matter of time before tight labor markets lead wages and prices to rise. She did not provide a definite answer, noting that in current forecasts there was a 30 percent chance inflation could range anywhere from 1 percent to 3%, vastly different outcomes either of which could rewrite the Fed’s policy approach. But she did make clear the Fed still feels a gradual pace of rate hikes remains the base case.
The Fed, which has raised rates twice this year, last week held rates steady and released forecasts that suggest most policymakers expect to raise rates once more by year-end and three times further next year. Traders of short-term interest-rate futures see about a 76% chance of December rate hike, but are betting on only one rate hike next year. We stick to our forecast that the Fed will raise rates in December.
U.S. consumer confidence fell in September and home sales dropped to an eight-month low in August due to the impact of Hurricanes Harvey and Irma, supporting the view that the storms would hurt economic growth in the third quarter.
The Conference Board said on Tuesday its consumer confidence index declined to a reading of 119.8 this month from 120.4 in August, which was the highest reading in five months. The Commerce Department said new home sales decreased 3.4% to a seasonally adjusted annual rate of 560k units last month, which was the lowest level since December 2016. Sales were down 1.2% on a year-on-year basis in August.
The Atlanta Federal Reserve is forecasting the economy to grow at a 2.2% annualized rate in the third quarter, slowing from the April-June period’s brisk 3.0% pace.
The euro hit a fresh one-month low on Wednesday as an ongoing dollar short squeeze and reaction to the German election encouraged investors to sell European currency. We think that a further correction seems likely in the short term, but medium-term outlook remains bullish.
Technical analysis: Clear break and close under the head and shoulders neckline on Tuesday targets a move to 1.1605. The nearest support level is 38.2% fibo of 1.1119-1.2092 rise at 1.1720.
Short-term signal: Our long position was stopped and we think that further drop in the EUR/USD is likely. We have placed a new bid at 1.1610, just above the 50% fibo of 1.1119-1.2092. Bullish trend should be maintained in the long term.
Long-term outlook: Bullish
VIP Traders Club members should expect to receive forex and precious metals trading signals updates at least twice a day. We will send you:
Suggested position size that you can easily adjust to your trading account size – this would help you in risk management and you will survive longer drawdown periods
Early heads-up about the potential trading opportunities or rationale to taken positions ( fundamental analysis, technical analysis )
Forecasts of most important macroeconomic indicators prepared by our economists and econometricians.
The Professional Breakout Trading System is a Forex intraday mechanical strategy which aims at capturing big volatile and explosive moves on most traded currency pair eur-usd. Why this pair? Because more than 25% of daily Forex turnover belongs to it. It has the tightest spread, the best market fills and the lowest slippage. See below one of the best moves the system has caught recently:
How exactly we generate the trades:
First step we make is to determine the direction of the short-term trend. Since we want to trade intraday we need to know where is more likely the market to go with short-term perspective in mind. We have tried to monitor intermediate-term and long-term trends instead of short-term but it appeared clearly that short-term focus is the most appropriate. We want to trade only when the odds are in our favor. Going against the trend is very dangerous and unprofitable.
We have developed a custom trend indicator, which can be set up to track short-term trend.It has two options – bullish and bearish. When blue dot is appearing on last closed candle we want to go long on the bar and vice versa for a short position. The trick here is that the indicator takes into consideration most recent volatility and we demand bigger moves against the trend for its change during volatile times and smaller moves when eur-usd is in a quiet mode. It adapts automatically to ever-changing Forex conditions.
On the second step we are examining where it is most appropriate to join the market on long side if the market is trending up or joining short side if it is down heading. This level depends on the most recent price action. Once the price exceeds this point our odds increases dramatically and we are in a position. At this point we want to see the market moving strongly in our predeterminated direction. The system is buying on strength and selling on weakness.
Once we are in a position it`s time to set up our Stop Loss order. The system always use on market placed SL, whose level is known at the moment of entering the market. We want to preserve our capital and to be confident in our trading. The question here is how wide or narrow the SL should be? The answer is: it depends on the most recent volatility. See the graph below:
As you can see sometimes we need to use a very narrow SL when the market is quiet and very a big one during the wild times like 2008. It can be 10 times difference between the size of the stops in both occasions. So we should pay attention to most recent volatility in order to be in sync with the market. Using a small SL in volatile market is sure road to losing.
We exit at the end of day if we have an open position. The system is intraday, so we don’t want to hold a position for a very long time. Whatever the profit or loss we have at the end of day, we exit the market.
As you can see the strategy is very simple, it not complicated with a lot of trading rules incorporated in it. Simple systems are not subject to overfitting. You won’t see a chart with a dozen fancy indicators with long names. Simple stuff is much better for long-term trading success.
Professional Breakout Trading System is backtested on Metatrader 4 for a 16 years period. We believe that the more time a system shows a profit and good performance, the more likely is to be successful in the future. During these 16 years eur-usd has gone through lots of different market conditions like trending and non trending cycles, volatile and quiet market and so on. A robust system must survive all market tests before it is considered for real trading.
As a final test we change the system`s inputs a lot in order to see if it will continue to be profitable or not. Usually if you have found a good market pattern to trade around which you have created a mechanical system, you have to see profitability with different settings.
In conclusion, it should be mentioned that the system trades very infrequently – only 1.34 trades on average per week. So you won’t see jumping in an out every few hours. It just passionately waits for its time and then enters into the market.
By ProfessionalTradingSystems.com – See our Breakout System
The Professional Reversal Trading System is a Forex automated strategy designed to take advantage of days when the price on eur-usd starts to move strongly on one direction and then reverses and closes near open or the opposite peak (bottom). Below you could see examples of that type of market behavior:
The system has been created after we realized that we want a system which logic is quite the opposite of the logic of Professional Breakout Trading System. Actually we invented it a 1 year after we had been trading with Breakout strategy. We began asking ourselves what would happen if we apply the opposite approach to eur-usd compared to Breakout rules. Then we added an entry trigger and the system has been completed.
Here is how exactly the strategy works:
It waits for a significant move inonedirection. We demand form price to make a big move in order to consider that it is worth starting to monitor a sign for a trend reversal.
The price must reach a predetermined level which depends entirely on price action and most recent volatility on Daily Timeframe. Every day we recalculate two levels for both directions.
If the price does not touch one of the levels we do not trade. The first step is not completed and thus we are patiently waiting for the next trading day. Look at some examples:
Once the price has reached one of the targets described in step one it time to monitor for a trend reversal. We don’t jump into the market immediately after step 1 is completed. It would be too early. So we applied our ProfessionalTrend indicator which would give us a warning when the price has changed its direction. So we wait for trigger. See below:
The set up of the indicator is done so that it won’t change its direction after a small correction against the trend. we give the price leeway to correct and to continue its former movement. We monitor only for a decisive trend change.
ProfessionalTrend a custom trend indicator, which can be set up to track short-term trends. It has two options – bullish and bearish. When a blue dot is appearing on the last closed candle we want to go long on the bar and vice versa for a short position. The trick here is that the indicator takes into consideration the most recent volatility and we demand bigger moves against the trend for its change during volatile times and smaller moves when eur-usd is in a quiet mode. It adapts automatically to the everchanging Forex conditions.
Once we are in a position it`s time to set up our Stop Loss order. The system always uses on market placed SL, whose level is known at the moment of entering the market. We want to preserve our capital and to be confident in our trading. The question here is how wide or narrow the SL should be? The answer is: it depends on the most recent volatility. See the graph below:
As you can see sometimes we need to use a very narrow SL when the market is quiet and very big one during the wild times like 2008. There can be a 10 fold difference between the sizes of the stops in both occasions. So we should pay attention to the most recent volatility in order to be in sync with the market.
It is time to exit our position. Usually it is done by the end of the day. But sometimes the strategy holds the positions for another day when certain conditions are met.
As you can see the strategy is very simple, it is not complicated with a lot of trading rules incorporated in it. Simple systems are not subject to overfitting. You won’t see a chart with a dozen fancy indicators with long names. Simple stuff is much better for long-term trading success.
Professional Reversal Trading System is backtested on Metatrader 4 for a 16 years period. We believe that the more time a system shows a profit and good performance, the more likely it is to be successful in the future. During these 16 years eur-usd has gone through lots of different market conditions like trending and non trending cycles, volatile and quiet market and so on. A robust system must survive all market tests before being considered for real trading.
As a final test we change the system`s inputs a lot in order to see if it will continue to be profitable or not. Usually if you have found a good market pattern to trade, around which you have created a mechanical system, you have to see profitability with different settings. If changing the systems inputs cause a deterioration of the equity curve, then you have a classic example of curvefitted strategy which won’t be profitable in real time trading.
The system has a relatively high winning percent rate – 63% with win to loss ratio of 1. It also trades very rarely – less that a trade per week. You won’t see the systems jumping in and out of the market.
The experts at BNP Paribas expect the EURUSD pair to fall to a value of 1.15 and the GBPUSD to fall to 1.25 in the first quarter of 2018, according to their weekly ECOWEEK report; published on the 22nd of September. The table below shows the group’s forecasts for the exchange rates of a set of currency pairs for the next 5 quarters:
Judging by the values in the table, one might conclude that BNP Paribas has an optimistic outlook on the US dollar for the next two quarters. For example, they expect the EURUSD pair to drop to 1.17 in the final quarter of this year, and to 1.15 in the first quarter of next year, while the GBPUSD is expected to fall to 1.29 and 1.25 respectively. The situation is similar on the USDJPY and USDCHF pairs. Still, it’s important to note that in the second quarter of next year, the experts at BNP suggest that the US dollar will again start to decline. For example, the EURUSD pair is expected to rise from 1.16 in the second quarter of 2018 to 1.23 in the fourth.
I’d like to remind everyone that banks frequently get their forecasts wrong (and constantly revise them), so this report shouldn’t be taken as a recommendation for buying or selling any particular currency pair, nor should it serve as the sole basis for any decisions, commercial or otherwise.
Personally, I’m interested to see which parts of the forecast will come true. We’ll return to these in time and I’ll write a review on how accurately BNP Paribas predicted the future.
A quick look at any of the US majors will show most investors that the markets have recently been pushing upward towards new all-time highs. These traditional market instruments can be misleading at times when relating the actual underlying technical and fundamental price activities. Today, we are going to explore some research using our custom index instruments that we use to gauge and relate more of the underlying market price action.
What if we told you to prepare for a potentially massive price swing over the next few months? What if we told you that the US and Global markets are setting up for what could be the “October Surprise of 2017” and very few analysts have identified this trigger yet? Michael Bloomberg recently stated “I cannot for the life of me understand why the market keeps going up”. Want to know why this perception continues and what the underlying factors of market price activity are really telling technicians?
At ATP provide full-time dedicated research and trading signal solution for professional and active traders. Our research team has dedicated thousands or hours into developing a series of specialized modeling systems and analysis tools to assist us in finding successful trading opportunities as well as key market fundamentals. In the recent past, we have accurately predicted multiple VIX Spikes, in some cases to the exact day, and market signals that have proven to be great successes for our clients. Today, we’re going to share with you something that you may choose to believe or not – but within 60 days, we believe you’ll be searching the internet to find this article again knowing ATP (ActiveTradingPartners.com) accurately predicted one of the biggest moves of the 21st century. Are you ready?
Let’s start with the SPY. From the visual analysis of the chart, below, it would be difficult for anyone to clearly see the fragility of the US or Global markets. This chart is showing a clearly bullish trend with the perception that continued higher highs should prevail.
Additionally, when we review the QQQ we see a similar picture. Although the volatility is typically greater in the NASDAQ vs. the S&P, the QQQ chart presents a similar picture. Strong upward price activity in addition to historically consistent price advances. What could go wrong with these pictures – right? The markets are stronger than ever and as we’ve all heard “it’s different this time”.
Most readers are probably saying “yea, we’ve heard it before and we know – buy the dips”.
Recently, we shared some research with you regarding longer term time/price cycles (3/7/10 year cycles) and prior to that, we’ve been warning of a Sept 28~29, 2017 VIX Spike that could be massive and a “game changer” in terms of trend. We’ve been warning our members that this setup in price is leading us to be very cautious regarding new trading signals as volatility should continue to wane prior to this VIX Spike and market trends may be muted and short lived. We’ve still made a few calls for our clients, but we’ve tried to be very cautious in terms of timing and objectives.
Right now, the timing could not be any better to share this message with you and to “make it public” that we are making this prediction. A number of factors are lining up that may create a massive price correction in the near future and we want to help you protect your investments and learn to profit from this move and other future moves. So, as you read this article, it really does not matter if you believe our analysis or not – the proof will become evident (or not) within less than 60 days based on our research. One way or another, we will be proven correct or incorrect by the markets.
Over the past 6+ years, capital has circled the globe over and over attempting to find suitable ROI. It is our belief that this capital has rooted into investment vehicles that are capable of producing relatively secure and consistent returns based on the global economy continuing without any type of adverse event. In other words, global capital is rather stable right now in terms of sourcing ROI and capital deployment throughout the globe. It would take a relatively massive event to disrupt this capital process at the moment.
Asia/China are pushing the upper bounds of a rather wide trading channel and price action is setting up like the SPY and QQQ charts, above. A clear upper boundary is evident as well as our custom vibrational/frequency analysis arcs that are warning us of a potential change in price trend. You can see from the Red Arrow we’ve drawn, any attempt to retest the channel lows would equate to an 8% decrease in current prices.
Still, there is more evidence that we are setting up for a potentially massive global price move. The metals markets are the “fear/greed” gauge of the planet (or at least they have been for hundreds of years). When the metals spike higher, fear is entering the markets and investors avoid share price risks. When the metals trail lower, greed is entering the markets and investors chase share price value.
Without going into too much detail, this custom metals chart should tell you all you need to know. Our analysis is that we are nearing the completion of Wave C within an initial Wave 1 (bottom formation) from the lows in Dec 2016. Our prediction is that the completion of Wave #5 will end somewhere above the $56 level on this chart (> 20%+ from current levels). The completion of this Wave #5 will lead to the creation of a quick corrective wave, followed by a larger and more aggressive upward expansion wave that could quickly take out the $75~95 levels. Quite possibly before the end of Q1 2018.
We’ve termed this move the “Rip your face off Metals Rally”. You can see from this metals chart that we have identified multiple cycle and vibrational/frequency cycles that are lining up between now and the end of 2017. It is critical to understand the in order for this move to happen, a great deal of fear needs to reenter the global markets. What would cause that to happen??
Now for the “Hidden Gem”…
We’ve presented some interesting and, we believe, accurate market technical analysis. We’ve also been presenting previous research regarding our VIX Spikes and other analysis that has been accurate and timely. Currently, our next VIX Spike projection is Sept 28~29, 2017. We believe this VIX Spike could be much larger than the last spike highs and could lead to, or correlate with, a disruptive market event. We have ideas of what that event might be like, but we don’t know exactly what will happen at this time or if the event will even become evident in early October 2017. All we do know is the following…
The Head-n-Shoulders pattern we first predicted back in June/July of this year has nearly completed and we have only about 10~14 trading days before the Neck Line will be retested. This is the Hidden Gem. This is our custom US Index that we use to filter out the noise of price activity and to more clearly identify underlying technical and price pattern formations. You saw from the earlier charts that the Head-n-Shoulders pattern was not clearly visible on the SPY or QQQ charts – but on THIS chart, you can’t miss it.
It is a little tough to see on this small chart but, one can see the correlation of our cycle analysis, the key dates of September 28~29 aligning perfectly with vibration/frequency cycles originating from the start of the “head” formation. We have only about 10~14 trading days before the Neck Line will likely be retested and, should it fail, we could see a massive price move to the downside.
What you should expect over the next 10~14 trading days is simple to understand.
_ Expect continued price volatility and expanded rotation in the US majors.
_ Expect the VIX to stay below 10.00 for only a day or two longer before hinting at a bigger spike move (meaning moving above 10 or 11 as a primer)
_ Expect the metals markets to form a potential bottom pattern and begin to inch higher as fear reenters the markets
_ Expect certain sectors to show signs of weakness prior to this move (possibly technology, healthcare, bio-tech, financials, lending)
_ Expect the US majors to appear to “dip” within a 2~4% range and expect the news cycles to continue the “buy the dip” mantra.
The real key to all of this is what happens AFTER October 1st and for the next 30~60 days after. This event will play out as a massive event or a non-event. What we do know is that this event has been setting up for over 5 months and has played out almost exactly as we have predicted. Now, we are 10+ days away from a critical event horizon and we are alerting you well in advance that it is, possibly, going to be a bigger event.
Now, I urge all of you to visit our website to learn more about what we do and how we provide this type of advanced analysis and research for our clients. We also provide clear and timely trading signals to our clients to assist them in finding profitable trading opportunities based on our research. Our team of dedicated analysts and researchers do our best to bring you the best, most accurate and advanced research we can deliver. The fact that we called this Head-n-Shoulders formation back in June/July and called multiple VIX Spike events should be enough evidence to consider this call at least a strong possibility.
If you want to take full advantage of the markets to profit from these moves, then join today at www.ActiveTradingPartners.com and become a member.
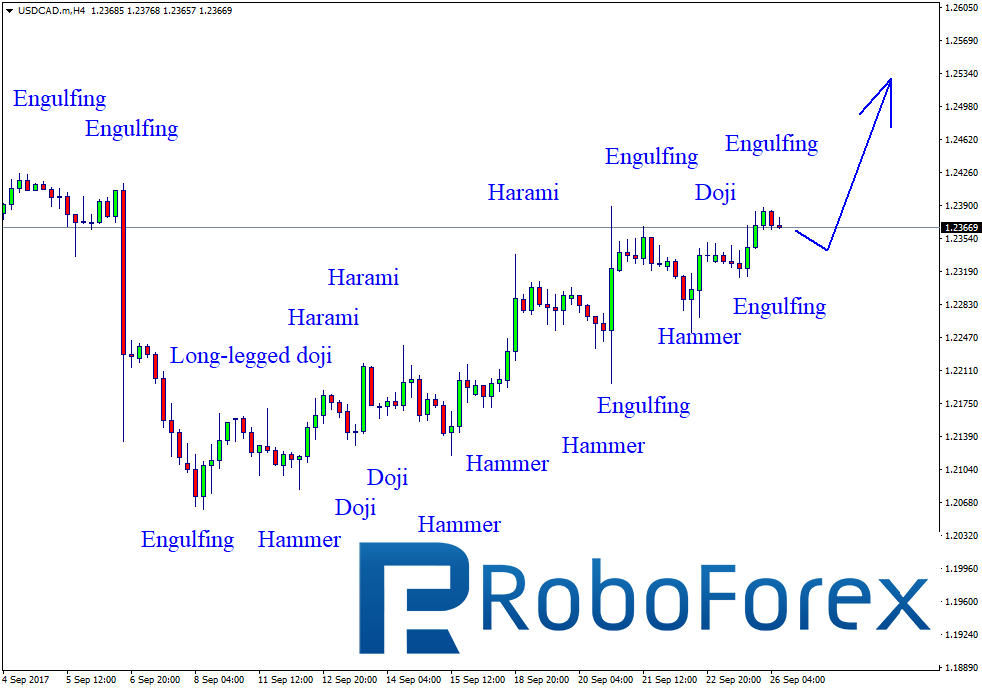
At the H4 chart, the USD/CAD pair continues growing and forming the ascending channel with Long-Legged Doji, Hammer, Doji, Harami, and Engulfing reversal patterns at support and resistance levels to define its borders. After finishing another correction from 1.23500, the pair returned to this level and fixed above it, and formed Engulfing pattern. Later, the instrument is expected to form another correction and then continue growing towards the resistance level at 1.24555.
AUD USD, “Australian Dollar vs US Dollar”
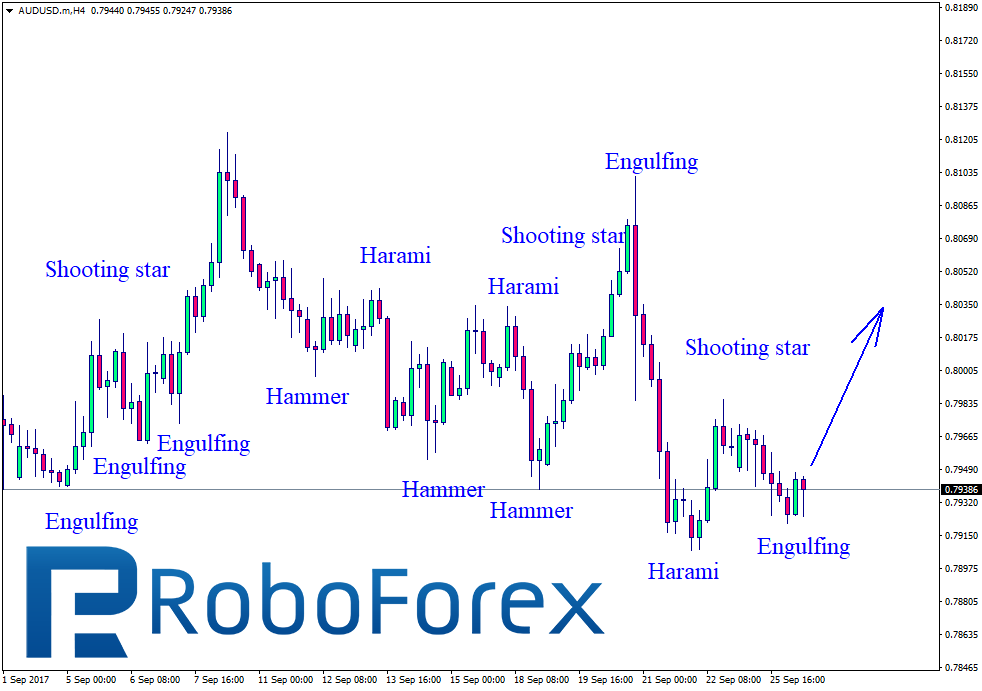
At the H4 chart, after finishing Harami, Engulfing, Hammer, Doji, and Shooting Star patterns, the AUD/USD pair defined the borders of the channel and reached the support level. Harami and Engulfing patterns indicate a new growth towards the resistance level at 0.8070.
Attention! Forecasts presented in this section only reflect the author’s private opinion and should not be considered as guidance for trading. RoboForex LP bears no responsibility for trading results based on trading recommendations described in these analytical reviews.
At the H4 chart, the XAU/USD pair is expected to test the 4/8 level at 1312.50 and then fall towards the 3/8 one at 1296.88. After that, the latter level may be broken as well and then the instrument may continue moving downwards to reach the resistance at the 0/8one at 1250.00.
At the H1 chart, the price is expected to test the 5/8 level at 1320.31, rebound from it, and then resume falling to reach the first target at 1296.88. After breaking it, the instrument may continue falling towards 1250.00.
At the M15 chart, the price may break the downside line of the VoltyChannel indicator and, as a result, continue moving downwards to reach 1296.88 without testing 1320.31.
GBP AUD, “Great Britain Pound vs Australian Dollar”
As we can see at the H4 chart, the GBP/AUD pair has rebounded from the resistance at the 8/8 level at 1.7089 and may continue falling towards the support at the 5/8 one at 1.6723.
At the M15 chart, the price may break the downside line of the VoltyChannel indicator and, as a result, move downwards to reach 1.6723.
Attention! Forecasts presented in this section only reflect the author’s private opinion and should not be considered as guidance for trading. RoboForex LP bears no responsibility for trading results based on trading recommendations described in these analytical reviews.
Macroeconomic overview: ECB President Mario Draghi said the European Central Bank is growing increasingly confident that inflation will rise back to its target, but patience is still needed, not least to make sure the economic recovery lasts. Draghi singled out currency volatility as a source of uncertainty that required monitoring and argued that “ample” ECB accommodation was still needed, because a premature and hasty move could unravel its work.
The ECB is expected to wind down its stimulus efforts, starting next year, even if inflation looks to remain below the bank’s near 2% target for years to come. ECB policymakers said that the debate is now about the details of the policy shift, such as whether to keep its quantitative easing programme open-ended or whether to signal an intent to phase out bond purchases.
But any change is likely to be incremental. Many policymakers are arguing for a gradualist approach to stop the euro from gaining too much.
Launched two and a half years ago, the ECB’s 2.3 trillion- euro bond-purchase scheme has depressed borrowing costs and helped revive spending and growth. But inflation has been unexpectedly slow to respond, leaving the ECB with a dilemma. Keeping price growth just below 2% is its sole mandate. Inflation was last at 1.5%.
But much of its firepower has been exhausted, and the inflation shortfall is at least partly outside its control. That has led policymakers to call for giving inflation more time, accepting that lifting prices will take several years longer than initially hoped.
Today investors will focus on what views will be expressed by Fed Chair Janet Yellen, who is due to speak in Cleveland at 16:45 GMT on “inflation, uncertainty, and monetary policy.”
Technical analysis: Bear sentiment remains and the EUR/USD trades slightly below Monday’s base. The head and shoulders neckline was pierced yesterday and price did manage to close under 23.6% fibo of June-September 1.1119-1.2092 rise at 1.1862. Further losses are likely and the 38.2% fibo at 1.1720 is now the next port of call for the bears.
Short-term signal: We see no big hopes for our long position after key support levels were broken yesterday. If the position is stopped, we will be looking to place another bid near 50% fibo of 1.1119-1.2092 rise at 1.1605.
Long-term outlook: Bullish
USD/JPY goes down on North Korea worries
Macroeconomic overview: The Japanese currency made sharp gains after North Korea’s foreign minister Ri Yong Ho said on Monday that President Donald Trump had declared war on the country and that Pyongyang reserved the right to take countermeasures, including shooting down U.S. bombers even if they are not in its air space.
Japan is the world’s largest creditor nation and traders tend to assume Japanese investors would repatriate funds at times of crisis, thus pushing up the yen. In our opinion stronger yen suggests markets do not really believe in an actual war in Asia.
Japan’s government needs to set a new time frame for achieving its budget-balancing goal, currently set at fiscal 2020/21, Finance Minister Taro Aso said on Tuesday.
He made the remarks a day after Prime Minister Shinzo Abe announced he would redirect some revenue from a planned sales tax hike in 2019 to child care and education rather than paying back public debt, in a bid to overhaul the social security system.
Abe admitted that would make it difficult to meet the government’s aim of balancing the budget – excluding debt-servicing costs and new bond sales – by the year ending in March 2021.
A primary budget balance is a key gauge of measuring how spending on policy measures is financed without relying on debt. Balancing the budget is seen as a crucial step to rein in the world’s heaviest public debt burden at twice the size of Japan’s economy.
Technical analysis: Despite recent falls the USD/JPY is still above 7-day exponential moving average and above 111.65 (38.2% fibo of December 2016-September 2017 fall), which is now a support level. Short-term momentum stays with the bears, but there is huge support in the form of daily cloud ahead, which currently spans 110.26-111.55 region.
Short-term signal: Short for 110.00
Long-term outlook: Flat
VIP Traders Club members should expect to receive forex and precious metals trading signals updates at least twice a day. We will send you:
Suggested position size that you can easily adjust to your trading account size – this would help you in risk management and you will survive longer drawdown periods
Early heads-up about the potential trading opportunities or rationale to taken positions ( fundamental analysis, technical analysis )
Forecasts of most important macroeconomic indicators prepared by our economists and econometricians.