Author Archive for InvestMacro – Page 496

EUR/USD: Long at 1.1810, for 1.2400

By GrowthAces.com

Macroeconomic overview: The U.S. economy expanded a bit faster than previously estimated in the second quarter, recording its quickest rate of growth in more than two years, but the momentum likely slowed in the third quarter due to the impact of Hurricanes Harvey and Irma.

GDP increased at a 3.1% annual rate in the April-June period, the Commerce Department said in its third estimate on Thursday. The upward revision from the 3.0% rate of growth reported last month reflected a rise in inventory investment.

Economic growth last quarter was the quickest since the first quarter of 2015 and followed a 1.2% pace in the January-March period. Harvey and Irma hurricanes, which struck Texas and Florida, could cut as much as six-tenths of a percentage point from GDP growth in the third quarter.

Harvey was blamed for much of the decline in retail sales, industrial production, homebuilding and home sales in August. Further weakness is anticipated in September because of Irma.

Rebuilding efforts are, however, expected to boost GDP growth in the fourth quarter and in early 2018. Signs of increasing inventory investment by businesses could soften the storms’ punch to the economy.

In a separate report on Thursday, the Commerce Department said wholesale inventories jumped 1.0% in August after rising 0.6% in July. Inventories at retailers shot up 0.7% after being unchanged in July. The department also said the goods trade deficit fell 1.4% to USD 62.9 billion in August.

Harvey and Irma continue to impact the labor market and are expected to cut into job growth this month. In a third report, the Labor Department said initial claims for state unemployment benefits increased 12k to a seasonally adjusted 272k for the week ended September 23.

Still, the labor market remains strong. Claims have now been below the 300k threshold, which is associated with a robust labor market, for 134 straight weeks. That is the longest such stretch since 1970, when the labor market was smaller.

Euro zone consumer inflation was smaller than expected in September, the first estimate from the European Union’s statistics office Eurostat showed on Friday. Eurostat estimated that CPI rose 1.5% year-on-year in September, the same as in August. The market had expected a rise of 1.6%.

But the core inflation measure, which excludes volatile prices of unprocessed food and energy, was higher than expected at 1.3% year-on-year against market consensus of 1.2%.

Technical analysis: EUR/USD is back inside the daily cloud. Bears are looking for a close today under 55-dma at 1.1817 to keep the trend alive. A close above this level could be a sign of rebound. A very strong support level is 1.1605 (50% fibo of 1.1119-1.2092 rise).

EURUSD Daily Forex Signals Chart

Short-term signal: We do not think EUR/USD is likely to fall below 1.1605 level (50% fibo of June-September rise). Today’s recovery gives us a hope for revival of rising trend that is why we decided to open another long at 1.1810 with the stop-loss below the above-mentioned 1.1605 and the target at 1.2400.

Long-term outlook: Bullish


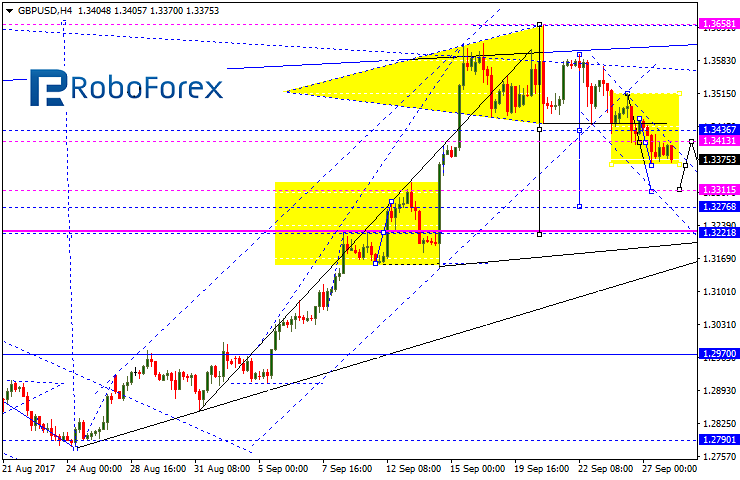
GBP/USD: Sterling dropped after UK GDP data

Macroeconomic overview: The UK economy expanded 0.3% on quarter in the three months to June of 2017, unrevised from the second estimate of GDP and following an upwardly revised 0.3% expansion in the previous period. Fixed investment was the main driver of growth while household expenditure rose at a slower pace. From the production side, the services industries were the only positive contributor to output GDP growth.

From the expenditure side, the positive contribution to GDP came from net trade (0.4 percentage points), gross fixed capital formation (0.1 percentage points) and household final consumption expenditure (0.1 percentage points); while business investment and government spending had no contribution to growth.

Exports of goods and services jumped 1.7% after falling 0.3% in the previous period, while imports rose at a slower 0.2%, following a 1% gain in the first quarter. As a result, the trade deficit narrowed to GBP 9.2 billion from GBP 11.3 billion in the first quarter.

Gross fixed capital formation grew by 0.6% (0.5% in the first quarter), with business investment rising 0.5% (0.8% in the first quarter). Meanwhile, household expenditure advanced by only 0.2%, the lowest quarter-on-quarter growth since the fourth quarter 2014, after rising by 0.4% in the previous period. The slowdown was driven by a decline in growth in household expenditure on transport (-2.7%), including motor cars. Government spending edged up 0.1% (0.2% in the first quarter).

Year-on-year GDP growth slowed to 1.5% in the second quarter from 1.8% in the first three months of the year.

Sterling slipped on Friday, hitting a four-day low against the euro after GDP release.

Technical analysis: Downside pressures return and the GBP/USD is working its way lower through the hourly cloud. Thursday’s low at 1.3344 is the nearest support, and 1.3320 (38.2% fibo of August-September 1.2775-1.3657 rise ) is the next one.

GBPUSD Daily Forex Signals Chart

Short-term signal: We got long at 1.3385 today with the target at 1.3800. We do not expect the GBP/USD to fall below 1.3216 (50% fibo of August-September rise) and placed the stop-loss below that level at 1.3185.

Long-term outlook: Bullish


TRADING STRATEGIES SUMMARY:

FOREX – MAJOR PAIRS:

Please enable images to upload to view this email properly

FOREX – MAJOR CROSSES:

Please enable images to upload to view this email properly

PRECIOUS METALS:

Please enable images to upload to view this email properly

How to read these tables?

1. Support/Resistance – three closest important support/resistance levels
2. Position/Trading Idea:
BUY/SELL – It means we are looking to open LONG/SHORT position at the Entry Price. If the order is filled we will set the suggested Target and Stop-loss level.
LONG/SHORT – It means we have already taken this position at the Entry Price and expect the rate to go up/down to the Target level.
3. Stop-Loss/Profit Locked In – Sometimes we move the stop-loss level above (in case of LONG) or below (in case of SHORT) the Entry price. This means that we have locked in profit on this position.
4. Risk Factor – green “*” means high level of confidence (low level of uncertainty), grey “**” means medium level of confidence, red “***” means low level of confidence (high level of uncertainty)
5. Position Size (forex)– position size suggested for a USD 10,000 trading account in mini lots. You can calculate your position size as follows: (your account size in USD / USD 10,000) * (our position size). You should always round the result down. For example, if the result was 2.671, your position size should be 2 mini lots. This would be a great tool for your risk management!
Position size (precious metals) – position size suggested for a USD 10,000 trading account in units. You can calculate your position size as follows: (your account size in USD / USD 10,000) * (our position size).
6. Profit/Loss on recently closed position (forex) – is the amount of pips we have earned/lost on recently closed position. The amount in USD is calculated on the assumption of suggested position size for USD 10,000 trading account.
Profit/Loss on recently closed position (precious metals) – is profit/loss we have earned/lost per unit on recently closed position. The amount in USD is calculated on the assumption of suggested position size for USD 10,000 trading account.


VIP Traders Club members should expect to receive forex and precious metals trading signals updates at least twice a day. We will send you:

  1. Buy and sell forex, precious metals signals (entry level, target, stop-loss)
  2. Suggested position size that you can easily adjust to your trading account size – this would help you in risk management and you will survive longer drawdown periods
  3. Early heads-up about the potential trading opportunities or rationale to taken positions ( fundamental analysis, technical analysis )
  4. Forecasts of most important macroeconomic indicators prepared by our economists and econometricians.

JOIN VIP TRADERS CLUB NOW!

About the Author:

By GrowthAces.com – Daily Forex Trading Strategies


Fibonacci Retracements Analysis 29.09.2017 (GBP/USD, EUR/JPY)

Article By RoboForex.com

GBP USD, “Great Britain Pound vs US Dollar”

At the H4 chart, the downtrend continues. The mid-term targets of this downtrend may be the retracements of 23.6% and 38.2% at 1.3263 and 1.3112 respectively. The short-term ones are the retracements of 38.2%, 50.0%, and 61.8% at 1.3322, 1.3215, and 1.3114 respectively. The resistance level is close to the local high at 1.3656.

As we can see at the H1 chart, after finishing the convergence, the pair started a new correction and has already reached the retracement of 23.6%. The next upside targets of this correction may be the area between the retracements of 38.2% and 61.8%. However, the main tendency is still bearish.


EUR JPY, “Euro vs. Japanese Yen”

As we can see at the H4 chart, the EUR/JPY pair has already been corrected to the downside by 50.0%. The next targets of the correction may be the retracement of 61.8% at 131.28. After completing this correction and breaking the local high at 134.40, the price may reach the post-correctional extension area between the retracements of 138.2% and 161.8% at 135.35 and 136.00 respectively. If the instrument breaks the psychologically-crucial level at 130.00, the correction may continue with the closest targets at the retracements of 23.6% and 38.2% at 129.80 and 126.94 respectively.

At the H1 chart, the pair is being corrected to the upside and has already reached the retracement of 38.2%. The next targets are inside the area between the retracements of 50.0% and 76.0% at 133.06 and 133.75 respectively.


RoboForex Analytical Department

Article By RoboForex.com

Attention!
Forecasts presented in this section only reflect the author’s private opinion and should not be considered as guidance for trading. RoboForex LP bears no responsibility for trading results based on trading recommendations described in these analytical reviews.

Forex Technical Analysis & Forecast 29.09.2017 (EUR/USD, GBP/USD, USD/CHF, USD/JPY, AUD/USD, USD/RUB, GOLD, BRENT)

Article By RoboForex.com

EUR USD, “Euro vs US Dollar”

The EUR/USD pair is being corrected. We think, today the price may reach 1.1762 and then grow towards 1.1800. In fact, the pair is expected to from the five-wave Flag pattern. After reaching the target of the correction, the instrument may continue its decline. The local target is at 1.1654.


GBP USD, “Great Britain Pound vs US Dollar”

The GBP/USD pair has rebounded from 1.3444 and is still falling. Possibly, today the price may continue moving downwards with the local target at 1.3263.


USD CHF, “US Dollar vs Swiss Franc”

The USD/CHF pair is still being corrected. Possibly, today the price may complete the ascending structure at 0.9724 and then start consolidating. If later the instrument breaks this consolidation channel to the upside, the market may reach 0.9750; if to the downside – form another correctional structure towards 0.9675, and complete the Flag pattern. After that, the instrument may form another ascending structure with the local target at 0.9800.


USD JPY, “US Dollar vs Japanese Yen”

The USD/JPY pair is forming the descending structure towards 112.00, which may later be followed by another growth to reach 112.68. After that, the instrument may consolidate between these two levels. If later the instrument breaks this consolidation channel to the downside, the market may continue falling towards 110.150; if to the upside – move upwards with the target at 113.27.


AUD USD, “Australian Dollar vs US Dollar”

The AUD/USD pair has completed the descending channel and may be corrected towards 0.7866. Later, in our opinion, the market may continue moving downwards with the local target at 0.7755.


USD RUB, “US Dollar vs Russian Ruble”

The USD/RUB pair has reached the target of the ascending wave and almost formed the Flag correctional pattern. At the moment, the price is forming another descending impulse, which may be considered as a part of the fifth wave. The target is at 56.55. After that, the instrument may resume growing with the target at 58.67.


XAU USD, “Gold vs US Dollar”

Gold is being corrected towards 1292.00. Later, in our opinion, the market may fall to reach 1272.00 or even extend this structure towards 1265.50 and complete the first descending wave. After that, the instrument may be corrected with the target at 1311.00.


BRENT

Brent has completed the first descending impulse. We think, today the price may be corrected towards 57.68 and then fall to reach 57.00, thus forming a new consolidation range between these two levels. If later the instrument breaks this consolidation channel to the downside, the market may be corrected towards 55.88; if to the upside – resume moving upwards with the target at 59.88.


RoboForex Analytical Department

Article By RoboForex.com

Attention!
Forecasts presented in this section only reflect the author’s private opinion and should not be considered as guidance for trading. RoboForex LP bears no responsibility for trading results based on trading recommendations described in these analytical reviews.

Forex market review: (29/09/2017)

By Veselin Petkov, Alpari

The US economy grew at an annual rate of 3.1% in the second quarter of 2017, according to figures published yesterday at 15:30 (GMT+3). Although this is historical data and was already factored into the price of the US dollar, it does increase the likelihood of the US seeing 2.0% real GDP growth in 2017. We can take from this that the US dollar could further strengthen its position against the majors by the end of the year.

Day’s news (GMT+3):

  • 02:30 Japan: national CPI (Aug), overall household spending (Aug).
  • 02:50 Japan: BoJ summary of opinions, industrial production (Aug), retail trade (Aug).
  • 10:00 Switzerland: KOF leading indicator (Sep).
  • 11:30 UK: GDP (Q2).
  • 12:00 Eurozone: CPI (Sep).
  • 15:30 USA: personal spending (Aug), personal income (Aug).
  • 15:30 Canada: GDP (Jul).
  • 17:00 USA: Michigan consumer sentiment index (Sep).

The last trading session of the week could turn out to be quite volatile. Inflation data could have a marked influence of the euro. Remember that the ECB bases its monetary policy on its inflation outlook. Macro-data from the US on consumer income and spending could give us an indication of the economic situation in the third quarter. All this data to be released sets the scene for a volatile trading session.

EUR/USD

The EURUSD currency pair has yet to renew the “key base” of the upwards trend on the H4 timeframe:

As such, we can conclude that due to the breakout of the trend line, while the trend has yet to be completely broken, it calls the continuation of the upwards trend into serious question. In my opinion, there aren’t any buy or sell signals on the H4 timeframe.

On the 30-minute timeframe, the EURUSD pair is trading around the resistance line of the downwards trend:

For now, I’m going to refrain from trading on the M30 timeframe.

At the time of writing, the EURUSD pair is trading at 1.1774.

GBP/USD

On the hourly timeframe (H1), the GBPUSD pair tried to reenter the recently formed range:

Still, the pair didn’t manage to stay in this range, and the downwards trend on the M30 timeframe remains intact:

We can see here that although the GBPUSD pair broke away from the trend line yesterday, the downwards trend still isn’t broken since the latest top couldn’t beat the previous one. Because of this, the downwards trend is still intact.

We could see a weak sell signal appear in the near future on the M30 timeframe from 1.3412 levels, but I’m going to hold off on opening a short position given that the previous two tops and previous two lows are very close together. This indicates that the downwards trend on M30 is fairly unstable and unreliable.

At the time of writing, the GBPUSD pair is trading at 1.3412.

USD/CHF

Yesterday, the USDCHF pair failed to break away from the trend line on D1:

In the first half of yesterday’s trading session, the USDCHF pair rose above the trend line, but this effort was short-lived, and the pair quickly returned to the downwards channel on D1.

It’s important to note that there hasn’t been any trend-setting macro-data from the US in the last few days, so I’m keeping my long position open on the USDCHF pair with a Stop Loss at 0.9390 and Take Profit at 0.9940 – 0.9960.

At the time of writing, the USDCHF pair is trading at 0.9716.

Japanese Candlesticks Analysis 28.09.2017 (USD/CAD, GOLD)

Article By RoboForex.com

USD CAD, “US Dollar vs Canadian Dollar”

At the H4 chart, the USD/CAD pair continues growing and forming the ascending channel with Long-Legged Doji, Hammer, Doji, Harami, and Engulfing reversal patterns at support and resistance levels to define its borders. After finishing another pullback and forming Engulfing pattern, the price reached the resistance level at 1.2455 and broke it. Then the instrument formed Harami pattern and continued growing. The upside target is the next resistance level at 1.2621.


XAU USD, “Gold vs US Dollar”

As we can see at the H4 chart, the instrument continues forming the descending channel with Gap, Engulfing, Shooting Star, Doji, Hammer, and Inverted Hammer patterns to define its borders. The price reached the support level, broke it, paused for a while, and then continued falling to reach the next support level at 1271.00.


RoboForex Analytical Department

Article By RoboForex.com

Attention!
Forecasts presented in this section only reflect the author’s private opinion and should not be considered as guidance for trading. RoboForex LP bears no responsibility for trading results based on trading recommendations described in these analytical reviews.

Forex Technical Analysis & Forecast 28.09.2017 (EUR/USD, GBP/USD, USD/CHF, USD/JPY, AUD/USD, USD/RUB, GOLD, BRENT)

Article By RoboForex.com

EUR USD, “Euro vs US Dollar”

Being under pressure, the EUR/USD pair is moving downwards. We think, today the price may reach 1.1699. Later, in our opinion, the market may grow towards 1.1756 and then start another decline with the target at 1.1654.


GBP USD, “Great Britain Pound vs US Dollar”

The GBP/USD pair is still falling. Possibly, today the price may reach 1.3311. After that, the instrument may test 1.3370 from below and then resume moving downwards with the target at 1.3276.


USD CHF, “US Dollar vs Swiss Franc”

The USD/CHF pair continue moving upwards. Possibly, today the price may reach 0.9768. Later, in our opinion, the market may fall towards 0.9733 and then form another ascending structure with the target at 0.9800.


USD JPY, “US Dollar vs Japanese Yen”

The USD/JPY pair is trying to expand the Triangle pattern to the upside. We think, today the price may reach 113.27 and then fall towards 111.44. The market is expected to consolidate and form a reversal pattern to continue the downtrend.


AUD USD, “Australian Dollar vs US Dollar”

The AUD/USD pair has completed the descending structure at 0.7819. Possibly, today the price may be corrected towards 0.7900 to test it from below. After that, the instrument may continue moving downwards with the local target at 0.7750.


USD RUB, “US Dollar vs Russian Ruble”

The USD/RUB pair is trading at the top of the ascending wave. Possibly, the price may reach 58.46. The entire ascending wave may be considered as the fourth correctional wave. Later, in our opinion, the market may form the fifth descending wave with the target at 56.55.


XAU USD, “Gold vs US Dollar”

Being under pressure, Gold is still moving downwards; it reached the predicted target at 1284.00, rebounded from 1289.50 and then formed a downside continuation pattern. We think, today the price may fall and extend this weave towards 1265.50.


BRENT

Brent is consolidating above 57.20. If later the instrument breaks this consolidation channel to the downside, the market may be corrected towards 56.20; if to the upside – resume moving upwards with the target at 60.35.


RoboForex Analytical Department

Article By RoboForex.com

Attention!
Forecasts presented in this section only reflect the author’s private opinion and should not be considered as guidance for trading. RoboForex LP bears no responsibility for trading results based on trading recommendations described in these analytical reviews.

EUR/USD: 1.1605 would be next bear objective

By GrowthAces.com

Macroeconomic overview: President Donald Trump proposed on Wednesday the biggest U.S. tax overhaul in three decades, calling for tax cuts for most Americans, but prompting criticism that the plan favors business and the rich and could add trillions of dollars to the deficit.

The plan would lower corporate and small-business income tax rates, reduce the top income tax rate for high-earning American individuals and scrap some popular tax breaks, including one that benefits people in high-tax states dominated by Democrats.

Forged during months of talks among Trump’s aides and top congressional Republicans, the plan contained few details on how to pay for the tax cuts without expanding the budget deficit and adding to the nation’s USD 20 trillion national debt.

The plan still must be turned into legislation, which was not expected until after Congress makes progress on the fiscal 2018 budget, perhaps in October. It must then be debated by the Republican-led congressional tax-writing committees.

Financial markets rallied on the plan’s unveiling, an event long anticipated by traders betting that stocks would benefit from both faster economic growth and inflation.

Boston Fed President Eric Rosengren said Inflation readings, which have fallen short of a 2% target this year, provide “flexibility” to raise rates more slowly, adding he would be concerned if it misses the target for a period of time. On the other hand, he said, holding policy steady for too long risks an inflation jump that forces the Fed to more aggressively tighten policy.

St. Louis Fed President Bullard (non-voter, dove) said with inflation low and economic growth slow, it is appropriate for the Fed to maintain current levels on administered rates. He said recent data indicate that U.S. real GDP growth remains consistent with the 2% trend growth “regime” of recent years, adding that growth in the second half of 2017 will probably not move meaningfully above 2%. Effects from the hurricanes are to add uncertainty to data interpretation in the coming months, he said, but the “substantial damage” from those weather events dampened hopes for second-half growth to reach as high as 3%.

Bullard judged that inflation’s downside surprise in the first half is unlikely to reverse itself in the second half. And despite continued strong performance of labor markets, wage inflation is modest and unlikely to drive inflation meaningfully higher over the balance of the year. He called into question the idea that inflation is reliably returning toward the Fed’s 2% objective. Bullard thus concluded that the current level of the federal funds rate target “is appropriate given current macroeconomic data.” We should know, however, that without a vote on this year’s or next year’s FOMC and the lowest dot on the dot plot, Bullard seldom moves markets with his comments these days.

New orders for U.S.-made capital goods increased more than expected in August and shipments maintained their upward trend, pointing to underlying strength in the economy despite an anticipated drag on growth from Hurricanes Harvey and Irma.

The signs of an acceleration in business spending on equipment bolstered prospects of a December interest rate hike by the Federal Reserve, boosting the dollar and pushing up the yield on the two-year U.S. Treasury note to its highest level since 2008.

The Commerce Department said on Wednesday non-defense capital goods orders excluding aircraft, a closely watched proxy for business spending plans, rose 0.9% last month after an upwardly revised 1.1% gain in July. Shipments of core capital goods rose 0.7% after advancing 1.1% in July. Core capital goods shipments are used to calculate equipment spending in the government’s GDP measurement.

The Commerce Department said it was unable to isolate the effects of Hurricanes Harvey and Irma on the data. Harvey, which devastated parts of Texas, has hurt August retail sales, industrial production, homebuilding and home sales. Irma, which struck Florida early this month, is expected to further hold down housing activity. That was flagged by a report on Wednesday from the National Association of Realtors showing that contracts to buy previously owned homes dropped 2.6% in August to a 19-month low.

Technical analysis: The cloud top at 1.1725 and 38.2% fibo of June-September 1.1119-1.2092 rise at 1.1720 were breached on Wednesday and EUR/USD bears are looking for follow through below there today. The 50% fibo is the next bear objective at 1.1605.

EURUSD Daily Forex Signals Chart

Short-term signal: Buy at 1.1610, slightly above the above-mentioned 50% fibo level

Long-term outlook: Bullish


USD/CAD: Poloz dampens rate hike bets

Macroeconomic overview: There is no predetermined path for Canadian interest rates and the central bank’s next move will depend on incoming data, Bank of Canada Governor Stephen Poloz said on Wednesday in a speech that suggested a third rate hike is not imminent.

Striking a cautious note and listing uncertainties facing Canada’s economy, Poloz said the central bank will closely watch movements in longer-term interest rates and the exchange rate as it considers how to follow its two recent rate hikes.

He added: “Monetary policy will be particularly data-dependent in these circumstances and, as always, we could still be surprised in either direction”.

Poloz said it was not yet clear how the economy will react to the recent hikes, especially given high household debt, and he declined to directly comment on the recent appreciation of the Canadian dollar.

The dovish tone made the market revise expectations for the next rate hike and the Canadian dollar weakened to a near four-week low as investors bet on a slower pace of tightening. Chances of another Canadian rate hike this year fell to 81% from almost 100% before the release of Poloz’s remarks, overnight index swaps data showed.

Technical analysis: The upward move is being continued. The pair broke above the 23.6% fibo of May-September 1.3793-1.2061 fall. The next important resistance levels are 1.2662 high on August 31 and 38.2% fibo of the above-mentioned move at 1.2723.

 USDCAD Daily Forex Signals Chart

Short-term signal: Our short position was stopped, but it did not change our medium-term bearish view on the USD/CAD. We are looking to sell USD/CAD again at 1.2700.

Long-term outlook: Bearish

About the Author:

By GrowthAces.com – Daily Forex Trading Strategies


Forex market review: (28/09/17)

By Veselin Petkov, Alpari

The Bank of Canada has indicated that it needs a more flexible, data-dependent monetary policy in the times to come, according to remarks yesterday from the bank’s head; Steven Poloz. Poloz stressed that they wouldn’t be thinking about interest rates mechanically, but rather that their outlook will depend on a number of statistical economic factors such as inflation, wage growth, business investment, consumer spending and debt, and so on. The Bank of Canada has hiked interest rates twice this year; once on the 12th of July when rates went up from 0.50% to 0.75%, and again on the 6th of September when they went up to 1.00%.

It’s important to note that the head of the Canadian regulator expects economic growth to slow down in the second half of the year compared to the first (Canada’s GDP growth in the second quarter reached 4.5% year on year), so there’s no guarantee of another rate hike from the BoC in the near future. Experts from the Canadian commercial bank Scotiabank expect one more rate hike this year followed by another two in 2018.

Yesterday, the Reserve Bank of New Zealand’s meeting on monetary policy concluded with the bank’s official cash rate being maintained at its current level of 1.75%; as was expected. An official statement from the regulator said that economic growth in the country would remain stable in the near future thanks to a loose monetary policy, increased migration to the country, increased exports, and fiscal stimulus measures passed in 2017. Still, the RBNZ continues to believe that the Kiwi dollar is overvalued.

Day’s news (GMT+3):

  • 09:00 Germany: Gfk consumer confidence survey (Oct).
  • 09:35 Japan: BoJ governor Kuroda’s speech.
  • 15:30 USA: goods trade balance (Aug).
  • 16:30 USA: GDP annualised (Q2).
  • 17:15 USA: Fed’s Stanley Fischer speech.

Finalised GDP figures for the US in the second quarter of 2017 are due to be published today. As far as I can see, this data has already been factored in by the market and won’t be a trend-setter for the dollar. In the short term, however, its publication could create some volatility on currency markets.

EUR/USD

On the 4-hour timeframe (H4), the EURUSD pair is testing the key base of the upwards trend:

On the 30-minute timeframe (M30), the EURUSD pair has broken through the resistance line of the downwards trend:

At the moment, I can’t see any buy or sell signals. At the time of writing, the EURUSD pair is trading at 1.1743.

GBP/USD

On the hourly timeframe (H1), the GBPUSD pair is attempting a breakout of the range:

On the 30-minute (M30) timeframe, the pair is continuing to move in a downwards trend:

Although it’s possible that, in the event that the trend line gets tested and the downwards trend reaffirmed; a very weak sell signal could appear, I’m going to hold off on opening a positions for now.

At the time of writing, the GBPUSD pair is trading at 1.3385.

One of my reasons for not trading on the GBPUSD pair for now is that I currently have long positions open on the USDCHF and USDJPY pairs, as well as a short position on gold. For the sake of diversity, I don’t want to have a lot of open positions favouring the dollar on various currency pairs.

USD/CHF

The USDCHF pair’s long term growth prospects have increased. On the daily timeframe (D1), yesterday’s candlestick closed above the upper line of the downwards trend:

We can clearly see on the chart that yesterday marked the first real breakout attempt of the trend line. So, I’m keeping my long position on the USDCHF pair open with a Stop Loss at 0.9390 and Take Profit at 0.9940 – 0.9960.

At the time of writing, the USDCHF pair is trading at 0.9751.

This Indicator Stayed AHEAD of Silver for 18+ Months: See What It Says NOW

By Elliott Wave International

Should investors rely on traditional ways of evaluating the stock market’s “proper value”? You might be surprised at what these four charts show.


3 Videos + 8 Charts = Opportunities You Need to See.

Join this free event hosted by Elliott Wave International and you’ll get a clear picture of what’s next in a variety of U.S. markets. After seeing these videos and charts you will be ready to jump on opportunities and sidestep risks in some major markets. This free report (a $29 value) will present a unique outlook and give you a new perspective on the markets you won’t get anywhere else.

Get your FREE report now – for a limited time >>

This article was syndicated by Elliott Wave International and was originally published under the headline This Indicator Stayed AHEAD of Silver for 18+ Months: See What It Says NOW. EWI is the world’s largest market forecasting firm. Its staff of full-time analysts led by Chartered Market Technician Robert Prechter provides 24-hour-a-day market analysis to institutional and private investors around the world.

The market may require the “safe haven” Yen

By Dmitriy Gurkovskiy, senior analyst at RoboForex

Despite the correction that took place earlier in September, the Japanese Yen is again strengthening against the USD. The reason is media coverage and investors’ growing needs for “safe haven” assets.

Geopolitical situation in Asia is slowly aggravating. There were some comments from North Korea last weekend, which didn’t attract investors’ attention, but the ones expressed on Monday really made the market nervous. North Korean Ministry of Foreign Affairs perceived Donald Trump’s words as the declaration of war. And since the USA has declared a war, North Korean authorities believe that they have every right to accept the challenge. From their point of view, from now on North Korea has the right to shoot down any American strategic aircraft within sight on the Korean territory or even out of sight.

And really, there are some American aircrafts flying not so far after all. Last weekend, they reported on several B-1Bs rather close to the eastern coast of North Korea.

At the same time, we should note that there might be no real military operations: words are words, aggression is aggression, but the very first thoughtless step will cause an entire chain of disastrous consequences, which will be very difficult to settle through peaceful means. This idea can be easily seen in the behavior of the USD/JPY pair: the instrument would return to its highs, unless investors thought otherwise.

At the moment, this is one of the main things that influence the Yen movement. The Japanese fundamental background and news are looking pretty calm during the last September week. The Department of Economic Affairs of Japan says that the country has to work on increasing its economic potential. Japanese authorities would like to see budget surplus in 2018 and say that they’re not going to change the sales tax so far, because the country’s economy requires some time to become more stable.

If we take a look at the daily chart of the USD/JPY pair, we can see that right now the price is moving inside the descending channel, but is getting closer to the upside border to test or even break it. The key resistance level is close to 113.00. If the instrument breaks it and fixes above, the pair may continue growing to reach the psychologically-crucial level at 120.00. However, this is the mid-term scenario.

The short-term outlook can be better seen at the H1 chart. Here we can see that the pair has finished the ascending impulse and started a new correction with the closest target at 111.35, which is the downside border of the descending channel. The next possible target of this descending movement is close to 110.30. To resume the uptrend, the instrument has to break the resistance level at 112.30. In this case, the price may grow towards its mid-term targets, 113.25 in particular.

Author: Dmitriy Gurkovskiy, senior analyst at RoboForex


Attention!

Forecasts presented in this section only reflect the author’s private opinion and should not be considered as guidance for trading. RoboForex bears no responsibility for trading results based on trading recommendations described in these analytical reviews.