Author Archive for InvestMacro – Page 494

USDCAD: Short for 1.1930, stop-loss 1.2680

By GrowthAces.com

EUR/USD: Trump prefers less hawkish candidates to Fed governor post

Macroeconomic overview: U.S. President Donald Trump is ramping up his search for a new chief for the U.S. central bank, meeting with former Federal Reserve Governor Kevin Warsh and three others and promising a decision this month. Warsh was a Fed governor between 2006 and 2011 and resigned from the board because of his opposition to the bond-buying program.

Trump has previously suggested he may reappoint Fed Chair Janet Yellen to the post. Jerome Powell, one of the current governors on the Fed’s board, also met with Trump last week about the Fed job.

A new Fed chair would take the helm as the central bank eases well away from crisis-era policies in response to a strengthening economy and falling unemployment, though inflation still lingers below the Fed’s 2% goal.

Under Yellen, the Fed has raised interest rates and launched a plan to shrink its USD 4.5 trillion balance sheet. Much of the latter was accumulated through a controversial bond-buying program that Yellen said helped the economy avert an even deeper downturn. Her term as chair expires in February.

Donald Trump’s said today the choice for the next Fed chair could be a less hawkish candidate than some had expected. U.S. Treasury Secretary Steven Mnuchin favours Fed Governor Jerome Powell over former governor Kevin Warsh. What is more, Powell is seen as more dovish than Warsh, who has criticised the Fed’s bond-buying programme in the past.

The dollar had rallied earlier this week on speculation that Warsh might be the leading candidate to replace Yellen. A more hawkish Fed candidate would likely prompt investors to bet on more aggressive normalization of monetary policy, to the dollar’s benefit. But today’s suggestion from Trump lowers the chances of Warsh.

Technical analysis: The EUR/USD did not manage to close below 38.2% fibo of June-September rise at 1.1720 yesterday and expands its recovery today. The pair is still capped by 7-day exponential moving average and the EUR/USD bulls need a close above that level to think seriously about short-term trend reversal.

EURUSD Daily Forex Signals Chart

Short-term signal: Our long position looks safe with stop-loss below 1.1605 level (50% fibo of 1.1119-1.2092 rise).

Long-term outlook: Bullish


USD/CAD falls despite another dovish voice from BoC

Macroeconomic overview: Deputy Governor Sylvain Leduc said Canada’s economic growth is expected to decline over the next few quarters but continue to exceed the rate of potential output. While he did not directly mention monetary policy, Deputy Governor Sylvain Leduc said a rise in entry rates of new firms and a decline in business exits over the coming quarters could lead to a virtuous cycle of growth. “An increase in productive capacity resulting from new firm creation would therefore allow the economy to grow faster without creating inflationary pressures,” he said. The focus on rising productivity and higher potential output could signal more dovish statement at the bank’s October 25 rate decision.

The Bank of Canada raised interest rates twice, in July and September, citing unexpectedly strong economic growth and a need to raise borrowing costs before inflation rears its head. Financial markets are divided over whether the bank will hike rates again before the end of the year, and economists said Leduc’s tone added to the cautious note sounded last week by Governor Stephen Poloz.

We expect the Bank of Canada will continue to raise interest rates, but a hike in October is unlikely.

Canada’s trade data for August is due on Thursday and the September employment report is scheduled for release on Friday.

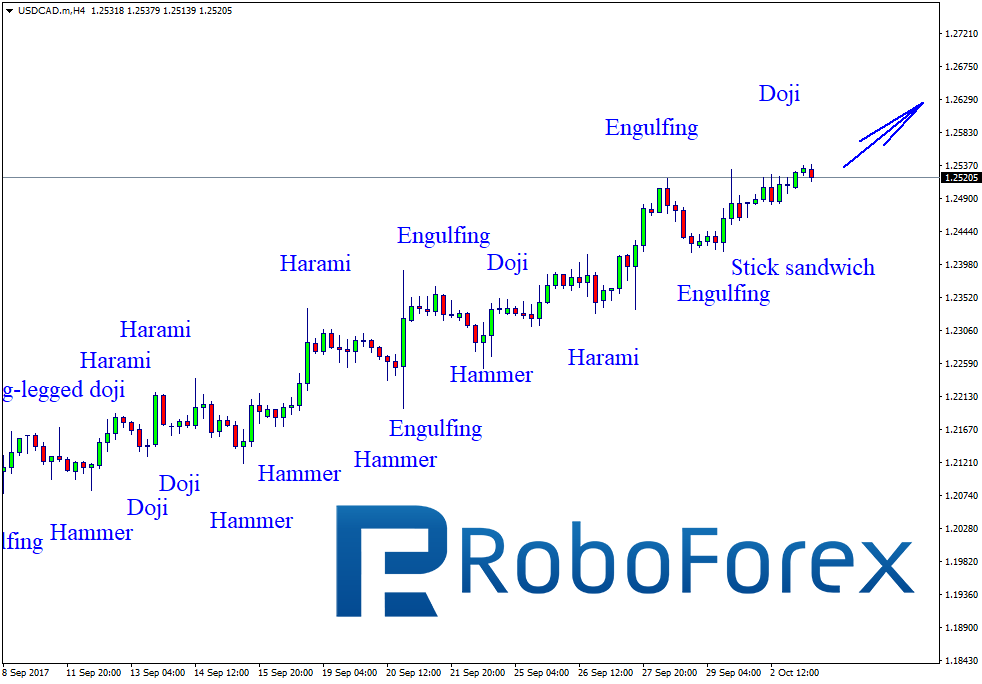
Technical analysis: Uptrend’s progress is being slowed by the upper 21-day Bolli and nearing the thick daily cloud’s base at 1.2602. The USD/CAD stays above 7-day exponential moving average, but a close below that level today could be the first signal of come back to downward trend.

USDCAD Daily Forex Signals Chart

Short-term signal: Short, target 1.1930, stop-loss 1.2680

Long-term outlook: Bearish


VIP Traders Club members should expect to receive forex and precious metals trading signals updates at least twice a day. We will send you:

  1. Buy and sell forex, precious metals signals (entry level, target, stop-loss)
  2. Suggested position size that you can easily adjust to your trading account size – this would help you in risk management and you will survive longer drawdown periods
  3. Early heads-up about the potential trading opportunities or rationale to taken positions ( fundamental analysis, technical analysis )
  4. Forecasts of most important macroeconomic indicators prepared by our economists and econometricians.

JOIN VIP TRADERS CLUB NOW!

About the Author:

By GrowthAces.com – Daily Forex Trading Strategies


Did You See the 30% Rise in This Major Global Stock Index?

By Elliott Wave International


3 Videos + 8 Charts = Opportunities You Need to See.

Join this free event hosted by Elliott Wave International and you’ll get a clear picture of what’s next in a variety of U.S. markets. After seeing these videos and charts you will be ready to jump on opportunities and sidestep risks in some major markets. This free report (a $29 value) will present a unique outlook and give you a new perspective on the markets you won’t get anywhere else.

Get your FREE report now – for a limited time!

This article was syndicated by Elliott Wave International and was originally published under the headline Did You See the 30% Rise in This Major Global Stock Index?. EWI is the world’s largest market forecasting firm. Its staff of full-time analysts led by Chartered Market Technician Robert Prechter provides 24-hour-a-day market analysis to institutional and private investors around the world.

Japanese Candlesticks Analysis 03.10.2017 (USD/CAD, USD/JPY)

Article By RoboForex.com

USD CAD, “US Dollar vs Canadian Dollar”

The USD continues strengthening against the Canadian Dollar. At the H4 chart, the USD/CAD pair formed the ascending channel with Harami, Hammer, Doji, and Engulfing reversal patterns at support and resistance levels to define its borders. The par failed to reach the resistance level at 1.2552 during the previous trading session; it stopped at 1.2525 and formed Engulfing, Doji, and Stick Sandwich patterns. The upside target is still at 1.2552.


USD JPY, “US Dollar vs. Japanese Yen”

The USD is getting more expensive against the Japanese Yen. At the H4 chart, the pair formed the ascending channel with Hammer, Harami, Shooting Star, Doji, and Engulfing reversal patterns at support and resistance levels to define its borders. The upside target is at 114.00.


RoboForex Analytical Department

Article By RoboForex.com

Attention!
Forecasts presented in this section only reflect the author’s private opinion and should not be considered as guidance for trading. RoboForex LP bears no responsibility for trading results based on trading recommendations described in these analytical reviews.

EURUSD: sellers on track to reach the 135th degree

By Gabriel Ojimadu, Alpari

Previous:

On Monday the 2nd of October, trading on the euro/dollar pair closed down. The euro fell to 1.1730 against the dollar on the fallout from Catalonia’s independence referendum and a general strengthening of the dollar.

A strong ISM manufacturing report as well as increased expectations of a rate hike at the Fed’s December meeting provided support for the dollar. The dollar continued to strengthen in Asia.

US data:

  • ISM manufacturing index: 60.8 (forecast: 57.8, previous: 58.8).
  • Construction spending (Aug): 0.5% (forecast: 0.2%, previous: -1.2%).

Day’s news (GMT+3):

  • 06:30 Australia: RBA interest rate decision.
  • 11:30 UK: PMI construction (Sep).
  • 12:00 Eurozone: PPI (Aug).

EURUSD rate on the hourly. Source: TradingView

On the hourly timeframe, bearish sentiment still prevails. It won’t be easy for euro bulls to reverse the price here given rising political tensions resulting from the Catalonia independence referendum, ambiguous statements from ECB representatives with regards to QE reversal, and increased expectations of a rate hike from the Fed in December.

In Asia, the rate has dropped to 1.1699. Sellers have completely erased the gains seen between the 27thand 29th of September. Seeing as the hourly indicators are in the buy zone for the euro, I’m expecting a rebound from the 112th degree. It’s not clear whether the price will bounce here because there’s a lot of downwards pressure on the euro and the trend line on the daily timeframe was broken through on the 26thof September. For now, sellers are keeping on track towards the 1.1650 support. If buyers fail to defend this level, we can start looking towards 1.1330. For Tuesday, my target is 1.1670 at the 135th degree. If the hourly candlestick closes above 1.1735, my scenario for a decline will not play out.

Murrey Math Lines 03.10.2017 (EUR/USD, AUD/USD)

Article By RoboForex.com

EUR USD, “Euro vs. US Dollar”

As we can see at the H4 chart, the EUR/USD pair has broken the support at the 0/8 level at 1.1718 and entered the “oversold zone”, where there are two more supports, the -1/8 and -2/8 levels at 1.1657 and 1.1596 respectively. At the moment, the latter level is considered a very strong support: the price is expected test this level, rebound from it, and then resume growing towards the resistance at the 3/8 level at 1.1901. Possibly, the instrument may rebound from the -1/8 level without testing the -2/8 one.

The levels at the H4 and H1 charts are completely the same, so the H4 scenario is confirmed.  After the pair reaches any of the support levels, one should wait until the price breaks the upside line of the VoltyChannel indicator and only then consider opening positions. The broken line of the indicator will confirm a rebound and a possible growth towards 1.1901.


AUD USD, “Australian Dollar vs US Dollar”

As we can see at the H4 chart, the AUD/USD pair has broken the support at the 0/8 level at 0.7812 and right now is moving below it. If the price breaks this level to the upside and fixes above it, it may resume growing towards the 3/8 one at 0.7995.

At the H1 chart, the price is also trading below the 0/8 level at 0.7812 and may continue moving upwards. However, to confirm this scenario, the pair has to break it to the upside.

At the M15 chart, the pair may break the upside line of the VoltyChannel indicator. In this case, it may continue moving upwards to reach 0.7995.


RoboForex Analytical Department

Article By RoboForex.com

Attention!
Forecasts presented in this section only reflect the author’s private opinion and should not be considered as guidance for trading. RoboForex LP bears no responsibility for trading results based on trading recommendations described in these analytical reviews.

The Catalonia referendum raised risks for the Euro

By Dmitriy Gurkovskiy, senior analyst at RoboForex

The EUR/USD pair is falling at the beginning of October. Right now, the most serious threat to the European integrity principle is posed by Spain, where they held the referendum last weekend relating to Catalonia’s exiting the country. In the next several days, the news from Spain will be the main catalyst for the EUR/USD pair movements. The things the Spanish government will say, the way the country’s authorities and the outers will respond – this is what will be the reason how deep the main currency pair may fall.

So, about 90% of the Catalonian population voted for exiting Spain. In case of Catalonia, the autonomy implies tax independence and division of other financial flows. In theory, it may be a very painful process for Spain: Catalonia provides a bit more than 19% of the country’s GDP. If one looks further, one will see that 26% of the entire Spanish export come from Catalonia. Hence, the region is quite strong when it comes to taxes and helps other regions of the country to be more stable. We should also note that Catalonia is a great attraction for tourists and has a lot of intangible assets.

As a matter of fact, Catalonia is the Span’s main region, which makes the rest of the country wealthy. The next on this list are Madrid, Valencia, and Balearic Islands. All these regions earn more than they spend, and the entire Spanish economy is supported by them. If you take one link out of the chain, the system will not work properly.

As for possible consequences for the Eurozone, there is more in this than meets the eye. If we assume that Catalonia overcomes all difficulties that are being created by the country’s authorities right now, the region will be confronted with a question of its own currency sooner or later. Considering 40 years of talking about the autonomy, Catalonia will hardly want to continue using the Euro. This, in its turn, may result in exiting the Eurozone and dangers to the economic stability not only of Spain, but to other countries in the European Union as well.

Under such circumstances it’s quite logical to expect the European currency to come under significant pressure. While the referendum organizers are still counting votes and the Spanish official authorities are looking for solution of this problem, the EUR/USD pair is slowly moving to the downside and trading near 1.1170. However, if any aggressive comments or actions from Catalonia or Spain appear, the main currency pair is expected only to fall.

At the daily chart of the EUR/USD pair, we can see that the tendency reversed several weeks ago, after the price had broken the support level of the ascending channel colored in green. The pair has fixed below 1.1900, which means that the market participants’ sentiment is very “bearish”. The closest level for the price to break in order to continue falling is 1.1700. After the price breaks it, the instrument will continue its decline to reach 1.1425 and then 1.1250.

Author: Dmitriy Gurkovskiy, senior analyst at RoboForex

Attention!

Forecasts presented in this section only reflect the author’s private opinion and should not be considered as guidance for trading. RoboForex bears no responsibility for trading results based on trading recommendations described in these analytical reviews.

Are the US Markets setting up for an Early October Surprise?

By www.ActiveTradingPartners.com

Many analysts have recently warned that the US markets are setting up for a potentially massive correction, 40~70% some warn.  Our own analysis has shown massive market cycles that correlate with an October market correction.  Our VIX cycle analysis indicates that we should be expecting a spike in the VIX right now (within the next 3~4 days).  What does all this mean in reality for the average investor?

As investors, we have to determine the amount of risk compared to the amount of potential gain in any trade.  Our job is to measure this relationship properly and to attempt to find opportunities in taking risks for an adequate amount of gain.  Often, this business is difficult to manage expectations and presumed risk factors for traders.  We’ve been trading, combined, for over 40+ years and have learned that the markets don’t always do what we expect them to do.  A perfect example is our most recent VIX Spike call for Sept 9th ~ 12th.  Even though our analysis was valid and accurate, we did not see the VIX spike levels we had projected to happen – such is life in the markets.  We strive every week to deliver superior analysis, trading triggers/alerts and daily markets updates to our clients.  Right or wrong, we live by our abilities to call successful trading triggers and provide timely and accurate market research.

Right now, a number of US major markets are setting up with divergence between price and common technical indicators.  Because many investors fail to even review or focus on longer term charts, very few may be aware of these setups.  Given the size and strength of the recent moves, we are not making predictions regarding the downside price potential (although it could be substantial).  We are simply pointing out that these divergence patterns are setting up in a number of US major markets and we believe this is a significant correlation pattern of a future event.

This Daily NASDAQ chart provides one of the clearest examples of the divergence patterns.  Price has continually tightened within an upward sloping trend channel and has recently formed a bear flag formation.  MACD has related multiple divergence tops over the past 3+ months and RSI has hovered just above 45 throughout this trend to support the upward move.  As washout high reversal early this week would be a perfect setup for a divergent reversal. A prices spike a bit higher early this week followed by a deep market correction.


Chart_17-09-28_13-29-24


This second chart of the ES provides even further evidence of the setup.  This chart is a Weekly ES (S&P) chart that shows the divergent price action going all the way back to February/March of 2017.  The cyan blue trend channel (support level) is clearly our potential downside target and the RSI is continuing to hover above 58 as this trend continues.  Could the extended divergence be warning of a potentially massive correction?  If so, the RSI would quickly fall to below 50 and price would attempt to retest the support channel (-200 pts from current levels).


Chart_17-10-01_ES_W_Div


The following chart of the INDU, again, shows the US majors are all setting up in a similar pattern.  One can clearly see the continued divergence price pattern from early 2017 and the continued RSI support above 60.  The confluence of these divergence patterns is causing us to be concerned of a surprise price rotation in early October.  We’ve seen what we call a “washout price rotation” happen over and over in the markets near critical tops and bottoms.  The telltale signs of these moves is extended weakness of a trend (as indicated by the MACD divergence), technical failure (which would be the resulting RSI breakdown) and a moderately high volume “last price advance” followed by a clear and quick price reversal (the “washout setup”).


Chart_17-10-01_INDU_W


To further assist you in understanding this type of setup/reversal, we’ve provided a clear Intraday NQ Washout reversal setup for you to see what it looks like.  This is a nearly perfect example of bigger volume and price range at the end of a trend (what we call the exhaustion move) that sets up the new bullish trend.  You can see the NQ market had been moving lower and had been consolidating briefly.  Just before this washout move, it appears the market was “pausing a bit”.  Then, seemingly out of the blue, a big down move generated lots of renewed interest from sellers.  Only to have that “exhaustion move”, or what we term the “washout low” to sucker in the sellers, stop out the longs and, eventually, continue much higher.


Chart_17-10-01_NQ Washout Example


Could this be setting up this week with an early Monday/Tuesday washout high price rotation in the US markets?  Could this be the setup reversal that coordinates with our VIX Spike trigger?

Two items we will be watching early this week are the NQ (tech heavy and usually an early indication of any general market weakness) the XLF (US banking sector).  The recent hurricanes and natural event disasters are surely to take a toll on the US consumer for a while.  Recent news has suggested that consumer spending is flat in certain areas and that GDP may flatten out a bit.  We assume delinquencies will begin to skyrocket based on displaced workers and jobs over the next 6+ months.  This leads us to believe a market correction would be a natural, and healthy, event in the immediate near future.

Markets just don’t “go up” perpetually.  This recent move higher has been one of the longest in history to not see a 5% or greater correction.  Markets need breadth in order to have healthy rotation and we are simply not seeing it recently.  This is why we believe any rotation or correction at this time could be bigger than most think.  Possibly retesting 2016 lows.


Chart_17-10-01_XLF_Washout


Notice the similarities in all of these charts.  It is almost like everything has been running on autopilot in terms of price appreciation within the US majors.  We do not have any indication of a sell trigger yet.  We would warn investors to be cautious at this time and to protect open long positions.  We do believe a price reversal in these US majors will begin before Oct 19th and quite possibly as early as October 4th or 5th.  Any moderate price advance early this week followed by immediate price weakness and rotation could be the setup of a much deeper price move.

If you want to continue to receive these types of detailed analysis reports, timely market triggers and analysis as well as Daily market updates, visit www.ActiveTradingPartners.com today and see why our members continue to value our content.  We are dedicated to assisting you in making better trading decisions and seeing what is in the future with our detailed market analysis and research.

RecentWinners


Are you prepared for the next major market move?  If not, visit www.ActiveTradingPartners.com today and see why you should consider joining our team of valued members.  Isn’t it time you invested in your future success?

Chris Vermeulen


Ichimoku Cloud Analysis 02.10.2017 (AUD/USD, NZD/USD, USD/CAD)

Article By RoboForex.com

AUD USD, “Australian Dollar vs US Dollar”

The AUD/USD pair is trading at 0.7810; the instrument is still moving below Ichimoku Cloud, which means that it may continue falling. We should expect the price to test Tenkan-Sen and Kijun-Sen at 0.7850 and continue moving downwards to reach 0.7720. However, this scenario may be cancelled if the price breaks the upside border of the cloud and fixes above 0.7970. In this case, the pair may continue growing towards 0.8105.


NZD/USD, “New Zealand Dollar vs US Dollar”

The NZD/USD pair is trading at 0.7186; the instrument is still moving below Ichimoku Cloud, which means that it may continue falling. We should expect the price to test Tenkan-Sen and Kijun-Sen at 0.7220 and then continue moving downwards to reach 0.7105. However, the scenario that implies further decline may be cancelled if the price breaks the upside border of the cloud and fixes above 0.7310. In this case, the pair may continue growing towards 0.7420.


USD/CAD, “US Dollar vs Canadian Dollar”

The USD/CAD pair is trading at 1.2506; the instrument is still moving above Ichimoku Cloud, which means that it may continue growing. We should expect the price to test Tenkan-Sen and Kijun-Sen at 1.2460 and then continue moving upwards to reach 1.2645. However, this scenario may be cancelled if the price breaks the downside border of the cloud and fixes below 1.2340. In this case, the pair may continue falling towards 1.2240.


RoboForex Analytical Department

Article By RoboForex.com

Attention!
Forecasts presented in this section only reflect the author’s private opinion and should not be considered as guidance for trading. RoboForex LP bears no responsibility for trading results based on trading recommendations described in these analytical reviews.

Catalonia has voted. What next for the euro?

By Tina Pham, Alpari

Catalonia voted for independence over the weekend. Preliminary results for yesterday’s vote show that an overwhelming majority of the region’s inhabitants want autonomy from the rest of Spain, with around 90% of those who turned up voting for independence. Out of the 5.5 million people who were eligible, 2.3 million turned up to vote. If we put the reaction from Spanish authorities and the police to one side, it’s clear that Catalonia has taken a big step forwards after years of discussions and making their will known. So, what’s next?

It’s highly doubtful that Catalonia will actually become autonomous since it’s a donor region to the rest of Spain; contributing to around 20% of the country’s GDP. Madrid, for example, is only second on this list. Catalonia is a region with a large tourism industry and a strong export market. Separating this important cultural hub from the rest of Spain would noticeably damage the touristic appeal of other parts of the country. Also, don’t forget about taxes. Catalonia is significantly wealthier than its neighbouring regions, so were it lo leave, these regions would lose the support they enjoyed form tax revenue redistribution.

All of this aside, there’s also the question of the Eurozone’s stability. In defining Catalonia’s autonomy, the question of Eurozone membership is an essential one, which poses a real threat to the integrity of all European economies.

Maintaining Spain’s territorial integrity will prevent any serious economic or financial turmoil, so Spanish authorities will now do everything they can to prevent this result from being implemented. There will likely be arguments that Catalonian autonomy would do harm to the region, such as for example, decreased accessibility for tourists, which would result in less sustainable production in Murcia and the surrounding regions.

The euro is declining against the dollar this morning, although trading volume is rather low. On Monday, much will depend on how the international community reacts to this news and what first steps the Spanish government will take. If proponents of independence remain resolute and Spanish authorities take an aggressive stance, the euro should fall below 1.1735. I don’t think we should expect a serious drop for the euro in connection with this result yet, although if the situation gets out of control (as it well could), the euro/dollar will lose ground very quickly.

Forex Technical Analysis & Forecast 02.10.2017 (EUR/USD, GBP/USD, USD/CHF, USD/JPY, AUD/USD, USD/RUB, GOLD, BRENT)

Article By RoboForex.com

EUR USD, “Euro vs US Dollar”

Being under pressure, the EUR/USD pair is being corrected. Possibly, the price may form the fifth descending wave with the target at 1.1630. The target of the first structure of this wave is at 1.1728. Later, in our opinion, the market may be corrected towards 1.1780.


GBP USD, “Great Britain Pound vs US Dollar”

The GBP/USD pair is trading to break 1.3373. The target of the descending wave is at 1.3263. After that, the instrument may be corrected towards 1.3428 and then start the fifth wave with the target at 1.3222.


USD CHF, “US Dollar vs Swiss Franc”

The USD/CHF pair is moving upwards. Possibly, the price may grow towards 0.9720 and then start a new correction to reach 0.9696, thus forming another consolidation range. If later the instrument breaks this range to the upside, the market may reach 0.9800; if to the downside – fall with the target at 0.9660.


USD JPY, “US Dollar vs Japanese Yen”

The USD/JPY pair has broken its consolidation range to the upside. We think, today the price may reach 113.26 and then continue falling towards 111.40.


AUD USD, “Australian Dollar vs US Dollar”

Being under pressure, the AUD/USD pair is still moving downwards. Possibly, the price may reach 0.7866 and then continue falling with the local target at 0.7753.


USD RUB, “US Dollar vs Russian Ruble”

The USD/RUB pair has reached the first target of another descending structure. Possibly, today the price may be corrected towards 58 and then continue moving downwards with the target at 57.


XAU USD, “Gold vs US Dollar”

Gold has broken 1277.50. We think, the price may reach 1267.00. Later, in our opinion, the market may start another correction with the first target at 1290.00.


BRENT

Brent is trading to rebound from 57.38. The downside target is at 55.88. After that, the instrument may form another ascending structure towards 59.85.


RoboForex Analytical Department

Article By RoboForex.com

Attention!
Forecasts presented in this section only reflect the author’s private opinion and should not be considered as guidance for trading. RoboForex LP bears no responsibility for trading results based on trading recommendations described in these analytical reviews.