Article By RoboForex.com
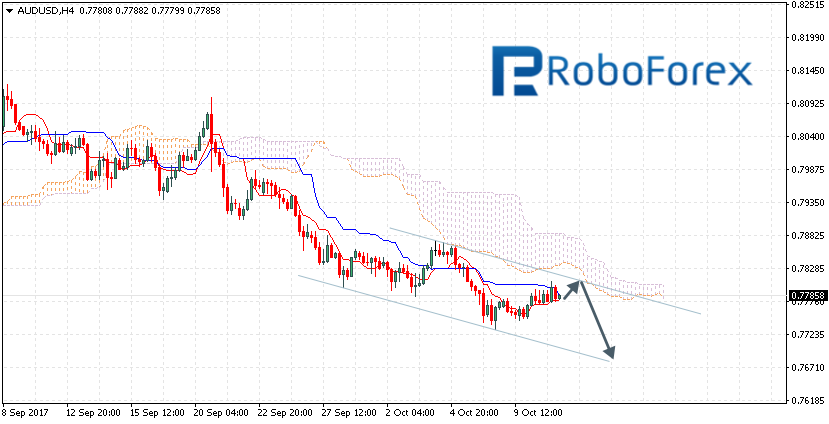
AUD USD, “Australian Dollar vs US Dollar”
The AUD/USD pair is trading at 0.7785; the instrument is still moving below Ichimoku Cloud, which means that it may continue falling. We should expect the price to test the downside border of the cloud at 0.7800 and continue moving downwards to reach 0.7685. Another signal to confirm this scenario is the price’s testing the upside border of the descending channel. However, the scenario that implies further decline may be cancelled if the price breaks the upside border of the cloud and fixes above 0.7850. In this case, the pair may continue growing towards 0.8010.
NZD USD, “New Zealand Dollar vs US Dollar”
The NZD/USD pair is trading at 0.7080; the instrument is still moving below Ichimoku Cloud, which means that it may continue falling. We should expect the price to test Tenkan-Sen and Kijun-Sen at 0.7120 and then continue moving downwards to reach 0.6980. Another signal to confirm this scenario is the price’s testing the upside border of the descending channel. However, the scenario that implies further decline may be cancelled if the price breaks the upside border of the cloud and fixes above 0.7155. In this case, the pair may continue growing towards 0.7325.

USD CAD, “US Dollar vs Canadian Dollar”
The USD/CAD pair is trading at 1.2500; the instrument is still moving above Ichimoku Cloud, which means that it may continue growing. We should expect the price to test the upside border of the cloud at 1.2495 and then continue moving upwards to reach 1.2650. Another signal to confirm this scenario is the price’s testing the downside border of the ascending channel. However, the scenario that implies further growth may be cancelled if the price breaks the downside border of the cloud and fixes below 1.2450. In this case, the pair may continue falling towards 1.2370.

RoboForex Analytical Department
Article By RoboForex.com
Attention!
Forecasts presented in this section only reflect the author’s private opinion and should not be considered as guidance for trading. RoboForex LP bears no responsibility for trading results based on trading recommendations described in these analytical reviews.